Contents
1. Modules
1.1. Alignment
Module to align several files together.
The contents of the files in term of protein name and peptide sequence can overlap or not. Each file is taken as a different experiment and therefore column names that are not standard (Protein, Sequence, Entry, ...) are renamed with a prefix (the filenames or prefixes provided by the user.)
- class MassSpecAlignmentYeast(filenames=None, verbose=True, prefixes=None)[source]
Align several Mass Spectrometry data files.
MS-DAS provides a set of 6 files to play with. Their paths can be obtained using function get_yeast_filenames():
from msdas import *
filenames = alignment.get_yeast_filenames()
yeast = alignment.MassSpecAlignmentYeast(filenames)
See MassSpecAlignmentBase for the list of columns to be found to perform the alignment/merging.
Since measurements may have the same names from one file to another, then need to be renamed.
Internallty, a prefix is added. It is populated with prefixes provided by the use; otherwise with the filenames themselves.
from msdas import *
m = MassSpecAlignmentYeast(get_yeast_filenames(),
                    prefixes = ["a0", "a1", "a5", "a10" "a20", "a45])
You can then create a MassSpecReader instance from the dataframe just created and save it to a file:
r = MassSpecReader(m)
r.to_csv("test_align.csv")
constructor
Parameters: - filename (list) – list of filenames (readable by MassSpecReader).
- verbose (bool) – verbosity set on by default
- class MassSpecAlignmentBase(filenames=None, verbose=True)[source]
Base Class related to Reading/Writing Mass Spectrometry data sets
This class gathers common functionalities for more specialised classes MassSpecAlignmentYeast.
Inputs can be a filename of a instance of MassSpecReader:
from msdas import *
m = MassSpecAlignmentBase()
r1 = MassSpecReader(get_yeast_filenames()[0])
r2 = MassSpecReader(get_yeast_filenames()[1])
df = m.merge([r1.df,r2.df])
The contents of r1 and r2 is similar (same column names). So columns must be renamed (except for the Proiten, Sequence and so on i.e. metadata).
See also
MassSpecAlignment, MassSpecAlignmentYeast, MassSpecAlignmentTCell.
Constructor
Parameters: - filename (str) – Not required but used by sub classes.
- verbose (bool) – verbosity set on by default
- AND = '^'
- df = None
the dataframe, set to None by default
- merge(dfs, on=None)[source]
Merge/align several dataframes
Parameters: - dfs (list) – list of dataframes to align
- on (list) – list of column to perform the merge on. If not provided, use the merge_on attribute (Protein, Sequence, Psite, Sequence_Phospho).
Note
This is a merge using the merge function from pandas library. the merge is performed using the how parameter set to outer.
- merge_on = None
list of column names to performed the merge on ‘Protein’, “Sequence”, ‘Psite’, ‘Sequence_Phospho’
- mode
get/set mode of the MassSpecReader
1.2. Cluster measurements with clustering module
Clustering utilities
- class MSClustering(data, mode='default', fillna=True, verbose=True, cleanup=False)[source]
Clustering utilities
This class is used to perform clustering analysis on measurements to be found in a msdas.readers.MassSpecReader instance.
The data extraction consists in selecting a subset of the initial dataframe provided by the Reader classes. The selection is made on (1) the protein name that can be given by the user or not, and (2) the time measurements are kept only. This is achieved via the get_group().
Currently, only the Affinity propagation algorithm is provided. It can be used via the run_affinity_propagation_clustering() method or directly with the Affinity class.
Here is an example that reads data, creates a MSClustering instance and finally performs a clustering with the affinity propagation algorithm.
from msdas import *
y = MassSpecReader(get_yeast_small_data(), mode="YEAST")
c = MSClustering(y)
c.run_affinity_propagation_clustering(preference=-120)
constructor
Parameters: - data – can be either a dataframe obtained from MassSpecReader or an instance of MassSpecReader itself.
- mode (str) – must be yeast.
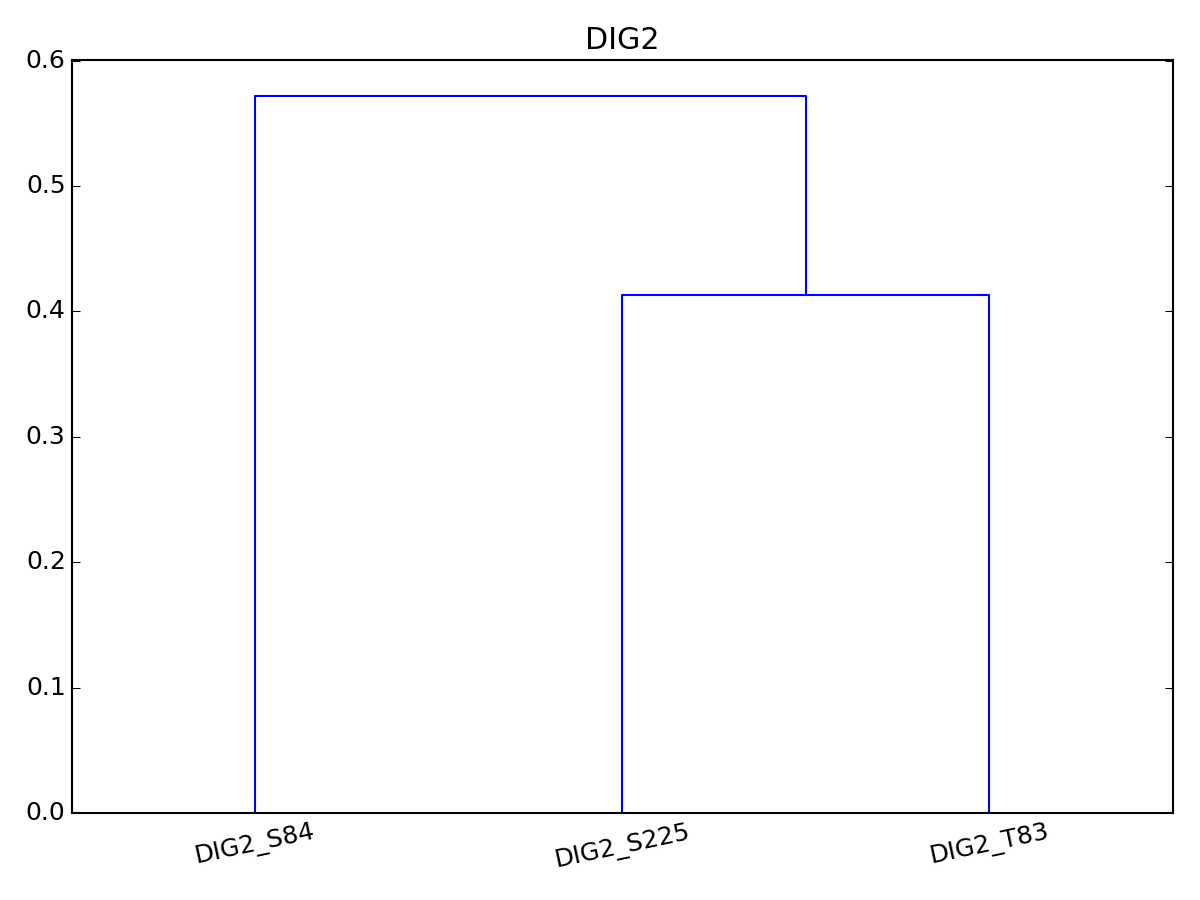
- dendogram(name=None, method='euclidean', metric='euclidean', p=2, pdist=False, rotation=90, **kargs)[source]
Dendogram. In progress, please do not use or with care.
Parameters: - name – name of the protein to perform dendogram on. IF none, all proteins are selected
- method – euclidean or dot
- pdist – pdist computes the Euclidean distance between pairs of objects in m-by-n data matrix X. Rows of X correspond to observations, and columns correspond to variables.
- rotation – rotation of xlabels (protein name + psite)
- kargs – any valid parameter of the scipy dendogram function
import pylab
from msdas import *
y = MassSpecReader(get_yeast_small_data())
c = MSClustering(y, mode="YEAST")
c.dendogram("DIG2", pdist="euclidean")
# equivalent to c.dendogram("DIG2", method="euclidean")
pylab.figure(2)
c.plot_vectors("DIG2")
Note
pdist has many metrics and we recommand to use the pdist argument in place of method parameter, which maybe deprecated in the future.
- get_group(name=None, tag='onlyCD3')[source]
Returns a subset of the original dataframe (stored in df)
If name is provided, only the protein corresponding to that name is selected, otherwise all proteins are kept. Then, only columns related to time measurements are kept (ie. protein columns and non numeric columns are ignored).
In the yeast case, the criteria to select time measurements is to keep columns that starts with the letter a.
In the tcell case, “Nor_Unstimulated” column is selected as as as columns starting with “Nor” and containin the tag provided(e.g., onlyCD3) indices on time are renamed as 00, 05, 10, 30.
- groups
Returns all group for each protein. Alias to dataframe.groupby(‘Protein’)
- plotClusteredProtein(name, scale=True, fontsize=8, **kargs)[source]
For a given protein, plot time series by group/label
If a group does not have the protein in it, then nothing is plotted.
Note
the affinity propagation algorithm must have been run before.
- plotClusters(**kargs)[source]
Alias to Affinity.plotClusters()
- plotClusters_and_protein(name, **kargs)[source]
Alias to Affinity.plotClusters_and_protein()
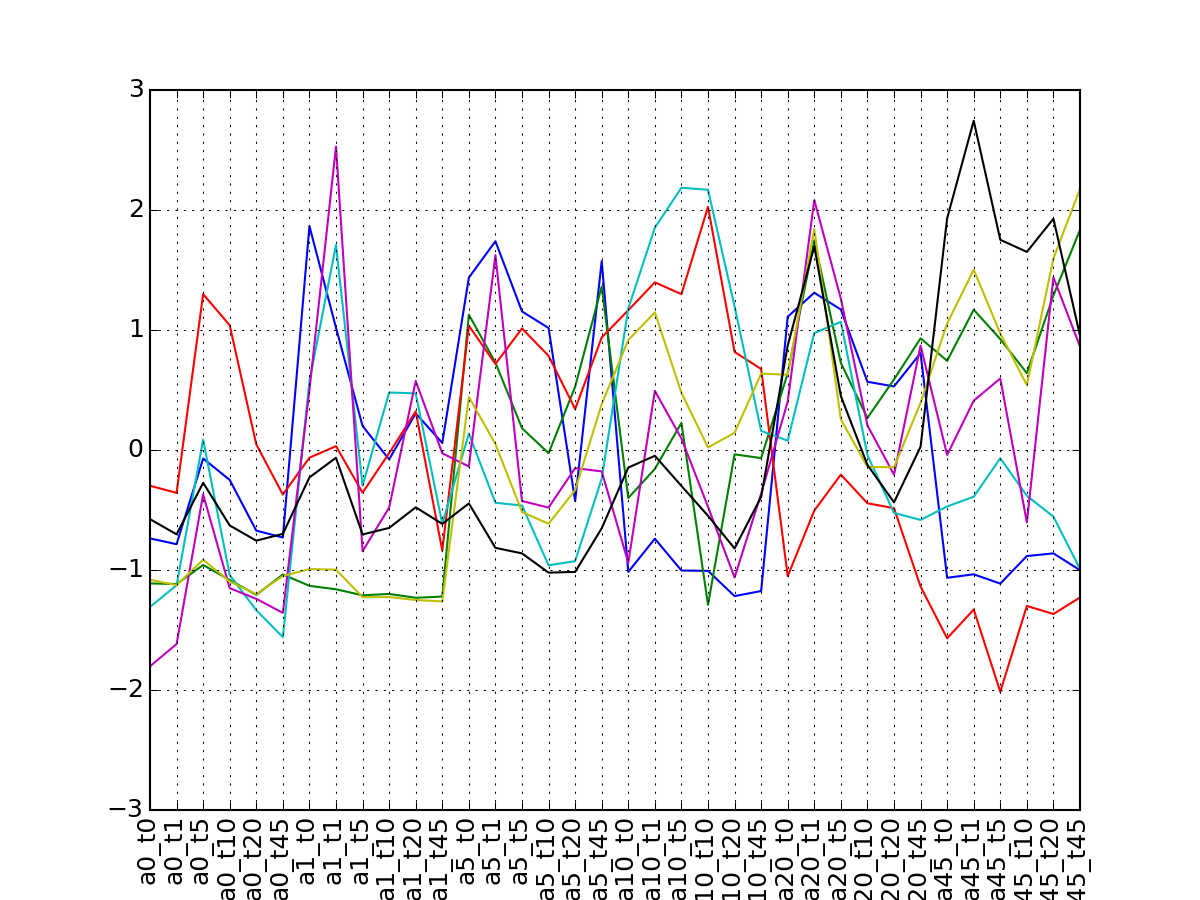
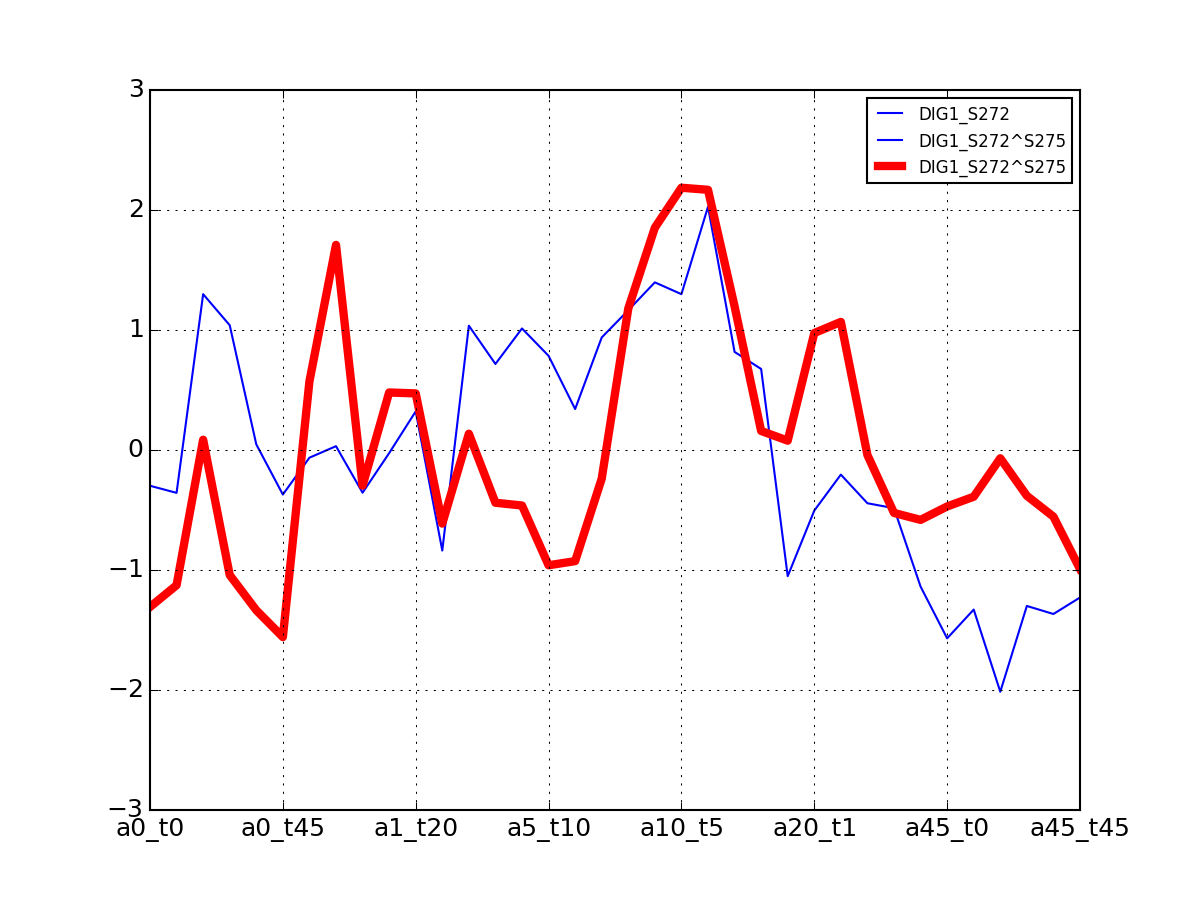
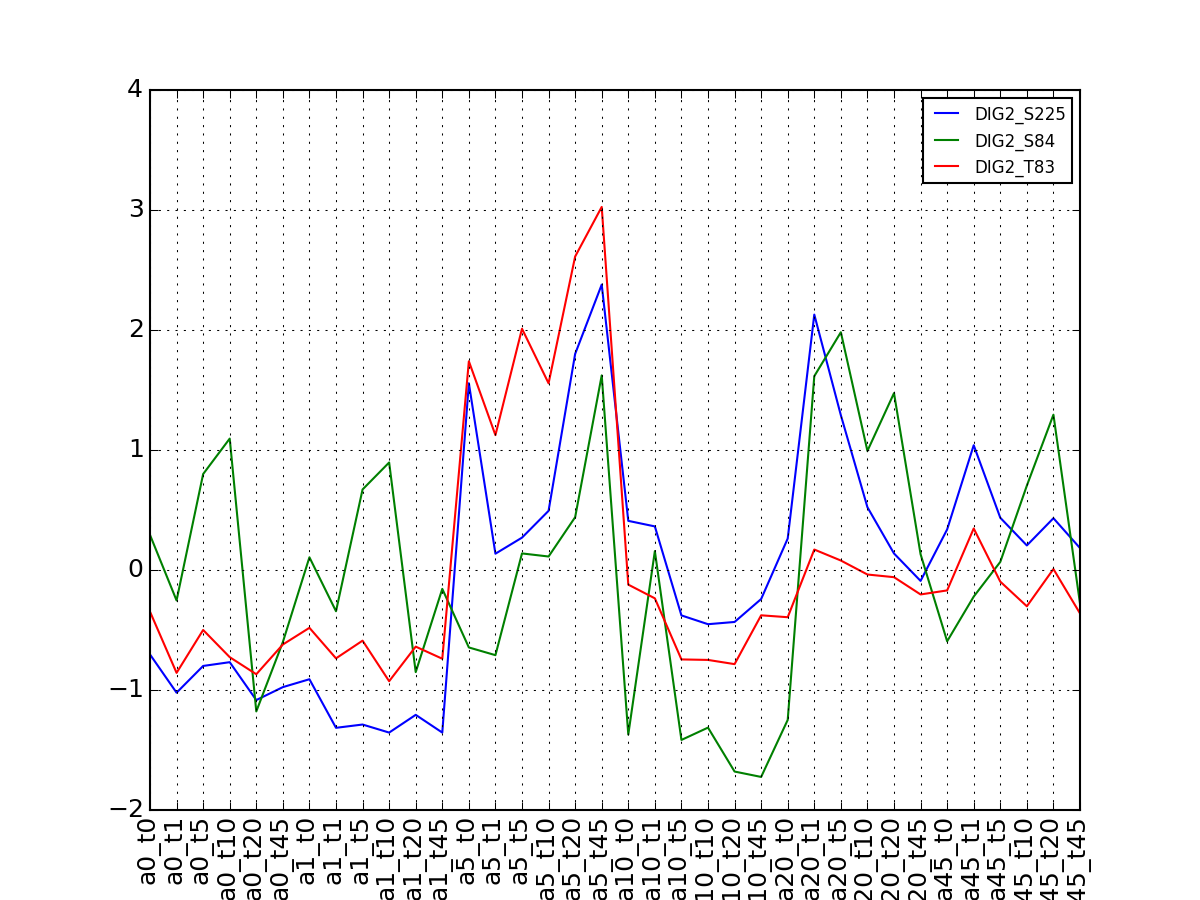
- plot_vectors(name, normalise=False, scale=True, legend=True, subplots=False, fontsize=8, **kargs)[source]
Plot time series or data of the time measurements for a group of protein (i.e. individual peptides).
Parameters: - name – must be a valid protein name (see df.Protein) or None to select all proteins.
- scale (normalise,) – mutually exclusive pre processing option to normalise or scale the data before plotting.
- legend (bool) – add the legend or not
- fontsize – used for the legend
- kargs – any option accepted y the plot method used by the pandas dataframe. location and fontsize are used for the legend
>>> from msdas import *
>>> y = MassSpecReader(get_yeast_small_data())
>>> c = MSClustering(y)
>>> # c.run_affinity_propagation_clustering(-90)
>>> c.plot_vectors("DIG1", normalise=False, scale=True, legend=False)
(Source code, png, pdf)
- run_affinity_propagation_clustering(protein=None, preference=-30)[source]
Run the affinity propagation algorithm
Parameters: - name (str) – a protein name. If None, consider all proteins. (Defaults to None)
- preference (float) – the affinity propagation preference parameter. should be negative. Large negative values gives less clusters.
Returns: an affinity instance that can be manipulated to extract labels, cluster, or plot the clusters. See Affinity for more details
The original data stored in df will contain anew column called cluster will the label of each cluster.
Warning
NA are filled with zero for now.
- scale(df)[source]
scale a df and returns the scaled version.
This can be used on the numeric dataframe returned by get_group().
from msdas import *
df = MassSpecReader(get_yeast_small_data())
c = MSClustering(df)
subdf = c.get_group()
scaled_subdf = c.scale(subdf)
where the standard deviation is the biased one computed with numpy as X.std(ddof=1).

- class Affinity(data, method, affinity_matrix=None, preference=-30, damping=0.9, transpose=False, verbose=True)[source]
Apply affinity propagation clustering on MS data set.
Get some data first. It must be a dataframe that contains the measurements as columns and the Psites as indices. It can be the output of MSClustering.get_group() method.
>>> from msdas import *
>>> y = MassSpecReader(get_yeast_small_data(), mode="YEAST")
>>> c = clustering.MSClustering(y)
>>> af = c.run_affinity_propagation_clustering(preference=-90)
>>> # OR
>>> data = c.get_group()
>>> af = Affinity(data, preference=-90, method="euclidean")
>>> af.plotClusters()
>>> af.nclusters
7
>>> labels = af.labels
>>> center_indices = af.cluster_centers_indices
The data will be scaled using the scale() method.
Similarly for the cell except that the method should be correlation instead of euclidean. In which case, the correlation is performed internally.
contructor
Parameters: - data (DataFrame) –
- method – either euclidean or correlation.
- affinity_matrix –
- preference – the affinity propagation parameter that affects the number of clusters. (default is -30)
- damping (float) – values between 0.5 and 1 (stricly). (default is 0.9 to be similar to what is used in R affinity propagation routine)
- transpose (bool) – transpose the affinity matrix before calling the affinity propagation algorith. Should be used if euclidean distance method is selected.
Note
the dataframe is scaled internally using
- AffinityPropagation(preference=None, damping=None, max_iter=200)[source]
The core of the Affinity Propagation algorithm.
This method uses scikit-learn
Parameters: - preference – the affinity propagation parameter that affects the number of clusters. (default is -30)
- damping (float) – values between 0.5 and 1 (stricly). (default is 0.9 to be similar to what is used in R affinity propagation routine)
- max_iter (int) – 200 by default
Populates affinity_results with the results of the clustering.
- cluster_centers_indices
Returns indices of each cluster center
- labels
Returns labels of the clustering
- nclusters
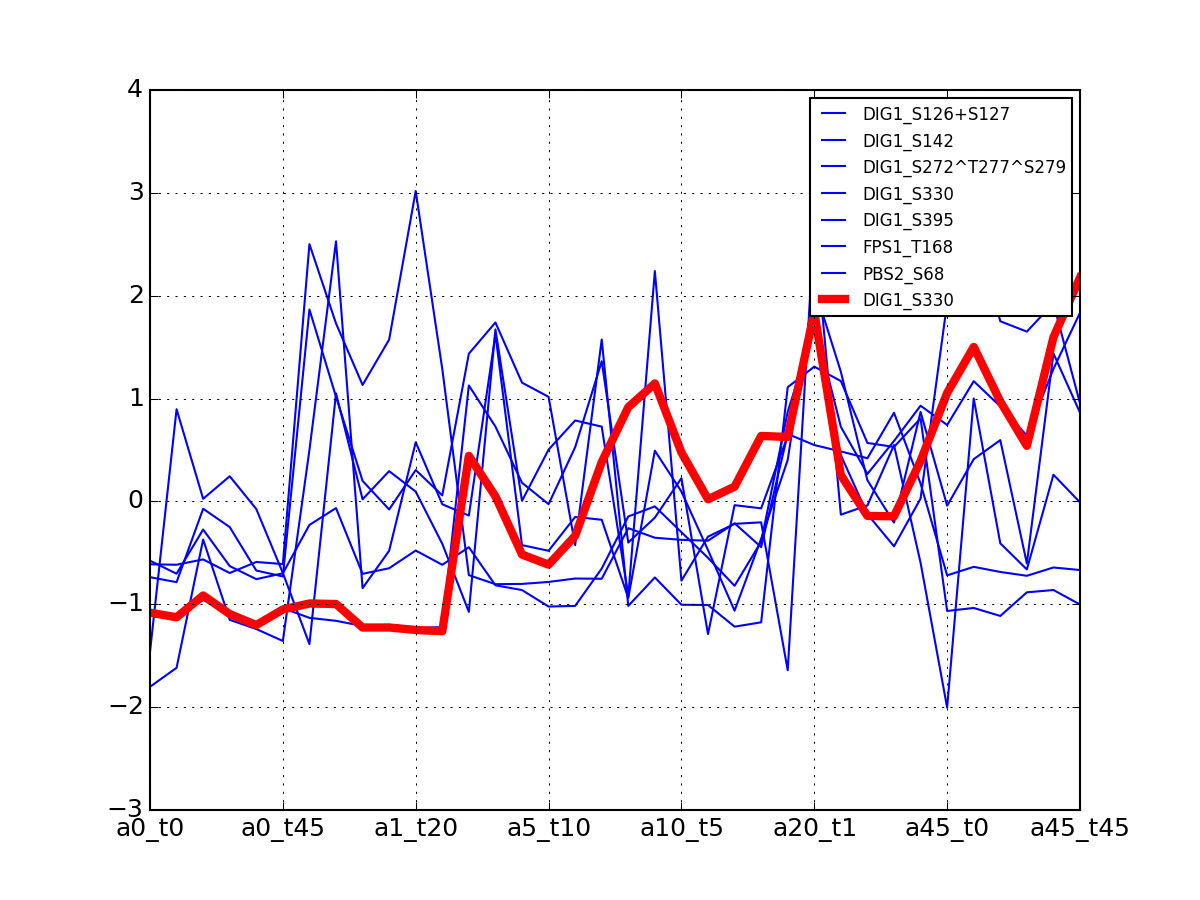
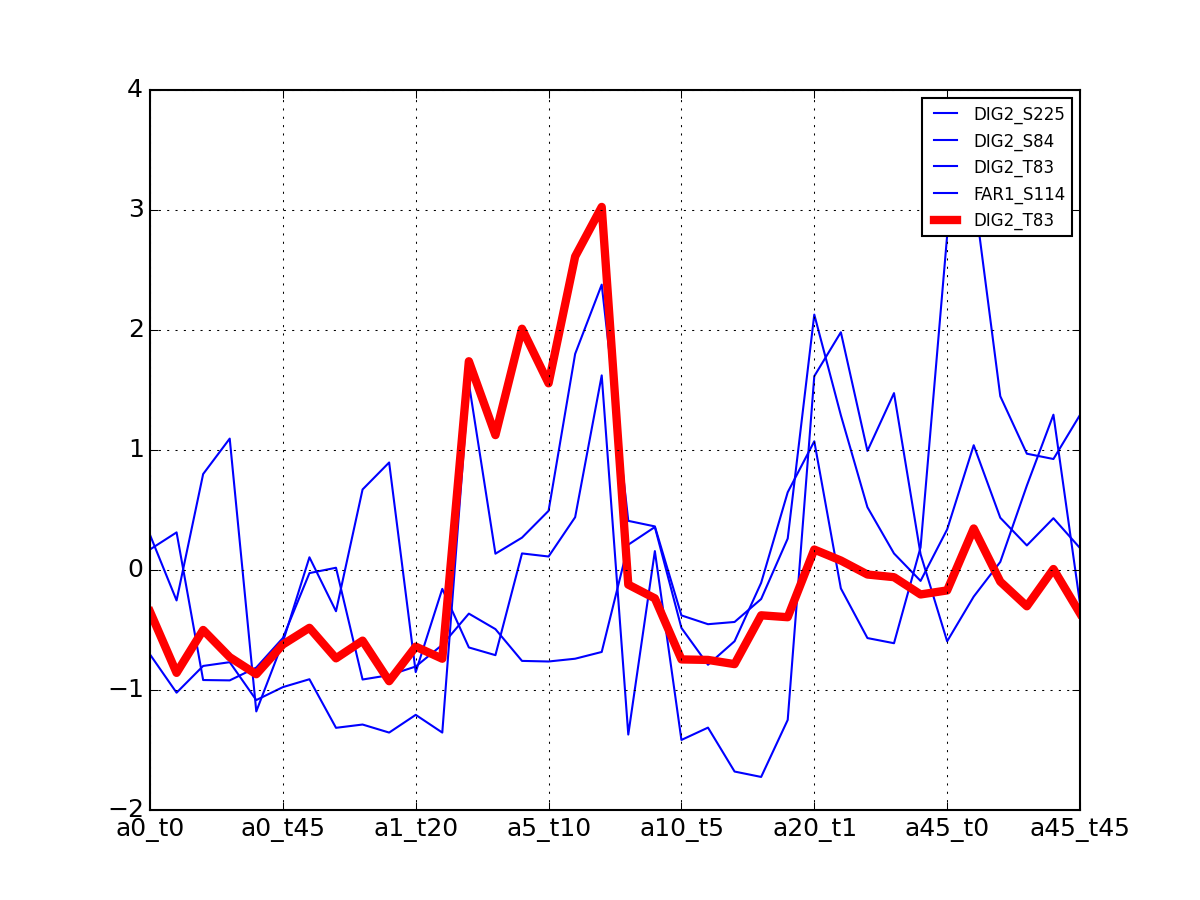
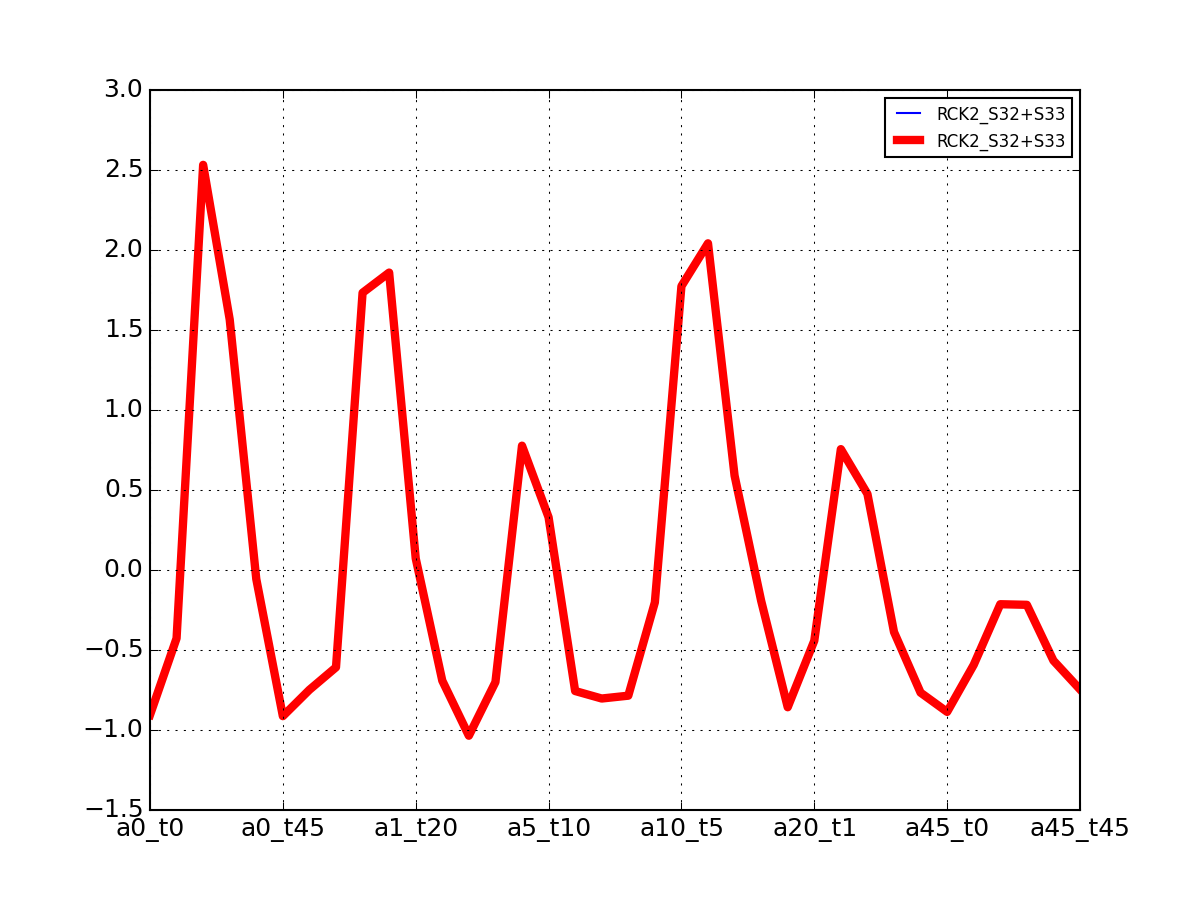
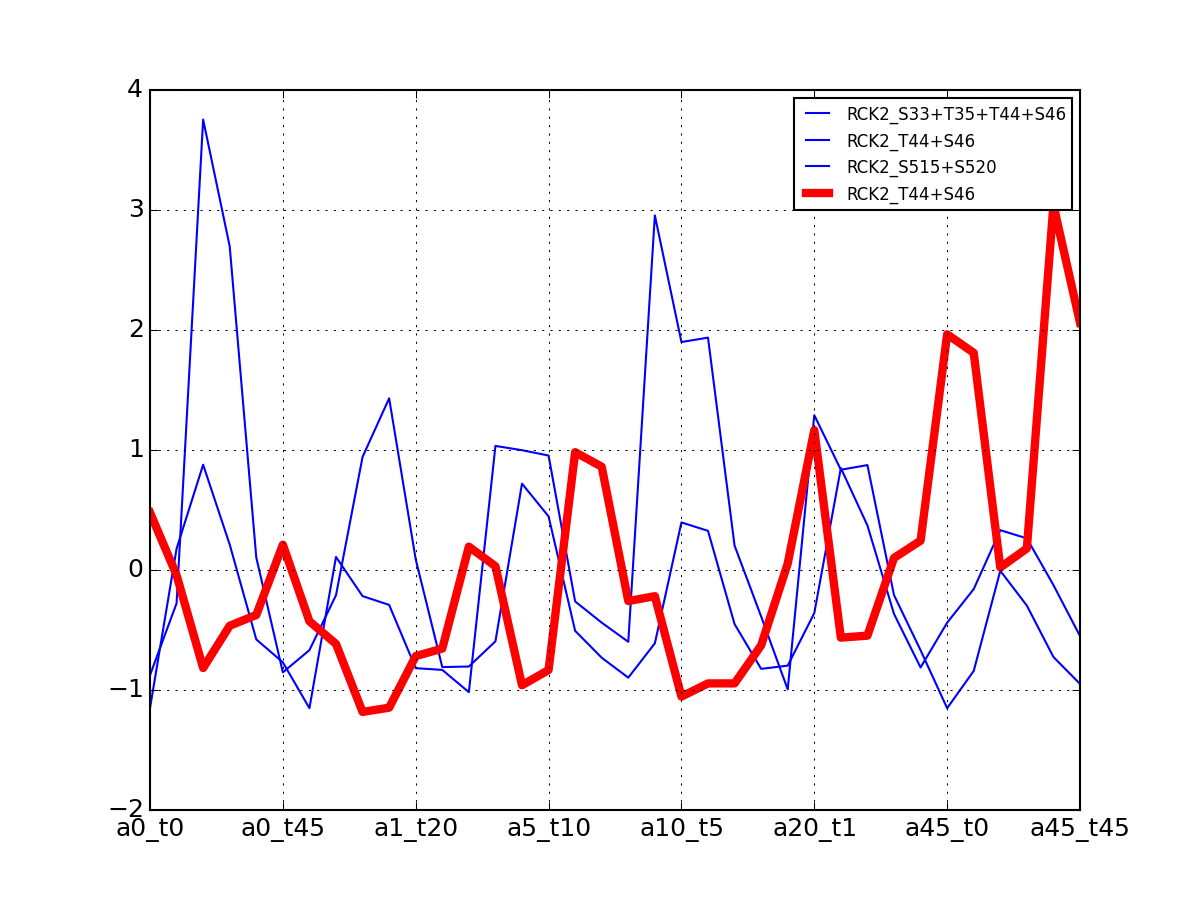
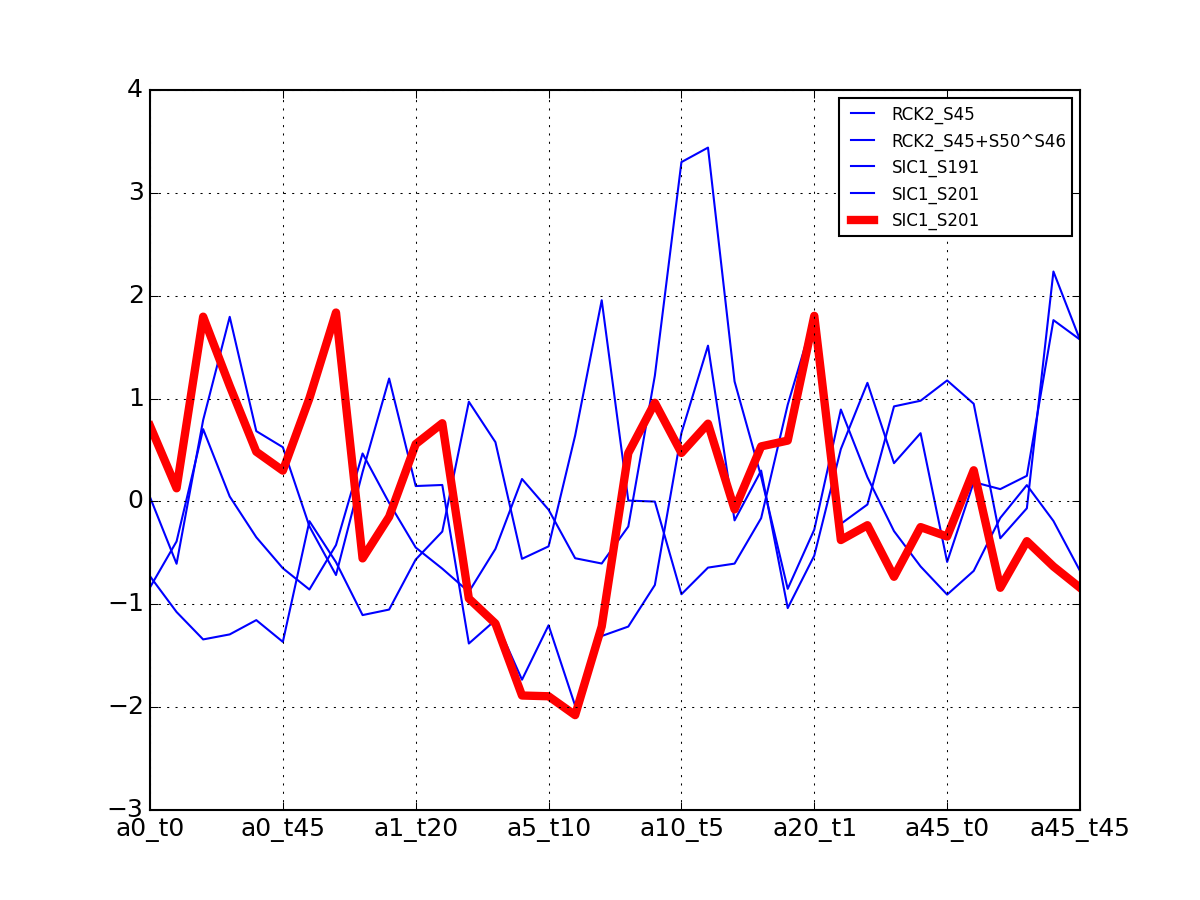
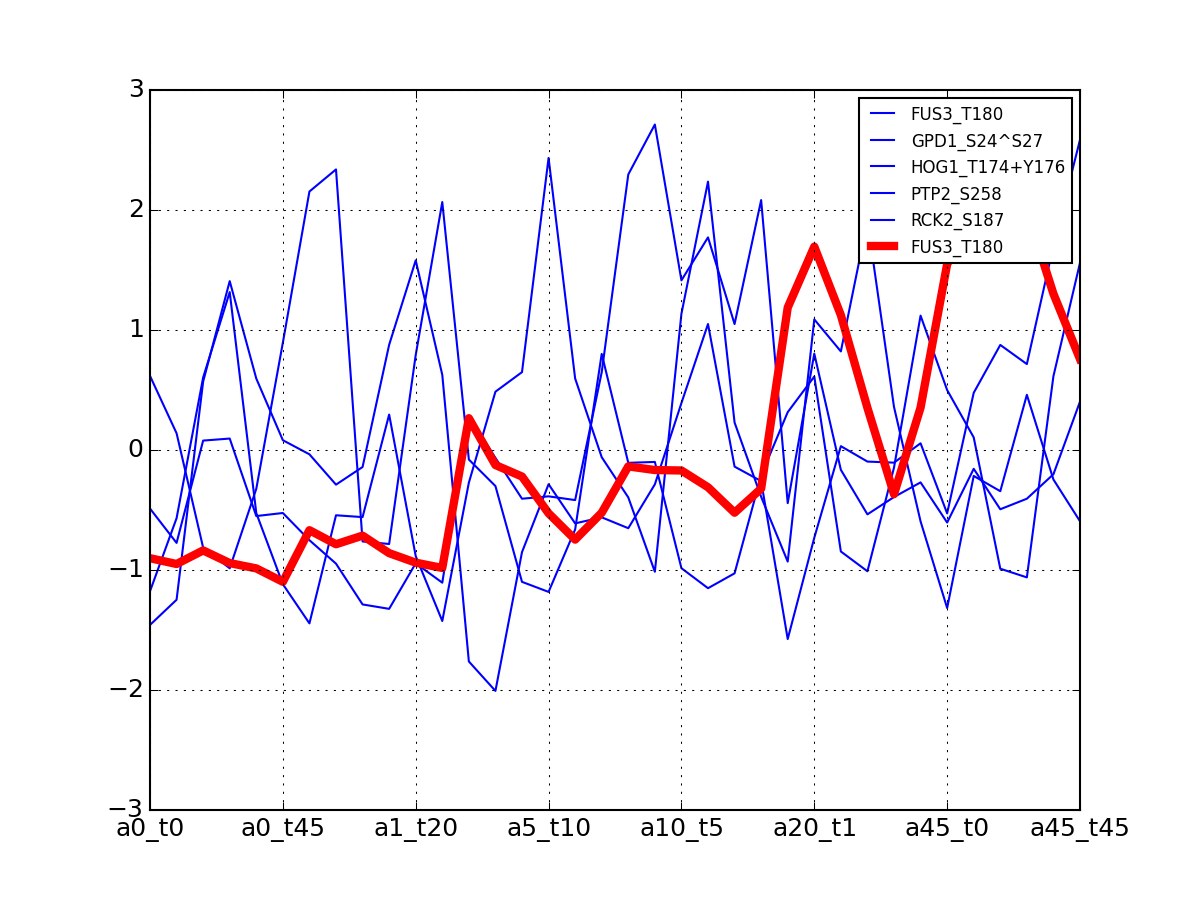
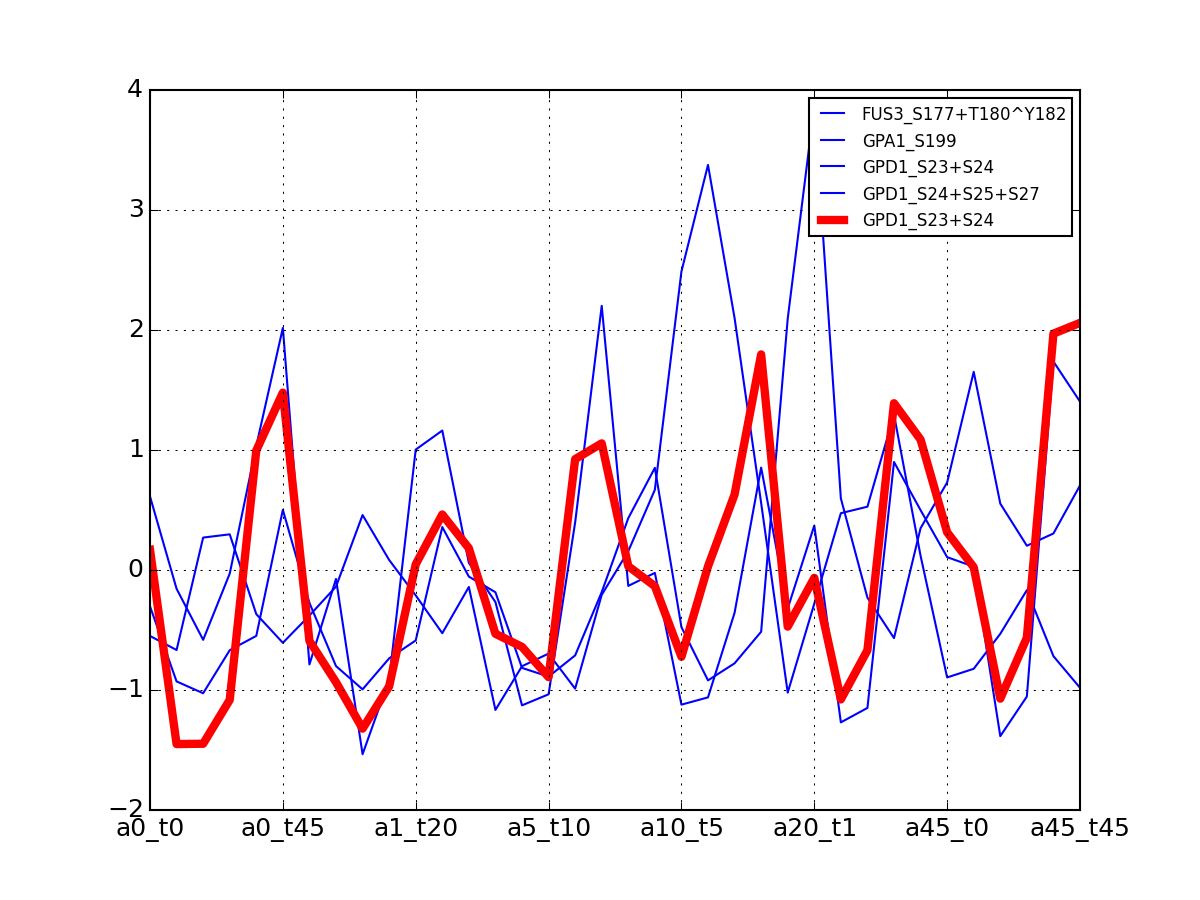
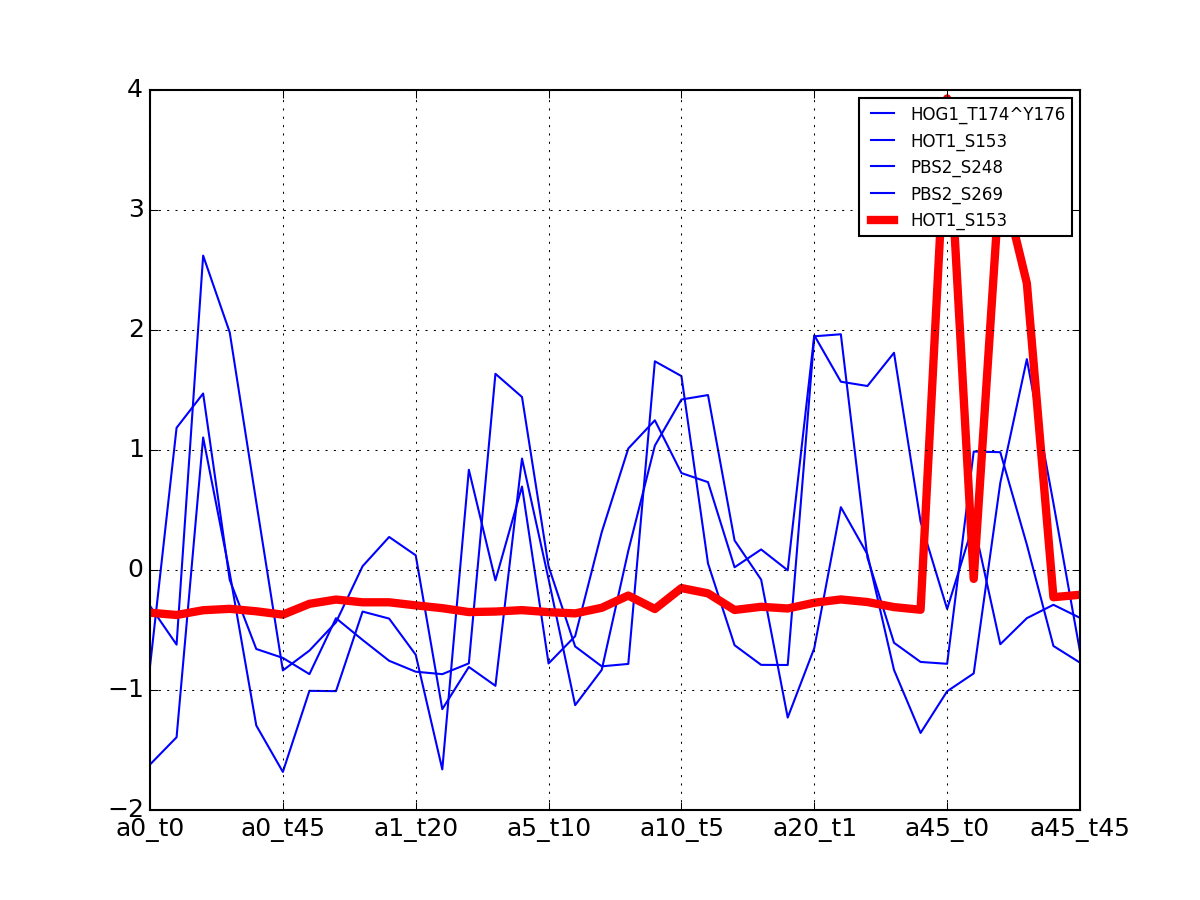
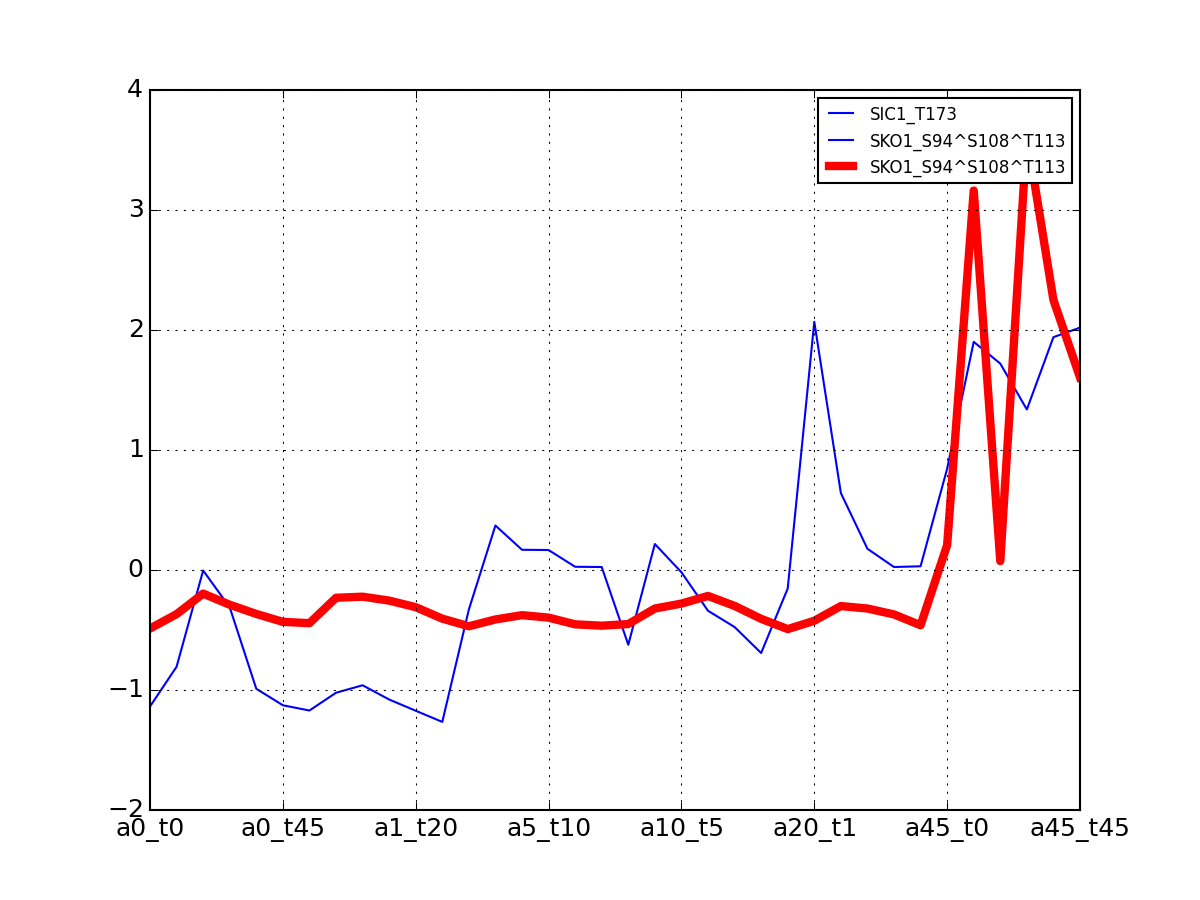
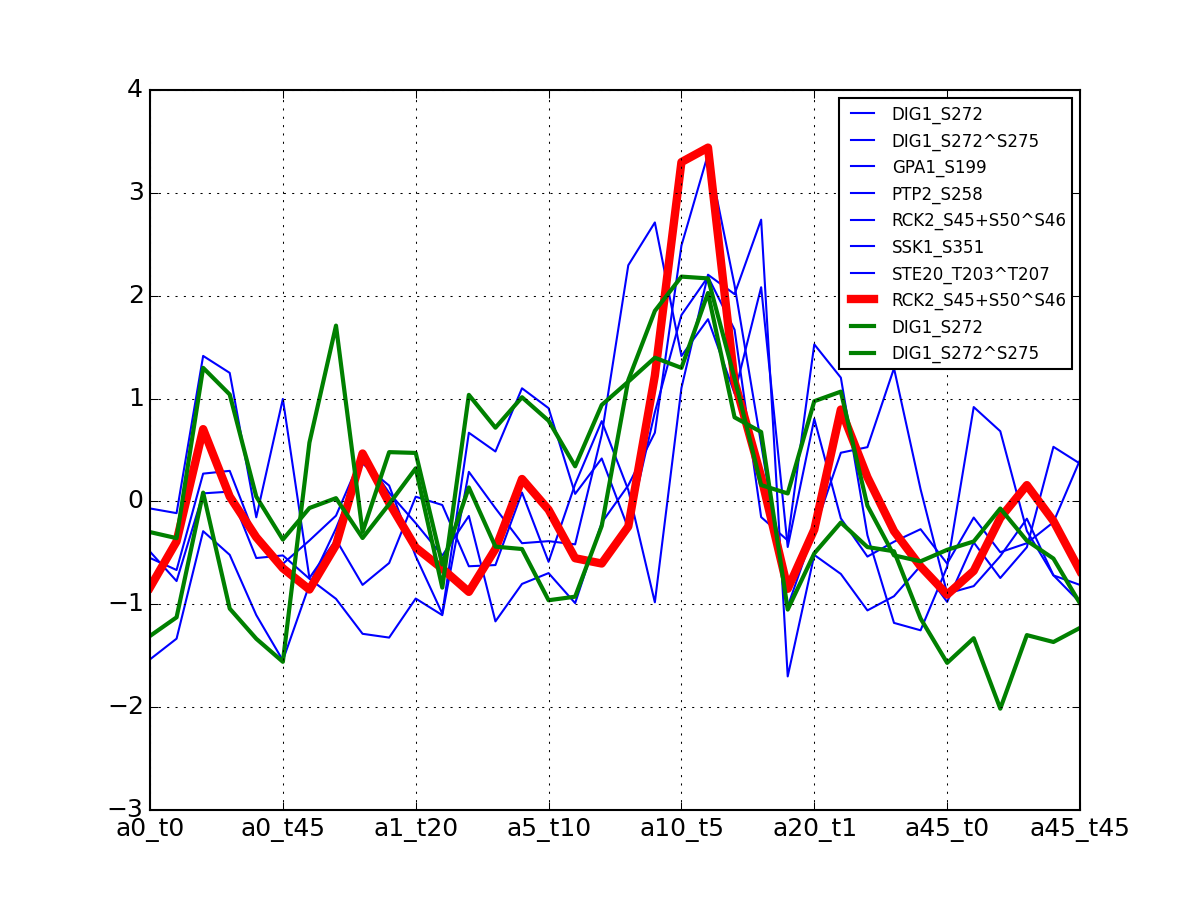
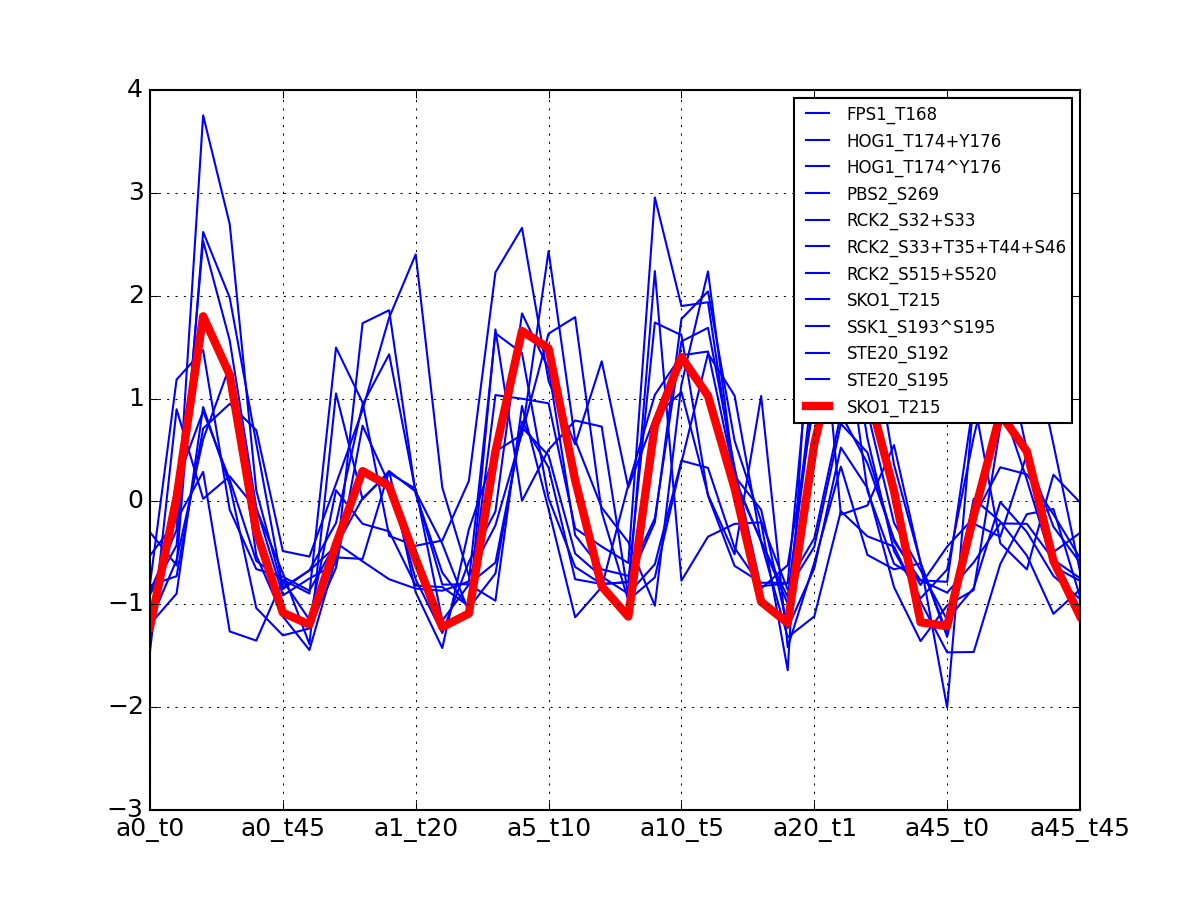
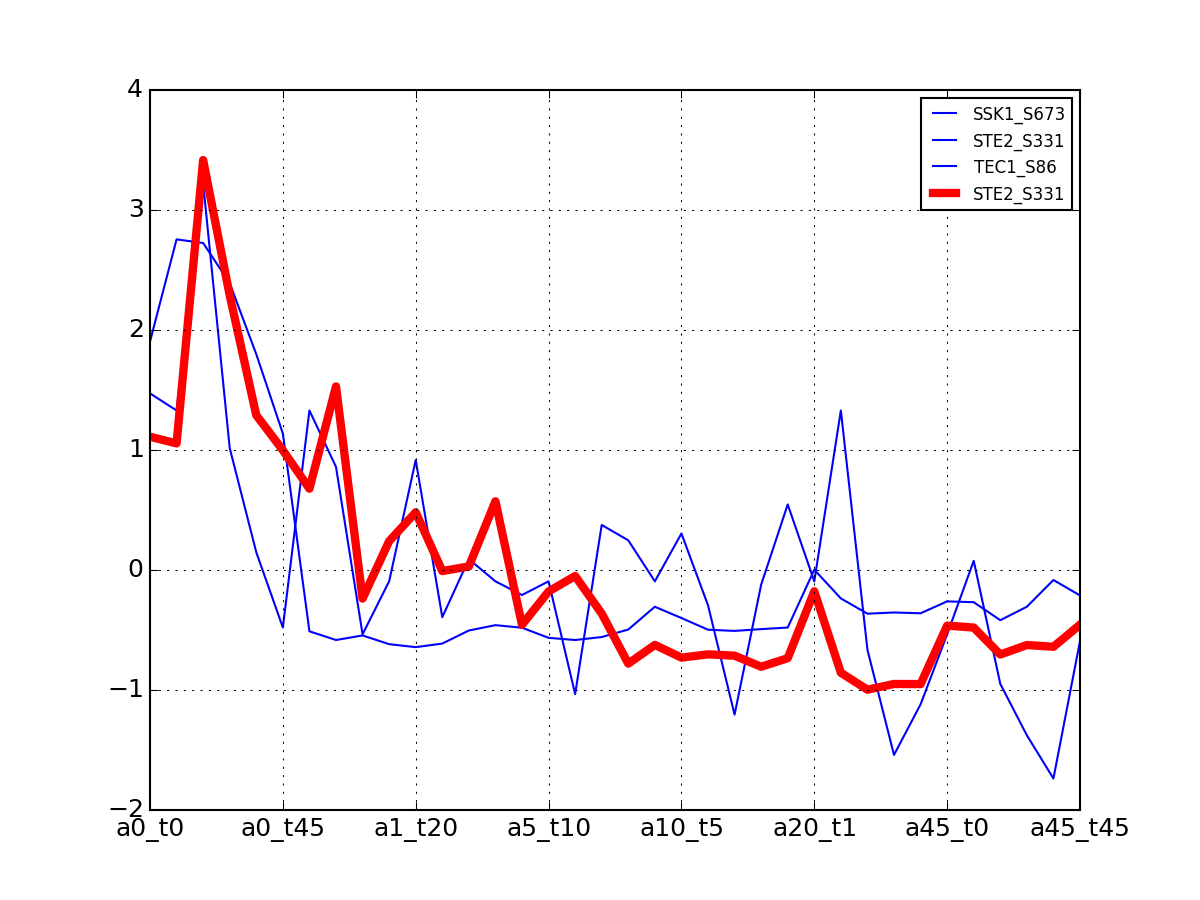
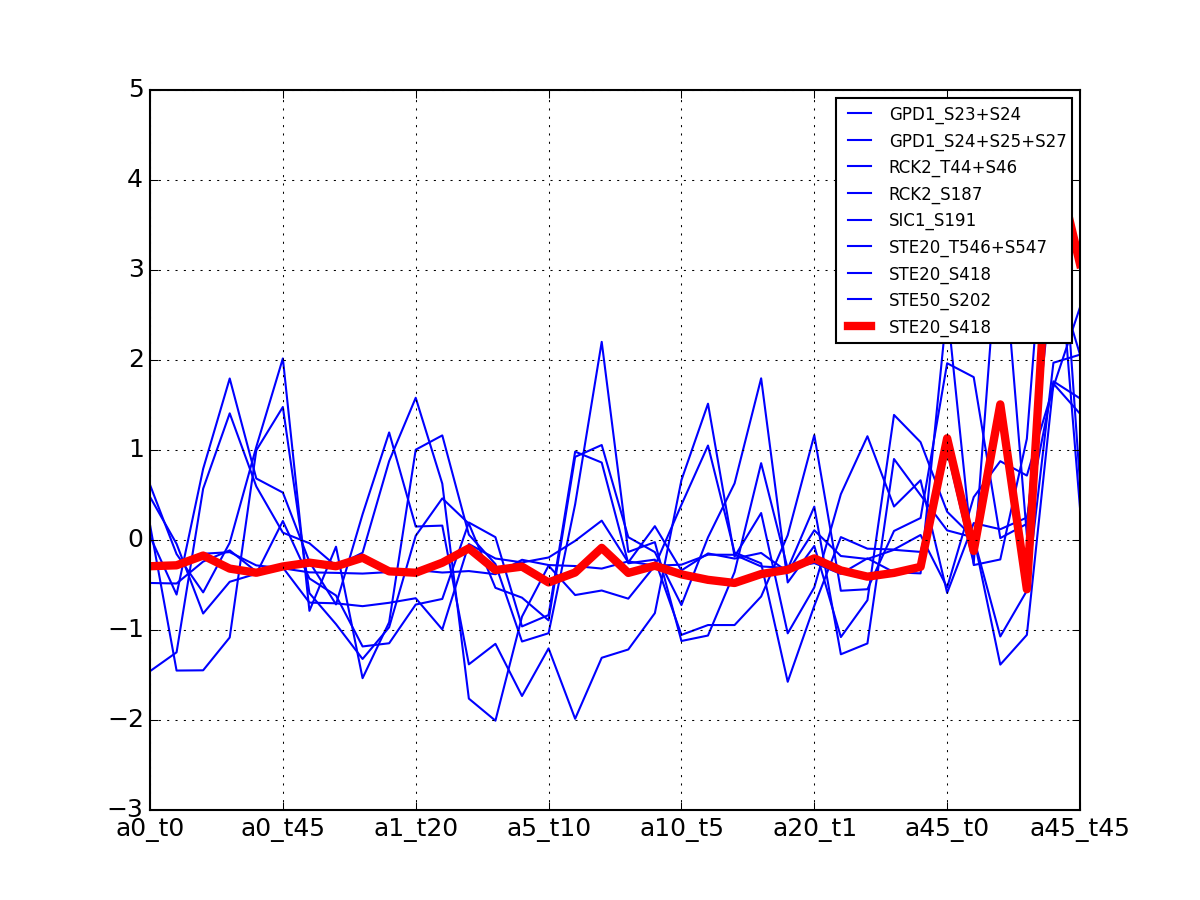
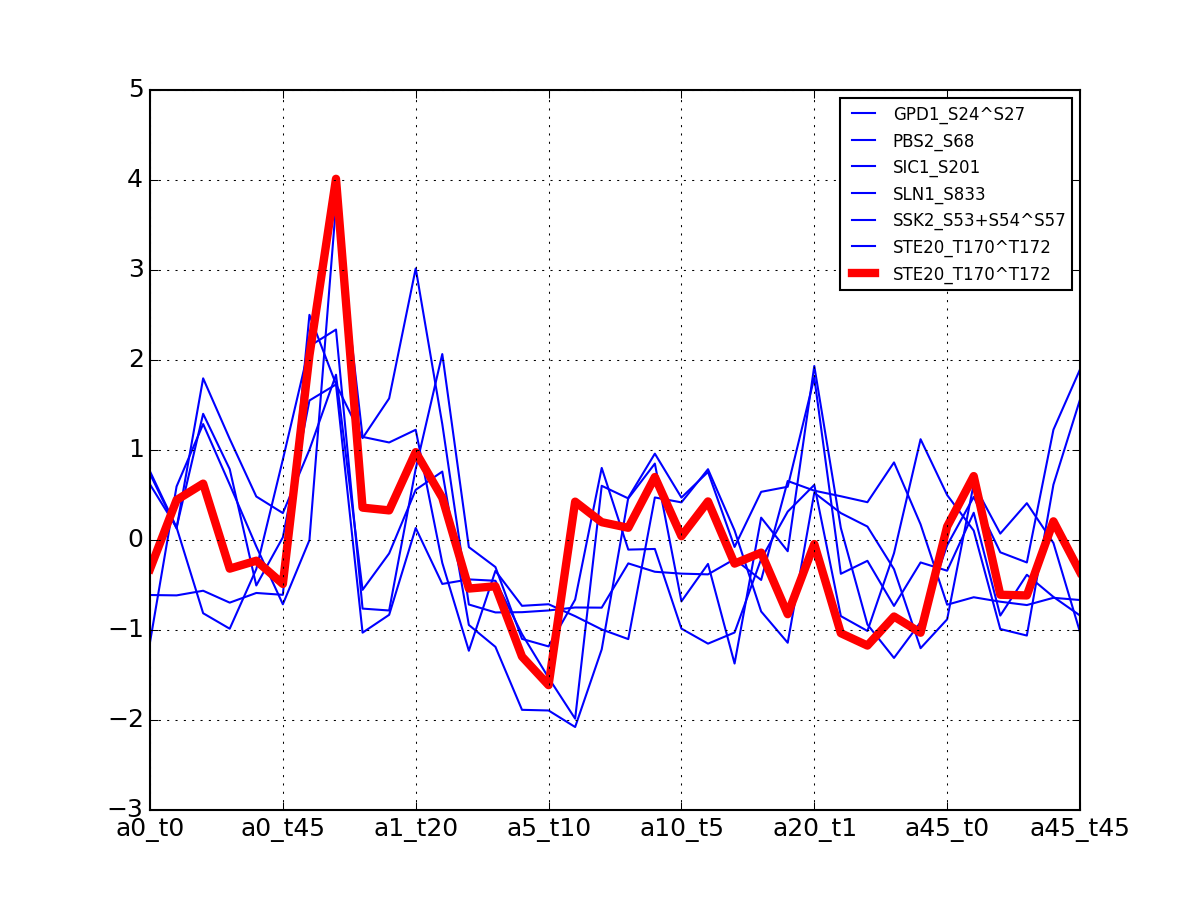
- plotClusters(legend=True, fontsize=8, **kargs)[source]
Plots N figures related to the N clusters found with all time series
See class documentation for an example
See also
All timeseries for a given cluster are plotted in blue. The exampler in red.
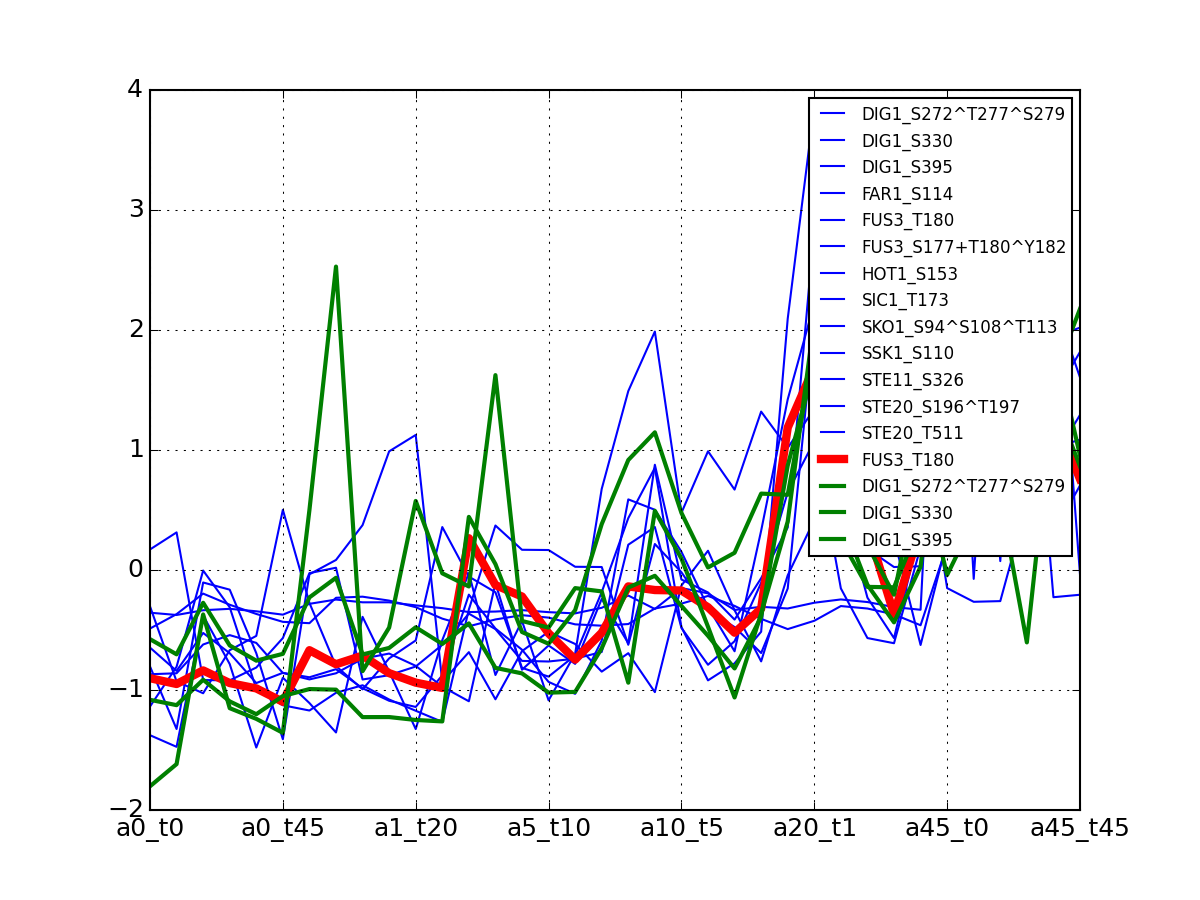
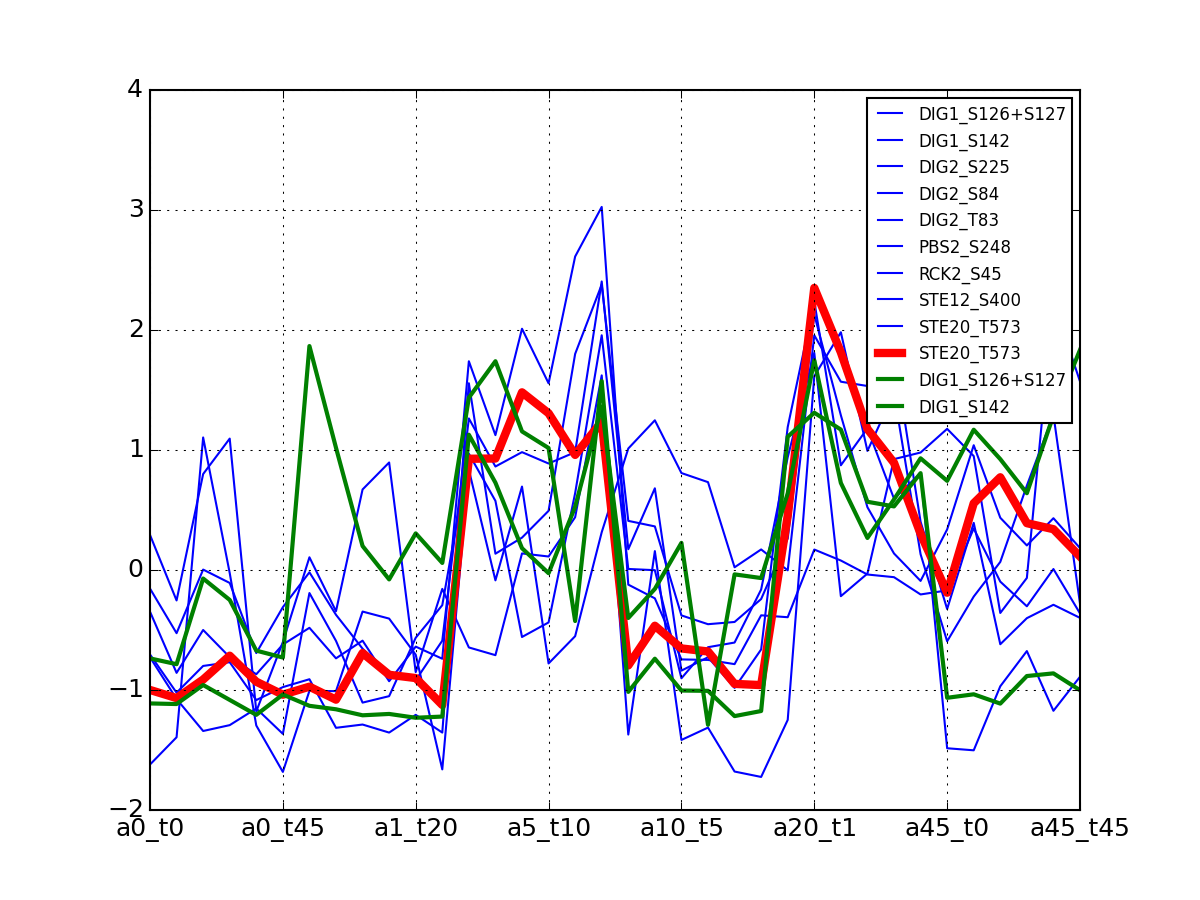
- plotClusters_and_protein(name, fontsize=8, legend=True)[source]
Same as plotClusters but superimposed a specific protein if present
All timeseries for a given cluster are plotted in blue. The exampler is in red and the time series matching the name provided are in green.
>>> from msdas import *
>>> y = MassSpecReader(get_yeast_small_data(), mode="yeast")
>>> c = clustering.MSClustering(y)
>>> af = c.run_affinity_propagation_clustering(preference=-90)
>>> af.plotClusters_and_protein("DIG1", legend=True)
- preference


1.3. yeast data to PKN and MIDAS
- get_yeast_filenames(mode='subset')[source]
Returns the list of filenames related to the YEAST data
Parameters: mode (str) – valid values are subset or all. If subset, filenames looked for are files called alphaX.csv . If mode is set to all, filenames looked for all files called MaX_annotated_CLEAN_COMPACT_Normedian_FINAL.csv Returns: list of 6 full path names related to the YEAST data set (6 files) The corresponding files are sorted by times (ie, 0, 1, 5, 10, 20, 45). The 6 filenames must be provided as input to the MassSpecAlignmentYeast.
See also
- class YEAST2MIDAS(data=None, rawdata=None, verbose=False)[source]
Class pipeline to read/cluster/write yeast data into MIDAS/PKN.
The constructor of this class performs the following tasks:
- Reads small data set (with the interpolated data)
- Reads the raw data set (with replicates)
- Cleanup and merging similar to what was done in the small dat set (see below for details)
- Creates an instance of msdas.clustering.MSClustering
Tools are provided to
- Reads a PKN and build a MIDAS from the data. A new PKN is generated with new names containing the psites.
- plot time series
- perform clustering
YEAST2MIDAS is also a msdas.readers.MassSpecReader so you can get lots of plotting tools in addition to those provided within this class.
Here is an example:
>>> from msdas import yeast
>>> y = yeast.YEAST2MIDAS(get_yeast_small_data(), get_yeast_raw_data())
>>> # get a new data frame containing only exemplars
>>> df = y.get_df_exemplars(preference=-30)
>>> c = y.get_expanded_cnograph("PKN.sif", df)

>>> # create the new MIDAS and a CNOGraph for the new PKN
>>> c, m, e = y.export_pkn_and_midas("../share/data/PKN-yeast.sif")
Details: The dataframe df contains all measurements and extra information such as the protein/psites/sequence/uniprot_entry. The measurements itself is made of a subset of the 36 measurements, which are combination of 6 times and 6 alpha experiments.
You can imagine the data as a matrix 6 by 6. The measurements that are kept for MIDAS are made of the first row, first column and main diagonal.
The raw data is preprocessed using the msdas.replicates.ReplicatesYeast and follows those steps:
- drop rows where peptide contains an oxidation msdas.readers.Cleaner.drop_oxidation()
- Merge peptide with identical peptide sequence (but different psites)
- clean rows with too much NAs using clean_na_paper() and clean_na_paper()
- Drop rows with only NAs
- normalise the data using the TIC values
- Call fix_duplicated_identifier() (rename duplicated identifiers)
Constructor
Parameters: - data – optional data set (default to get_yeast_small_data())
- rawdata – optional data set (default to get_yeast_raw_data())
- cleanup_june()[source]
Cleanup the raw and small data set.
The small data set contains labels that are incorrect and do not represent what pre-processing was performed.
Besides, interpolation (and extrapolation) were applied.
In order to replace the interpolated values by NA, we need to know the correct label. See mapping_small_to_raw_june(). This method replaces the interpolated values by NAs in the df dataframe, relabel corerctly the identifiers and removes rows in the big dataframe replicates that are now useless
FUS3_S177^T180+S177^Y182+T180^Y182’, ‘HOG1_T174^Y176’ time zero are missing for now, we keep the data with interpolated values.
- FAR1_S114 has no t0 values. Downstream of PKN. Removed for now
- 3 RCK2 have no t0 values. Downstream of PKN. Removed for now
- export_pkn_and_midas(pkn_filename, preference=-30, tag='undefined')[source]
Creates the expanded PKN and MIDAS file given PKN and normalise method
Saves new PKN and MIDAS into PKN-Yeast_psites.sif and MD-Yeast_psites.cv
Parameters: - pkn_filename (str) –
- preference (float) – the parameter of the Affinity Propagation algorithm. See msdas.cluster.Affinity
Returns: a tuple with cnograph and midas instances.
- get_coefficient_variation(identifier, default_cv=0.5)[source]
Return CV for a particular identifier
Todo
could be in replicates
- get_df_exemplars(preference=-30, normalise=None)[source]
Returns a normalised dataframe that corresponds to the exemplars
The psites are obtained from get_psites_exemplars().
Parameters: - preference (float) – the parameter of the Affinity Propagation algorithm. See msdas.cluster.Affinity
- normalise – minmax / maxonly / timezero. Set to None to ignore normalisation
- get_errors(default_cv=0.5)[source]
Return errors (coefficient variation) for each identifier
To get the actual errors scaled, you need to multiply by the mean, that is the data itself.
Todo
could be move to replicates module
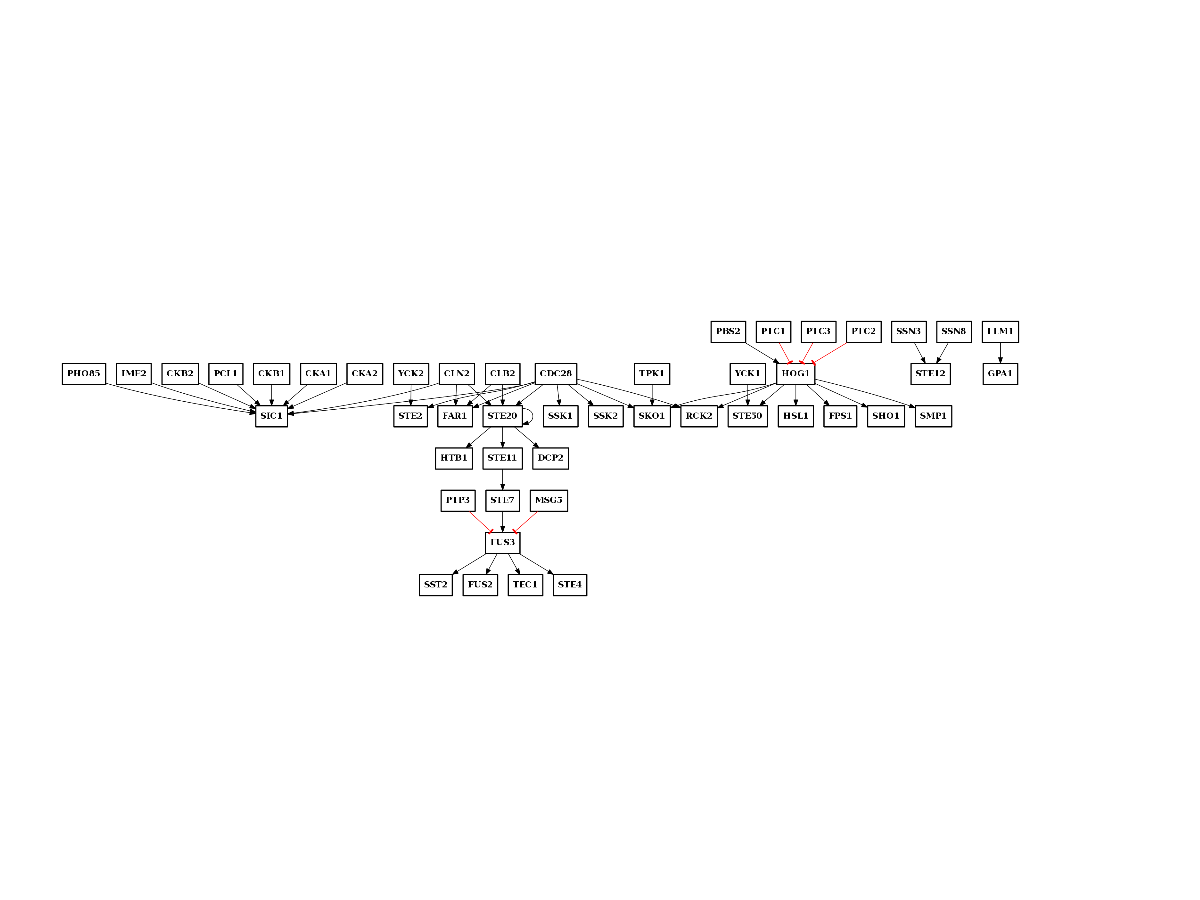
- get_expanded_cnograph(filename_pkn_no_sites, df)[source]
Expands node in a SIF into their psites
Parameters: - filename_pkn_no_sites (str) – a valid filename to a PKN in SIF format.
- df (dataframe) – a dataframe with protein/psites names as indices like the output of get_df_exemplars().
Returns: a CNOGraph instance
df = y.get_df_exemplars(-1)
y.get_expanded_cnograph("../../share/data/PKN-yeastScaffold.sif", df)
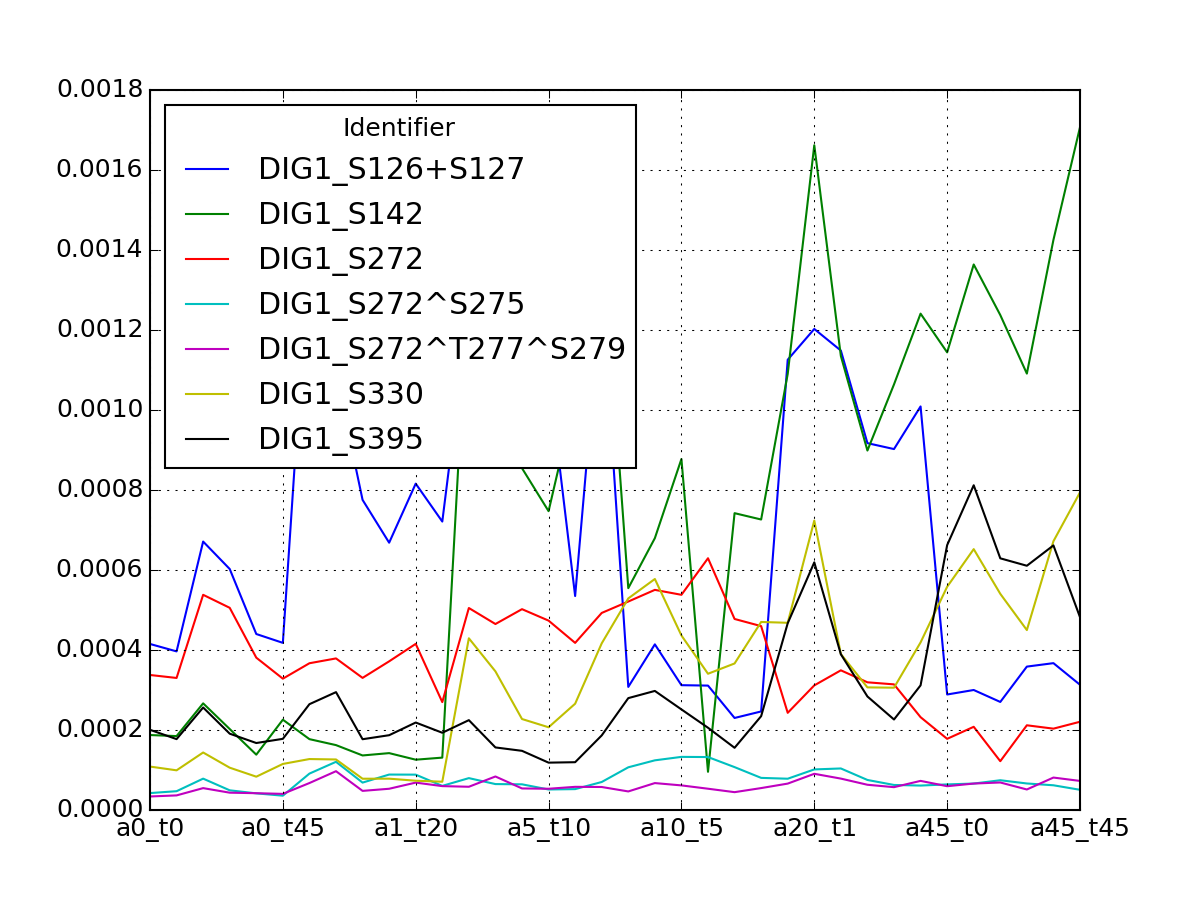
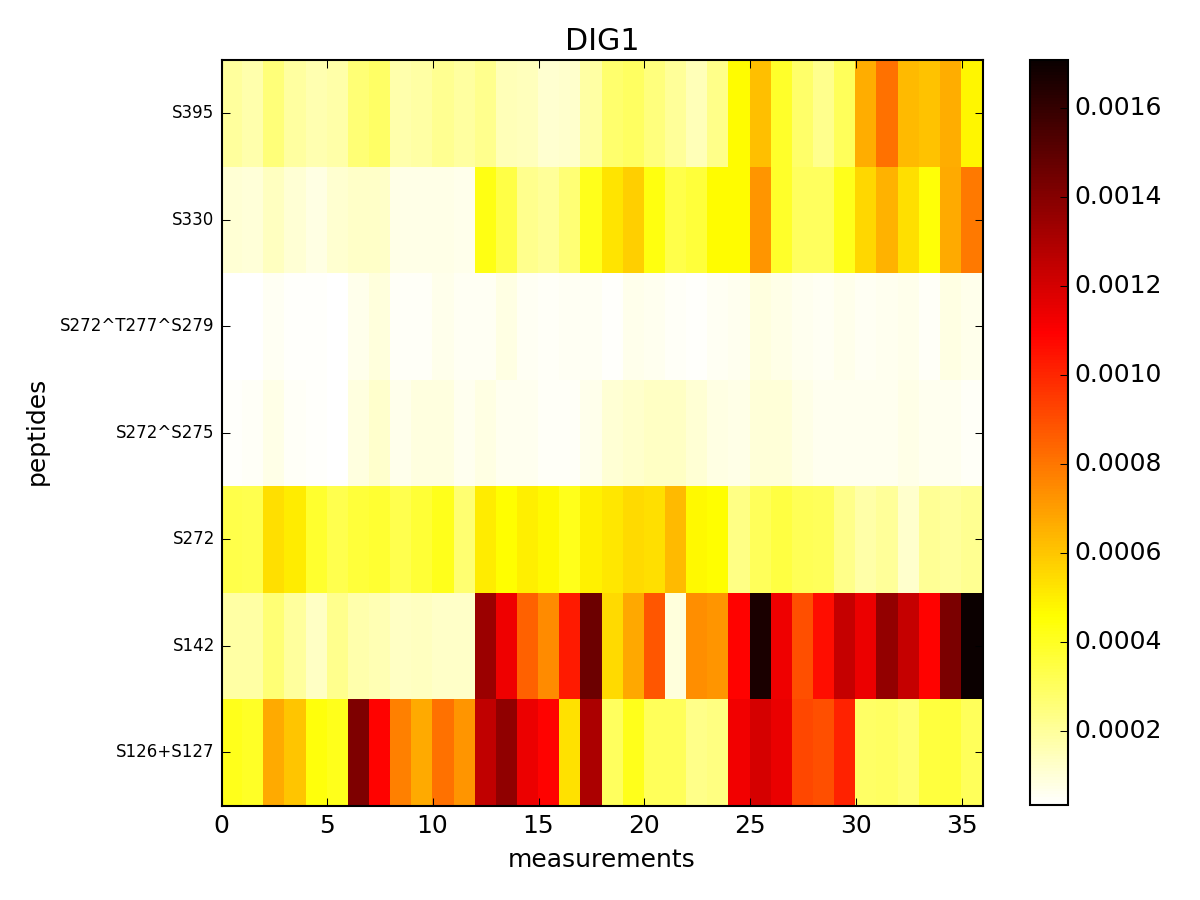
- get_group_psite(name)[source]
Get a dataframe containing a groupd of psites for one protein
Parameters: name (str) – a valid protein name. See df.Protein to get a list Returns: dataframe (indices are psites, columns are measurements for ech combination of alpha/time (see class documentation) >>> from msdas import yeast >>> y = yeast.YEAST2MIDAS() >>> y.get_group_psite("DIG1").plot()
(Source code, png, pdf)

See also
- get_group_psite_transposed(name)[source]
Get a dataframe containing a group of protein
Parameters: name (str) – a valid protein name. See df.Protein to get a list Returns: transposed dataframe (indices are psites, columns are measurements for ech combination of alpha/NaCl See also
- get_psites_exemplars(preference=-30)[source]
Returns list of psites corresponding to the exemplars found in the clustering
Parameters: preference (float) – the parameter of the Affinity Propagation algorithm. See msdas.cluster.Affinity Affinity propagation algorithm is run on each protein. For each of them, clusters and their exemplars are found. This method returns the list of exemplars
>>> psites = y.get_psites_exemplars(preference=-30)
See also
- get_psites_mapping(preference=-30)[source]
Returns exemplars and the list of proteins in the same cluster
Affinity propagation algorithm is run on each protein. For each of them, clusters and their exemplars are found. This method returns a dictionary where each key is an exemplar and its value contains the list of protein/psites that belongs to this cluster.
Parameters: preference (float) – the parameter of the Affinity Propagation algorithm. See msdas.clustering.Affinity Returns: dictionary as explained in the documentation here above. See also
- groups
get the dataframe indices grouped by proteins (alias to cluster.groups)
- groups_cluster()[source]
Returns dataframe grouped by protein and clustered.
You must run run_affinity_propagation_clustering() before hand to populate the cluster column.
>>> y.cluster = y['DIG1']
>>> y.cluster.run_affinity_propagation_clustering(preference=-30)
>>> y.groups_cluster()
- interpolate_time0(identifier, cmap='hot_r', method='cubic')[source]
Parameters: method – ‘linear’, ‘nearest’, ‘cubic’
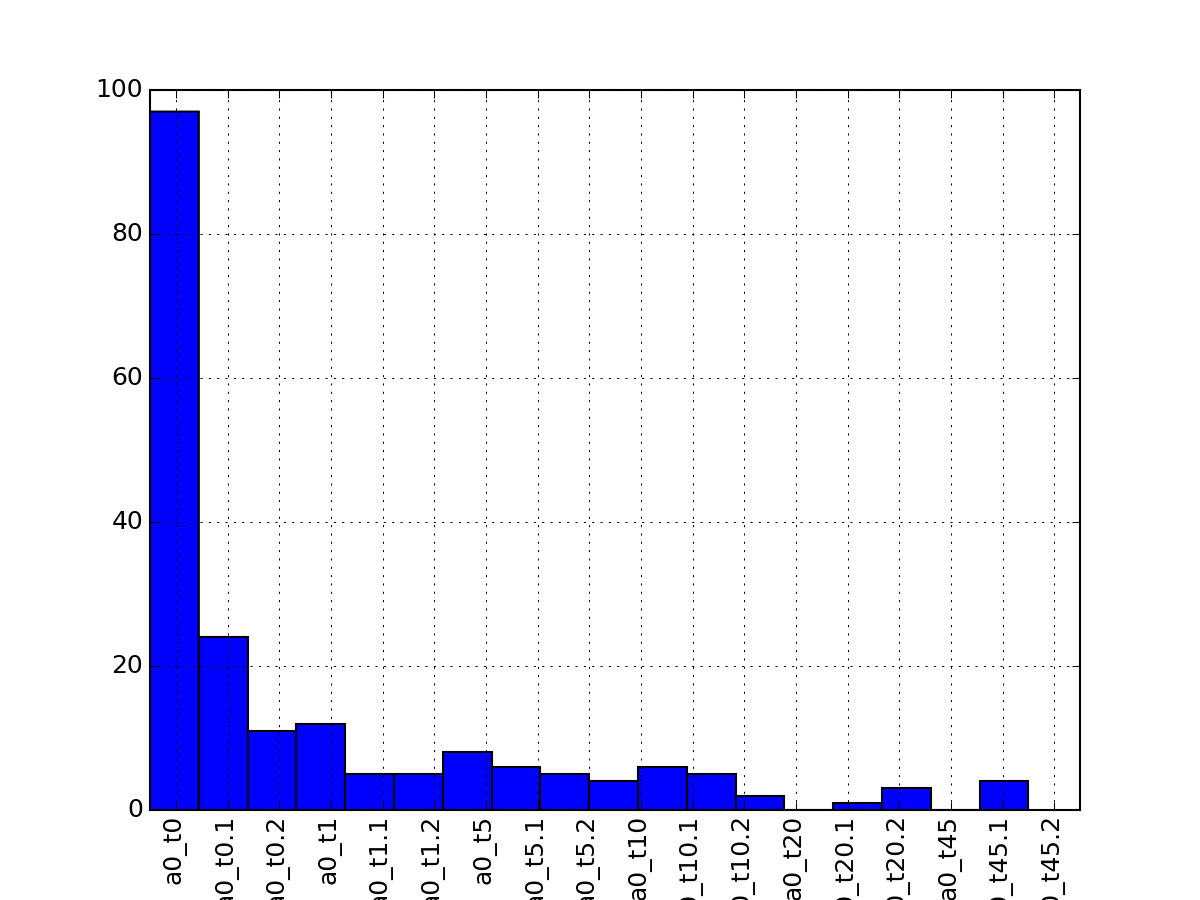
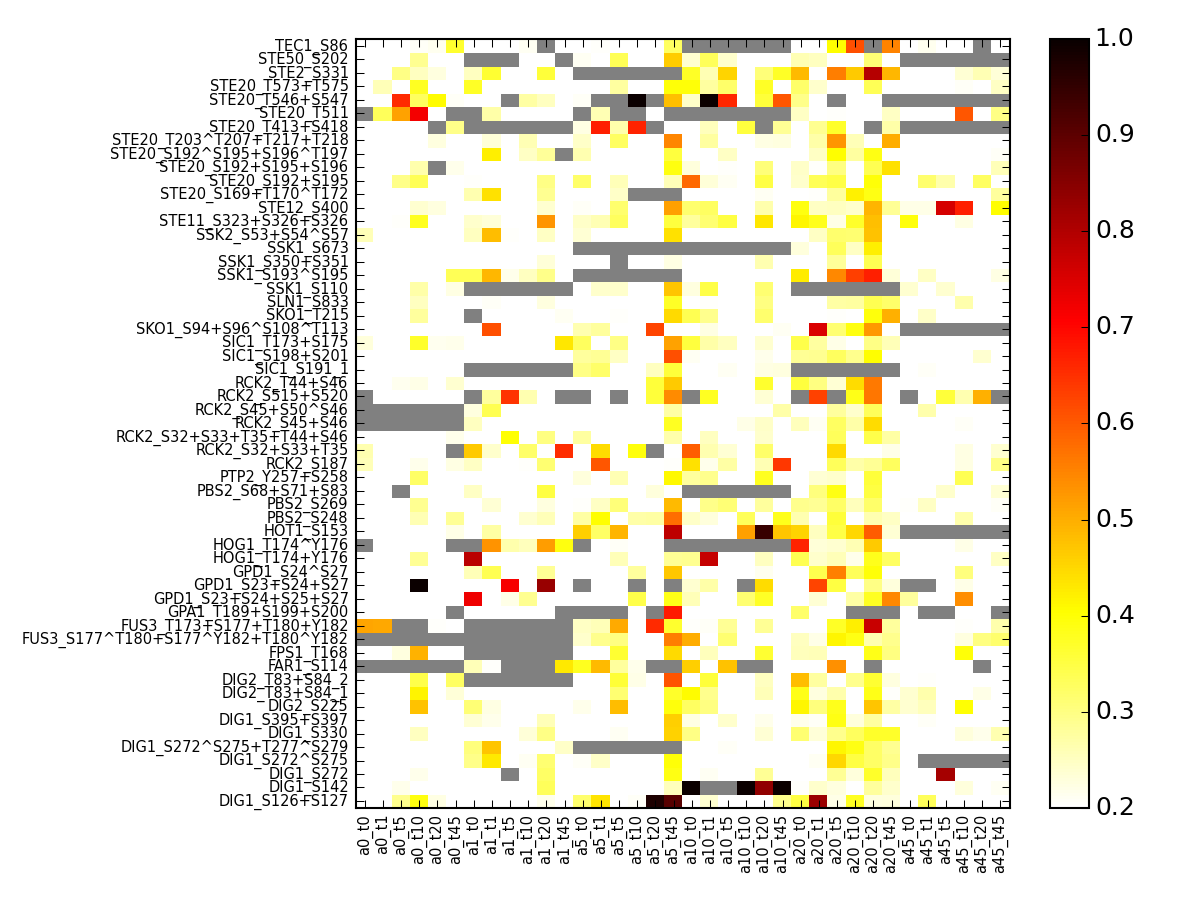
- pcolor_errors(vmax=None, cmap='hot_r', default_cv=nan, fontsize=8, vmin=0, salt=False)[source]
plot coefficient of variation for the small daa set using replicates found in the raw data set.
Parameters: salt – if set to True, re-arrange the columns based on salt rather than alpha Returns: errors in a dataframe from msdas import * y = YEAST2MIDAS(get_yeast_small_data(), get_yeast_raw_data()) y.cleanup_june() # replaces data with regenerated data including NAs errors = y.pcolor_errors(vmax=1,vmin=.2,fontsize=7)
(Source code, png, pdf)

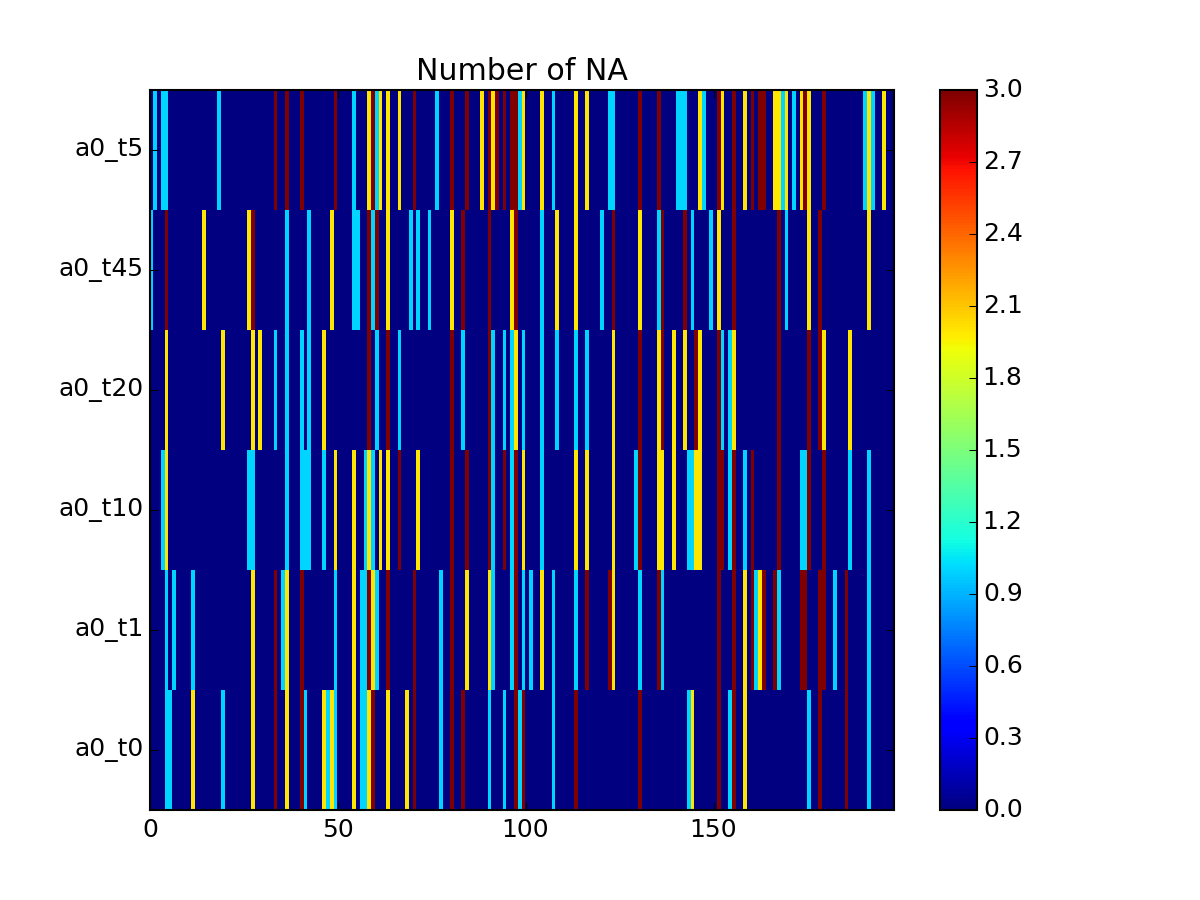
- pcolor_na(raw=False, fontsize=8)[source]
Plot number of NA for protein that are in the small data set
Final number of rows is therefore larger thatn in the small data set.
overlap between small and raw data is 32 rows. the remaining 25 are combination from the raw data set.
from msdas import *
import pylab
y  = YEAST2MIDAS(get_yeast_small_data(), get_yeast_raw_data())
y.cleanup_june()
errors = y.pcolor_na()
- plot_psites_mapping(preference=-30)[source]
For each protein, plot all data with the exemplar highlighted.
The clustering is made with msdas.clustering and its affinity propagation algorithm. In the yeast case, clustering is performed on euclidean distance.
from msdas import *
y = yeast.YEAST2MIDAS(get_yeast_small_data(), get_yeast_raw_data(), drop_non_midas=False
y.plot_psites_mapping()
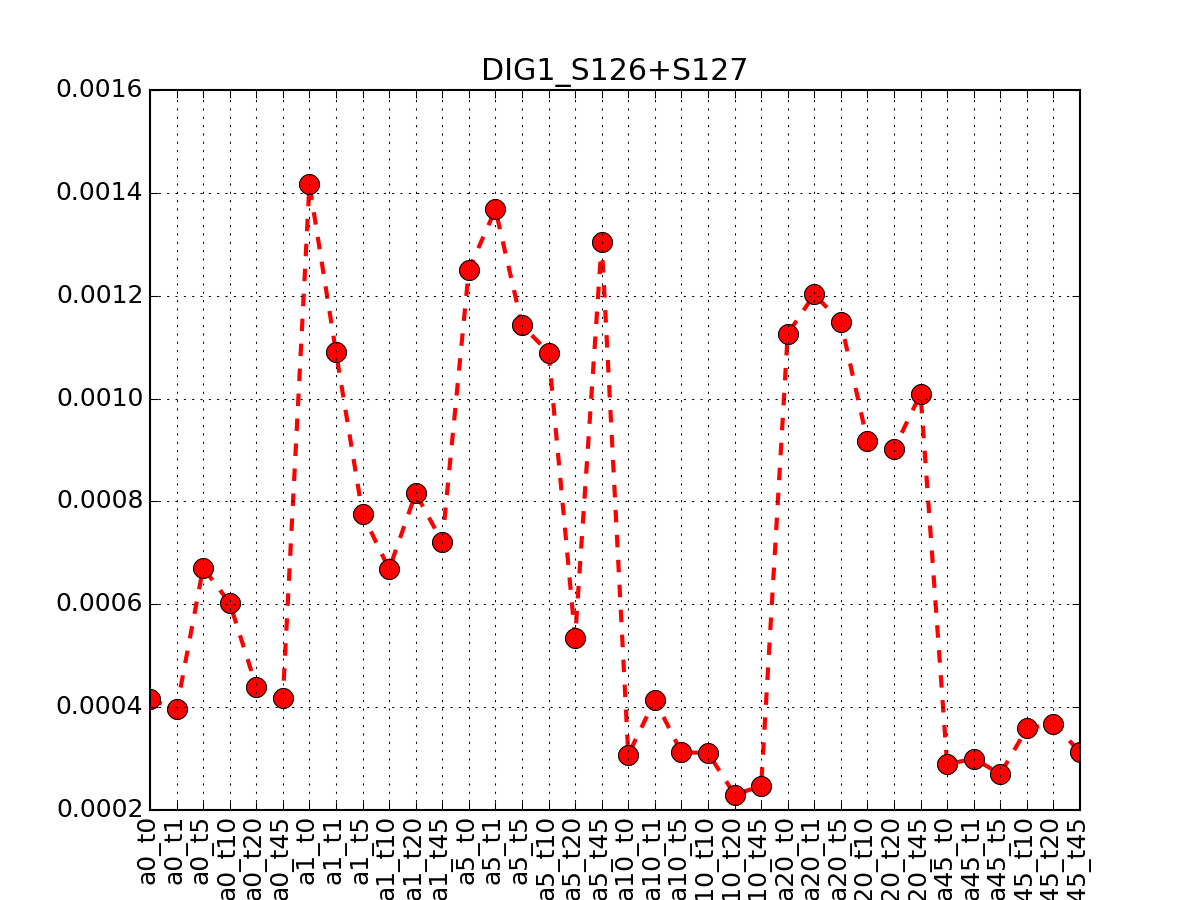
- plot_timeseries_midas(psite='DIG1_S126+S127', sigma=2, hold=False)[source]
Plot data related to a given identifier restricted to the MIDAS-compatible set
Data that can be used in the ODE package must be time-series. This correspond to salt=0, or NaCl=0 or salt==NaCl; IN the 6x6 matrix, this correspond to first row, first colum ad diagonal.
from msdas import *
y = YEAST2MIDAS(get_yeast_small_data(), get_yeast_raw_data())
y.plot_timeseries("DIG1_S126+S127")
(Source code, png, pdf)

Errors (2 sigmas) are also shown
- to_midas(filename, preference=-1)[source]
Given a dataframe, export measurements into MIDAS format
Parameters: - filename (str) –
- preference (int) – a negative parameter used in the clustering. See msdas.clustering.Affinity
Returns: the MIDAS object.
Internally, a new dataframe is created by selecting the examplars from the clustering (Default preference of -1 is in principle equivalen of not having any clustering). Then, the MIDAS file is created and saved into a file.
y = yeast.YEAST2MIDAS(get_yeast_small_data(), get_yeast_raw_data() )
m = y.to_midas(df, "MD-test.csv")

from cno import XMIDAS
m = XMIDAS("MD-test.csv")
- get_yeast_raw_data()[source]
Return filename to the YEAST raw data
See get_yeast_small_data() for procedure on how to generate this data file. The input filenames used are get_yeast_filenames()
- get_yeast_small_data()[source]
Return filename of data related to YEAST
This is the CSV file resulting from the alignment of 6 small data files provided in the package. Here is the procedure followed to create that file.
from msdas import *
m = MassSpecAlignmentYeast(get_yeast_small_files())
# data is now aligned, we can save it
# We also wanted the annotations:
a = AnnotationsYeast(m) # creates the identifiers
a.get_uniprot_entries() # Creates the entry
a.set_annotations()     # Creates Entry names
a.check_entries_versus_sequence()
# columns are rename with prefix "a"
a.to_csv("YEAST_small_all_test.csv")
1.4. PKN construction
Created on Fri Feb 7 16:58:10 2014
@author: chernand
- class PhosphoGRID(directory='../../share/data/')[source]
Build PKN from phosphogrid
You need first a list of protein names that you are interested in. This list can be obtained from the merger instance as follows:
from msdas import *
m = MassSpecReader(get_yeast_small_data, "yeast")
gene_names = set(list(m.df.Protein))
Then, you can use this class as follows to visualise and save into a SIF file the network built from phosphogrid database.
>>> from msdas import *
>>> r = MassSpecReader(get_yeast_small_data())
>>> gene_names = set(list(r.df.Protein))
>>> p = phosphogrid.PhosphoGRID()
>>> p.run(gene_names=gene_names)
>>> p.export2sif()
>>> p.plot()
(Source code, png, pdf)

2 databases are used. Their filenames are hard coded as:
- BIOGRID-PTM-RELATIONSHIPS-3.1.93.ptmrel.txt
- BIOGRID-PTM-15-3.1.93.ptmtab.txt
You can change the name by changing dbR_filename and dbP_filename.
constructor
Parameters: directory (str) – directory where to find the databases They can be found at Claudia’s Hernand home directory.
- export2sif(filename='matchYeastPhosGRID_protein.sif')[source]
Export the found relations into a SIF file
Parameters: filename (str) – Defaults to matchYeastPhosGRID_protein.sif
Created on Fri Feb 21 16:02:50 2014
@author: cokelaer
- class NetworkFromUniProt(annotations, verbose=True)[source]
Build a PKN based on the uniprot interact with annotations
The annotations dataframe can be obtained from the MassSpecMerger instance
from msdas import *
a = annotations.Annotations(get_yeast_small_data(), "YEAST")
a.get_uniprot_entries()
a.set_annotations()
Then, you can create this object:
n = network.NetworkFromUniProt(a.annotations)
And finally get a graph structure that extract all relations found in the annotations dataframe based on the uniprot field called “Interacts with”.
constructor
Parameters: annotations (df) – a dataframe similar to the annotations found in MassSpecReader() - get_cnograph_intact(label='entry_name')[source]
Return cnograph made of the protein names found in the interactions of the annotations.
from msdas import *
a = annotations.Annotations(get_yeast_small_data(), "YEAST")
a.get_uniprot_entries()
a.set_annotations()
n = network.NetworkFromUniProt(a.annotations)
c = n.get_cnograph_intact()
c.plotdot()
- class CombineNetworks(dict_network, stimuli=, []signals=, []cutnonc=True, remove_self_loops=True)[source]
Combine several PKN from different methods
THis class serves as an example on how to combine several PKNs into a common one. The input PKN used may come from:
#. In this example, you need to build a uniprot PKN using NetworkFromUniProt, a PKN using PhosphoGrid msdas.phospho.PhosphoGrid and a list of names to indicates nodes where you have measurements.
# Get list of names
from msdas import *
a = annotations.Annotations(get_yeast_small_data(), "YEAST")
a.get_uniprot_entries()
a.set_annotations()
n = network.NetworkFromUniProt(a.annotations)

names = list(set(a.df.Protein))

from easydev import get_share_file as gsf
n = network.CombineNetworks(
    {"Curated": gsf("msdas", "data", "PKN-yeast.sif"),
    "UniProt": "PKN-uniprot.sif",
    "PhosPho": "PKN-phospho.sif"},
    signals=names[:], stimuli=["a", "NaCl"])

c = n.get_digraph()

c.plot()
#c.export2sif("PKN-combined.sif")
Parameters: - dict_network (dict) – a dictionary of network. keys are used for labelling values must be a SIF filename
- stimuli (list) – list of stimuli
- signals (list) – list of signals
- cutnonc (bool) – remove useless nodes, not measured or without influence on signals
- remove_self_loops (bool) – remove self loop from the network.
- get_digraph(sources_priority=['Curated', 'PhosPho', 'UniProt'])[source]
Creates a directed graph from the input networks
- get_multiedge_graph()[source]
Creates a multiedge graph from the input networks
Returns: CNOGraphMultiEdges object
- plot_multiedge_graph(cmap='jet')[source]
Creates a multiedge graph and plots it
Parameters: cmap – a valid color map from matplotlib. jet, spring, hot, ... Returns: CNOGraphMultiEdges object # Get list of names from msdas import * from easydev import gsf m = MassSpecReader() m.read_annotations(gsf("msdas", "data", "YEAST_annotations_small.pkl")) n = network.NetworkFromUniProt(a.annotations) names = list(set(m.df.Protein)) n = network.CombineNetworks( {"Curated": gsf("msdas", "data", "PKN-yeastScaffold.sif"), "UniProt": "PKN-uniprot.sif", "PhosPho": "PKN-phospho.sif"}, signals=names[:], stimuli=["a", "NaCl"]) c = n.plot_multiedge_graph() c.plot()
1.5. Reading files with MassSpecReader (readers module)
Mass Spectrometry Readers (raw data)
- class MassSpecReader(data=None, mode='default', verbose=True, quotechar="'", merge_peptides=False, index_col=None, sep=', ', cleanup=True)[source]
Read a simple Mass Spec data CSV file
First, the MassSpecReader reads a CSV file and stores it in the df attribute as a dataframe. At this stage, there is no manipulation except from the fact that columns found in the header are cleanup (e.g., spaces are removed).
Second, the header is interpreted. The User Guide provides a draft convention of how the header should look like. It should contains the following columns:
- Protein: a valid uniprot protein name (e.g., DIG1)
- Sequence: a peptide sequence without annotations. If not provided, Sequence_Phospho must be provided
- Sequence_Phospho: a sequence with the phsphorylation position tagged as “(Phospho)” e.g., AVS(Phospho)KK means there was a Phophorylation on S at position 3 and possibly oxidation as (Oxidation)
- Psite: The absolute position of the phosphorylations. For instance S132^S140
and possibly:
- Entry_name: a valid uniprot entry name (e.g., DIG1_YEAST)
- Entry: a valid uniprot entry (e.g., P23321)
- Identifier: concatenation of Protein and Psite. Maybe overwritten if _rebuild_identifier() is called
If you have another name (e.g., PeptideSequence instead of Sequence_Phospho), you can populate the header_mapping attribute.
If “Accession” and “Modifications” are found in the header, the accession column will be expected to contain these kind of strings (FASTA header):
sp|Q8IYB3-2|SRRM1_HUMAN
from which the Protein column can be extract. Besides, the Modifications will contain information that could be used to extract the Psite positions. Modifications entries look like:
[5] S+7777| [1] T+5555
Once the data is intrepreted. Protein, Sequence and Psite should be available.
Finally, a third step performed by this class is to performs some cleanup. See cleanup() for details.
Warning
Psites are separated by the ^ character (AND). If there is an ambiguity, the + sign can be used as a logical OR.
The creation of a MassSpecReader is quite versatile. You can read a CSV file as described above, or provide an instance of MassSpecReader, or an object that contains an attribute df, which is compatible.
# Let us create a dummy dataframe
import pandas as pd
df = pd.DataFrame({
    'Psite': ['S1+S2', 'T3'],
    'Sequence_Phospho': ["S(Phospho)S(Phospho)TTT", "SST(Phospho)TT"],
    'Protein': ['DIG1', 'DIG2'],
    'X1':[1,2],
    'X2':[5,2],
    'X3':[4,5],
    'dummy'[1,2]
}

from msdas import *
r = readers.MassSpecReader(df)
There are some sanity checks performed. In the example above, the case Psite, S1+S2 is acutally ambiguous: it means that there a psite on S1 OR S2 (i.e., there is one psite). Yet the sequence contains 2 phophoosites. So, there is a typo. If you check the content of r.df you would see only 1 row. Let us fix it
>>> df['Psite'] = ['S1^S2', 'T3']
>>> r = readers.MassSpecReader(df)
>>> len(r.df)
2
See also
the User Guide and notebooks provided in the MSDAS documentation
constructor
Parameters: - data (str) – Can be (i) None, (ii) a valid filename with the appropiate format (CSV), (iii) an instance of MassSpecReader itself, (iv) a dataframe with the correct column names (v) any object that contains an attribute df that is a dataframe with the correct column names.
- verbose (bool) – Set to True/False or valid string (DEBUG,INFO,WARNING,ERROR)
- quotechar – Ignore the quotechar argument if found in the CSV file. Defaults to ‘ character. For Tcell data, set to ” since the CSV file contains ” characters.
- merge_peptides (bool) – calls merge_peptides() is True (default to False)
- index_col (int) – may be required to read some CSV files
- sep (str) – the seprator to be used when reading the CSV file
- cleanup – calls cleanup() method (default to True)
- AND = '^'
symbol used to encode psites (AND case)
- N
Return number of measurements.
- OR = '+'
symbol used to encode psites (OR case)
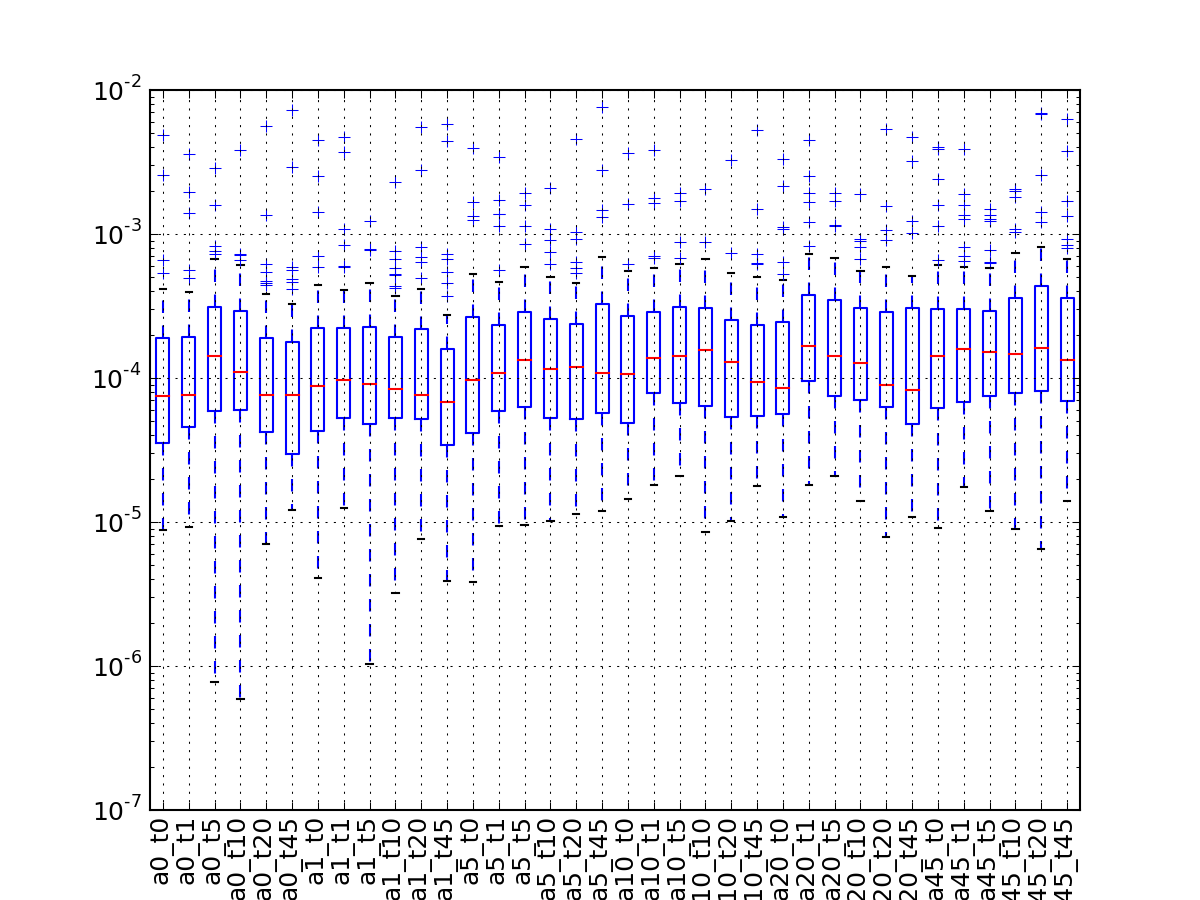
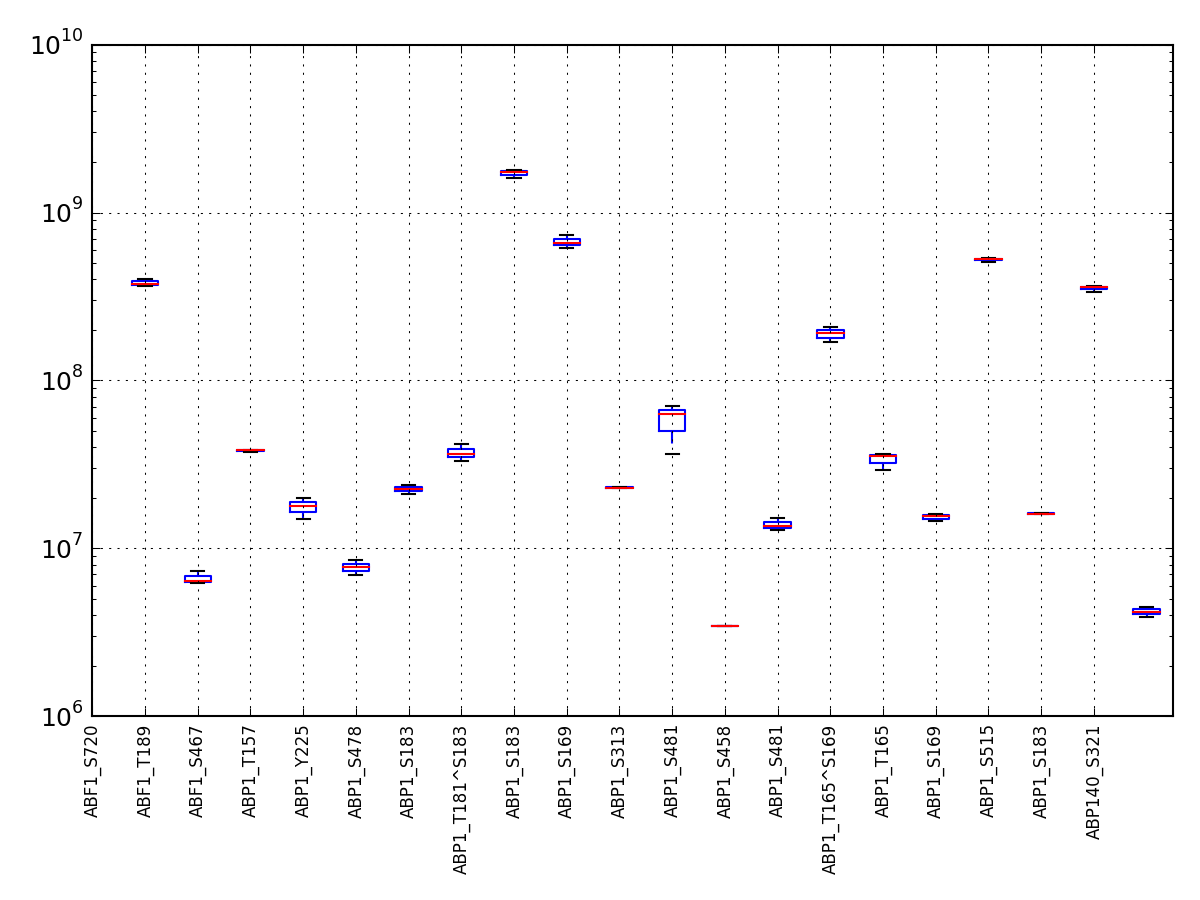
- boxplot(index=None, logy=True)[source]
A simple boxplot of the data using logy
Parameters: - index – you can rearrange the ordering of the axis column or select a subset by providing a list of indices.
- logy – set y-axis with log scale
(Source code, png, pdf)
- cleanup()[source]
Call functions that clean up the dataframe
Here are the steps followed:
- set zeros to NA msdas.readers.Cleaner.set_zero_to_na()
- Rename psites using MSDAS convention (see rename_psites()). Here just get rid of spaces
- calls remove_ambiguities()
- calls merge_peptides() if _merge_peptides is True
- rebuild the identifier based on Protein and Psite columns.
- df
getter/setter for the main dataframe
- header_mapping = {'Protein': ['Standard name', 'ProteinName'], 'Psite': ['Phosphosites'], 'Sequence_Phospho': ['Peptide sequence', 'PeptideSequence']}
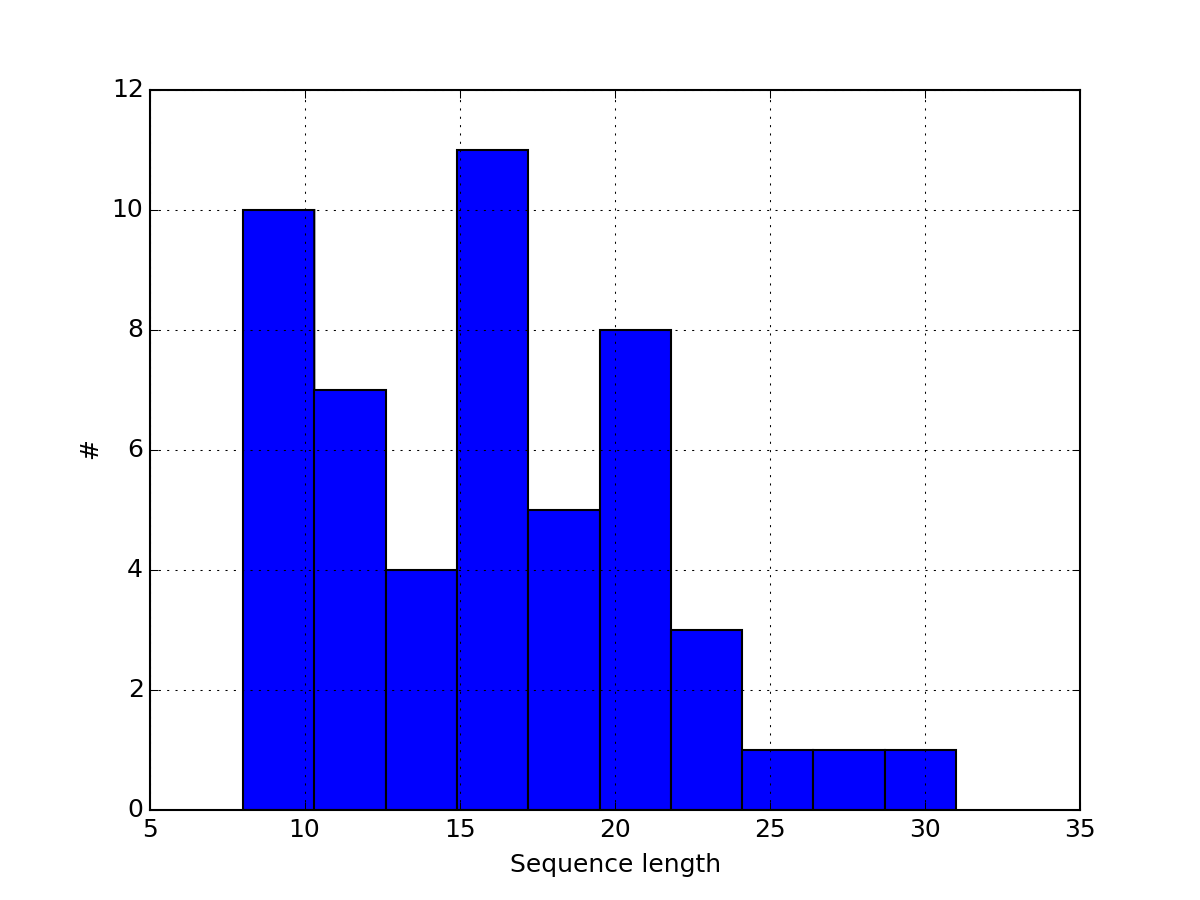
- hist_peptide_sequence_length(drop_duplicates=True, **kargs)[source]
Plot histogram of the peptide sequences length.
Parameters: - drop_duplicates (bool) – duplicated peptide sequence are dropped by default Indeed, you may have two identical peptides with different psites. Since we are interested in the peptide sequence, we drop duplicated ones.
- kargs – optional keywords are passed to the dataframe.hist method.
(Source code, png, pdf)
- merge_peptides()[source]
Merge data using Cleaner class
- Merge peptide with same psites. See merge_peptide_with_same_psites()
- Merge identical peptide sequences. See merge_identical_peptide_sequence()
Note that in the yeast case, we use only the merge_identical_peptide_sequence
- metadata
read-only attribute. Returns subset of the df attribute, which contains metadata (not measurements). The subset is selected based on the _metadata_names attribute, which by default contains Sequence, Protein, Identifier, Entry, Entry_name,... look at _metadata_names for up-to-date list of column names
- mode
mode of the Merger (e.g., yeast)
- pcolor(protein=None, tag='t', fillna=None, vmax=None, vmin=None, cmap='hot_r', fontsize_yticks=8)[source]
Parameters: - protein (str) – a protein name. If not provided, plot all the data.
- tag (str) – only column that starts with this tag are used
- fillna – if na are found, there are plot as grey pixels. You can set all NAs to a scalar if required.
- vmin (float) – vmin parameters used by the matplotlib.pcolor function
- vmax (float) – vmax parameters used by the matplotlib.pcolor function
- cmap – a valid color map from matplotlib
(Source code, png, pdf)

- plot_experiments(identifier, cmap='hot_r', vmin=None, vmax=None)[source]
should be for yeast only. Put inside a YEAST class ?
if not merged, you could end up with several rows. may fail in such case...
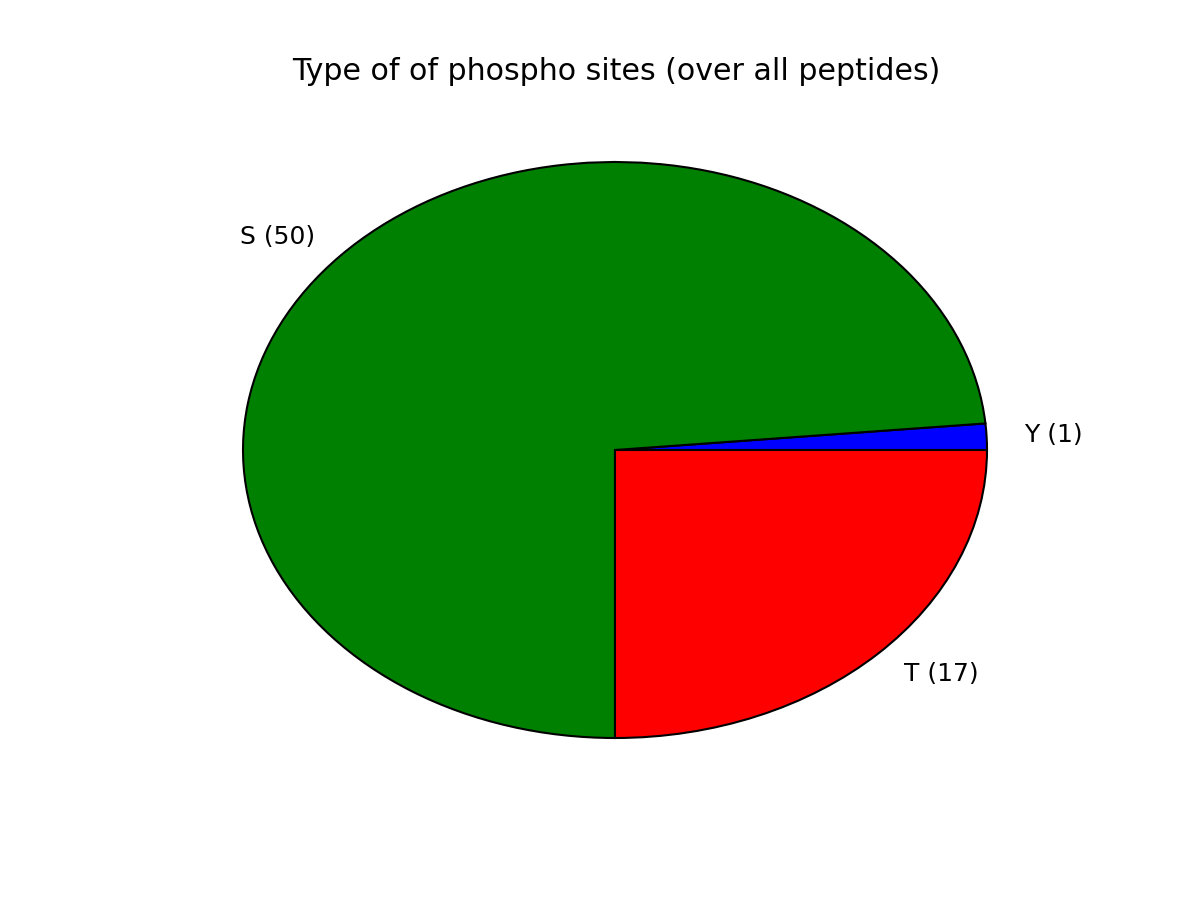
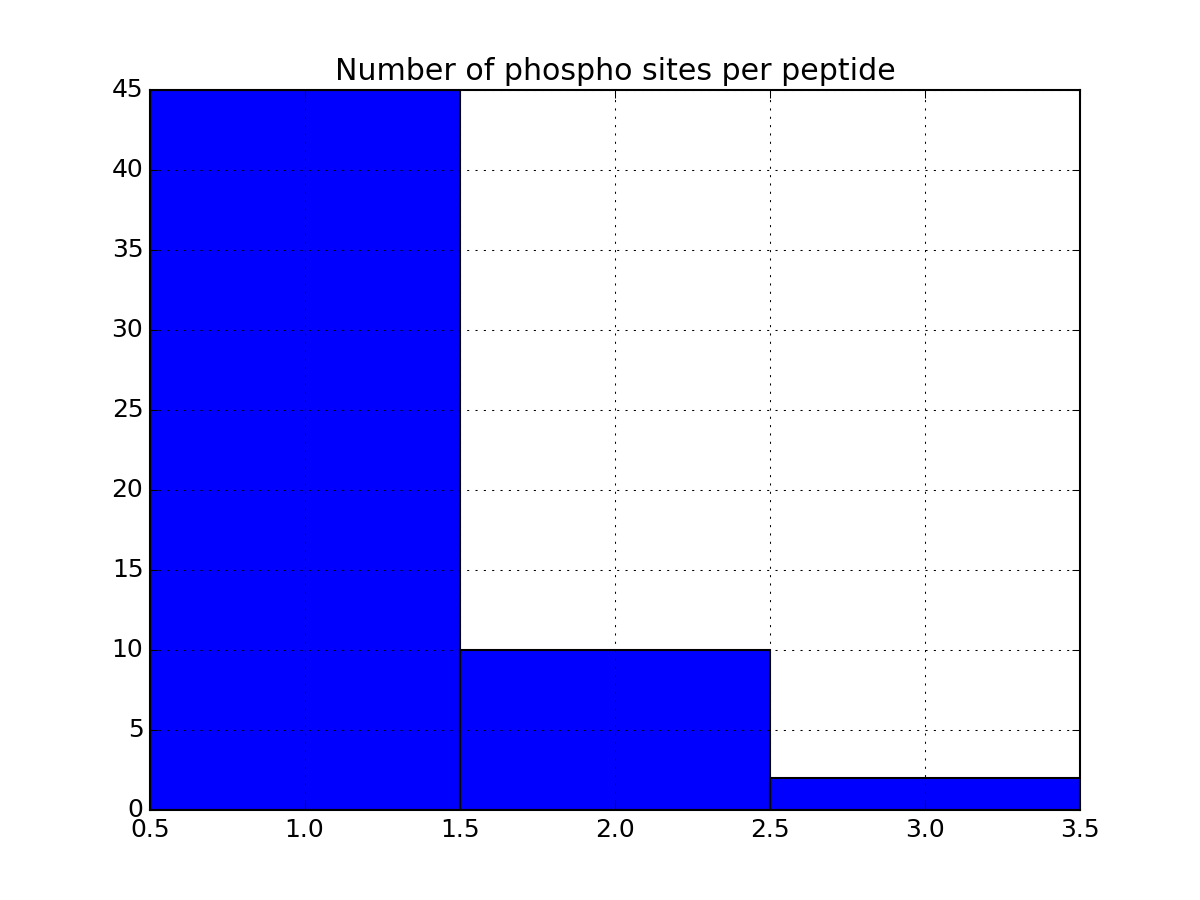
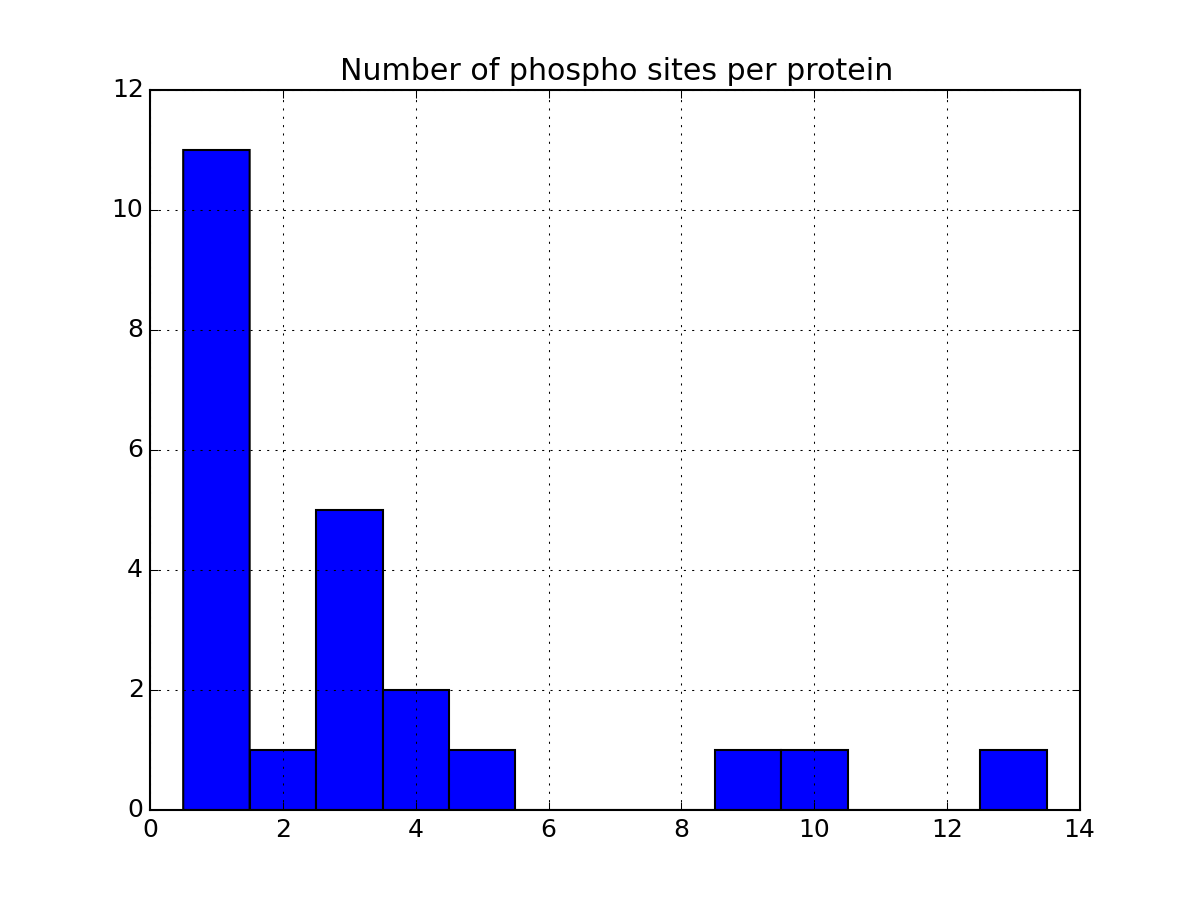
- plot_phospho_stats(**kargs)[source]
Plots descriptive statistics about the Psites
The data used comes from the DataFrame.
There are 3 plots created:
- pie charts of number of sites of each category (e.g., S, T, ..)
- Histogram of number of phospho sites per protein
- Histogram of number of phospho sites per peptides
from msdas import *
filenames = get_yeast_filenames()
p1 = readers.MassSpecReader(filenames[0], mode="YEAST")
p1.plot_phospho_stats()
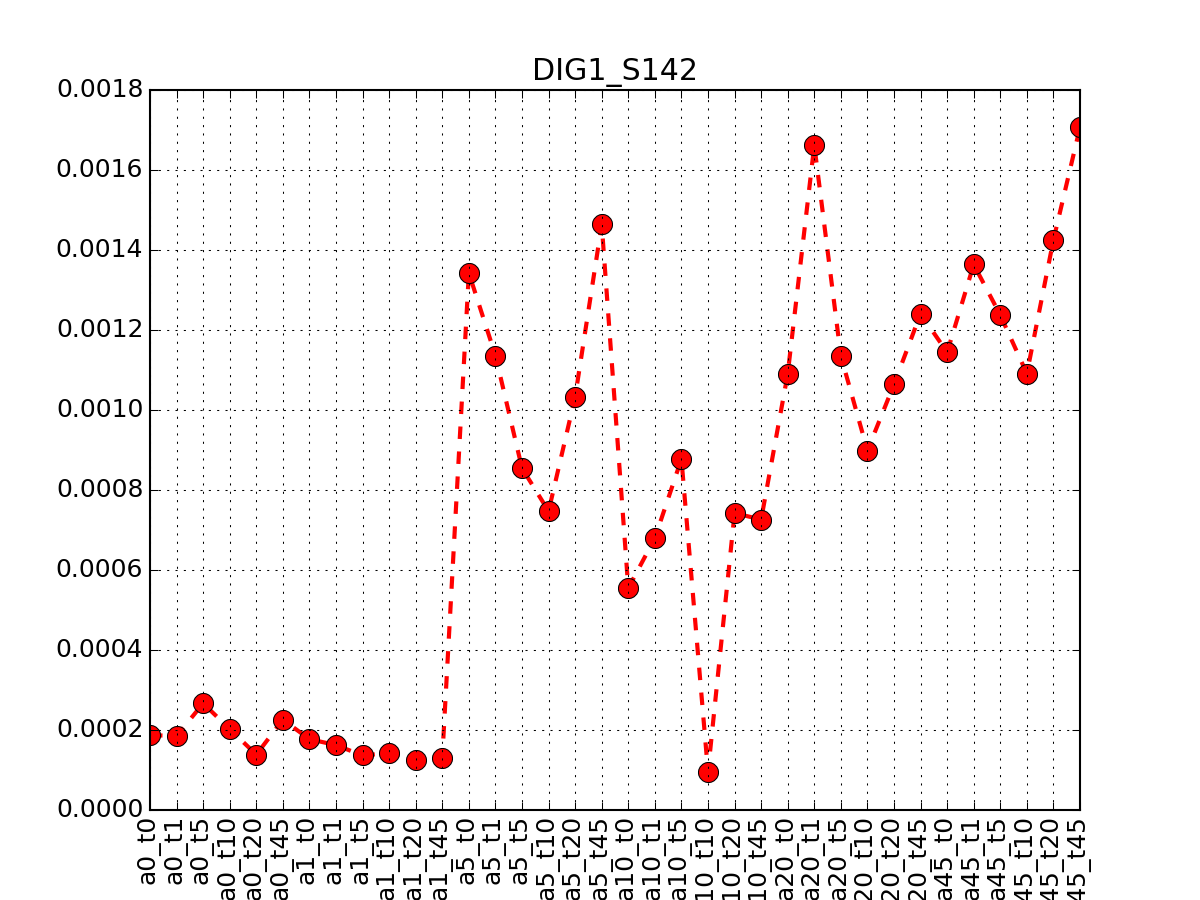
- plot_timeseries(identifier, replicate=None, **kargs)[source]
This is for the yeast case with replicates
Parameters: - identifier (str) –
- replicates – None means use the first replicate (the one without prefix). otherwise, provide the suffix corresponding to the replicate (see example below)
- kargs – any paraemter accepted by the matplotlib.plot function
from msdas import *
m = readers.MassSpecReader(get_yeast_small_data(), verbose=False)
m.plot_timeseries("DIG1_S142")
(Source code, png, pdf)
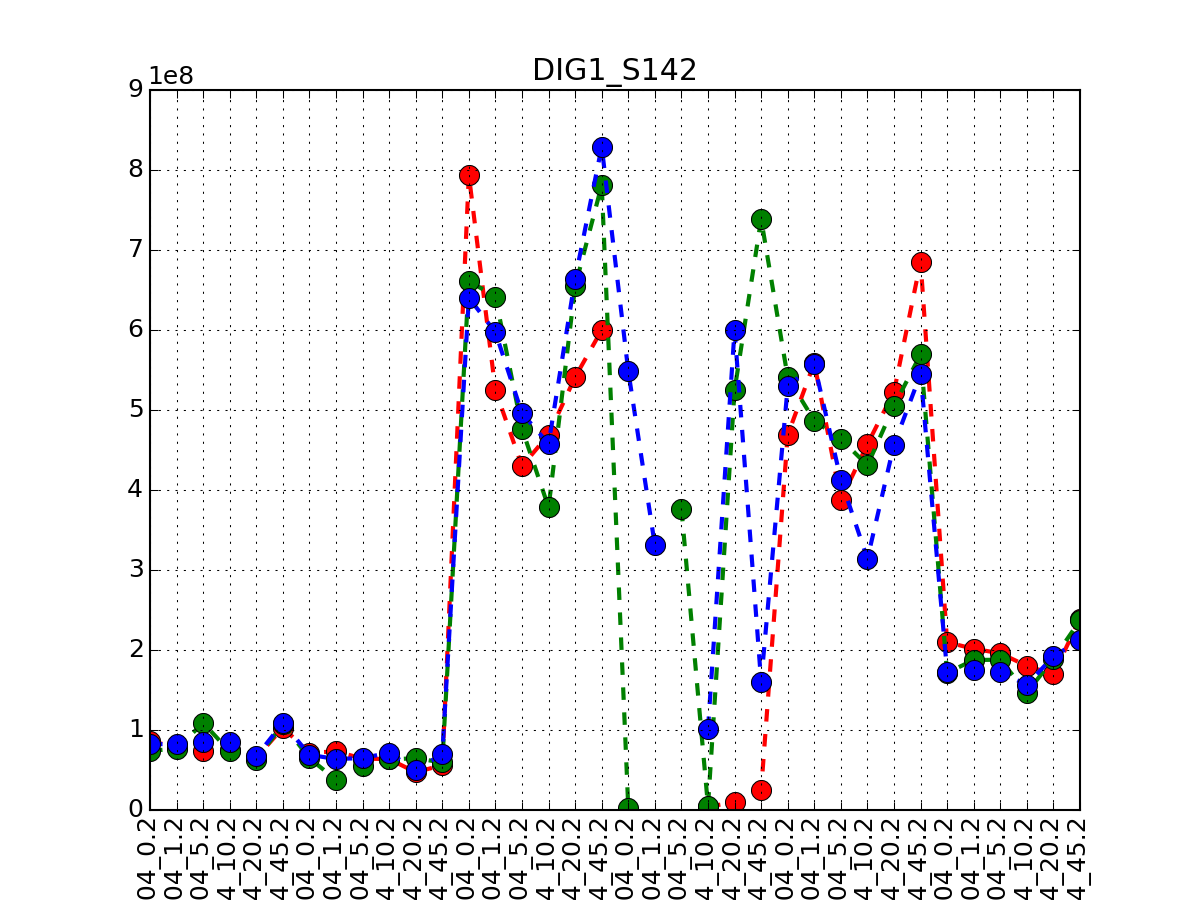
If you have replicates, only the first replicate is taken into account and you therefore need to call plot_timeseries several time providing the tag of the replicate. The first replicate has no tag. The second replicate has a suffix (.1), the third replicates has the tag .2 and so on
from msdas import *
M = readers.MassSpecReader(get_yeast_raw_data(), verbose=False)
M.plot_timeseries("DIG1_S142", replicate=None, color="r")
M.plot_timeseries("DIG1_S142", replicate=1, color="g")
M.plot_timeseries("DIG1_S142", replicate=2, color="b")
(Source code, png, pdf)
- psites
returns list of Psites found in the DataFrame
- read_annotations(filename)[source]
Read annotations saved in a dataframe.
Parameters: filename (str) – filename where annotations are saved (pickle file) See msdas.annotations.Annotations
This function is required to populate the annotatoins attribute used for example by show_sequence()
- read_csv(filename=None, quotechar=None, index_col=None, sep=None)[source]
Read a CSV file file Mass Spec data
Parameters: filename (str) – if not provided, uses the class attribute filename This function is used by the constructor of MassSpecReader if a filename is provided. Yet, you can either create an empty instance and read the file later on. If you read the file later, the difference with the constructor is that by default the cleanup() function is called. So these two codes are equivalent only if you call cleanup():
from msdas import *
m1 = MassSpecReader(get_yeast_small_data())
from msdas import *
m2 = MassSpecReader()
m2.read_csv(get_yeast_small_data())
m2.cleanup()
You can then check that the 2 files are equivalent:
>>> m1 == m2
True
- remove_ambiguities()[source]
- Remove rows where psites are ambiguous or could not be interpreted. See remove_ambiguous_psites()
- Remove rows where number of proteins is > 2 remove_ambiguous_proteins()
- remove_ambiguous_proteins()[source]
Remove rows where proteins are not uniquely defined
Some rows may have the protein field incorrectly defined with several protein names, in which case the row is discarded by this function
- remove_ambiguous_psites()[source]
Removes Psites where number of Psite does not match content of Sequence
Some sequences are different number of phospho as compared to the Psites columns. In such case, we remove the rows. The field used for the sequence is the Sequence_Phospho where psites are encoded with the (Phsospho) string
ALY1, S118^S216, TPLPSSS(Phospho)R
Note
Oxidation are ignored
- rename_psites()[source]
Rename Psites using AND/OR convention.
To store the Psite column in the header, we use the following conventions:
- individual psite are separated by AND using the ^ character
- ambiguous psite when position is not certain are separated by OR that is + character
See msdas.psites.PSites class documentation for details.
Here, the CSV file may contain Psites stored with spaces, which are considered as ANDs. So, we first remove spaces, replace them by ANDs. There are also extra ; characters that are ignored. If there are duplicated psites, which occurs in the raw data set (yeast case), we remove them. Finally, in the yeast case, some sequence contain the (Oxidation) string but the corresponding Psite is not provided. This function extract this information and stores it in the Psite string.
Psites are also sorted by position e.g., S5^S3 is renamed as S3^S5.
- sequences
returns list of Sequences found in the DataFrame
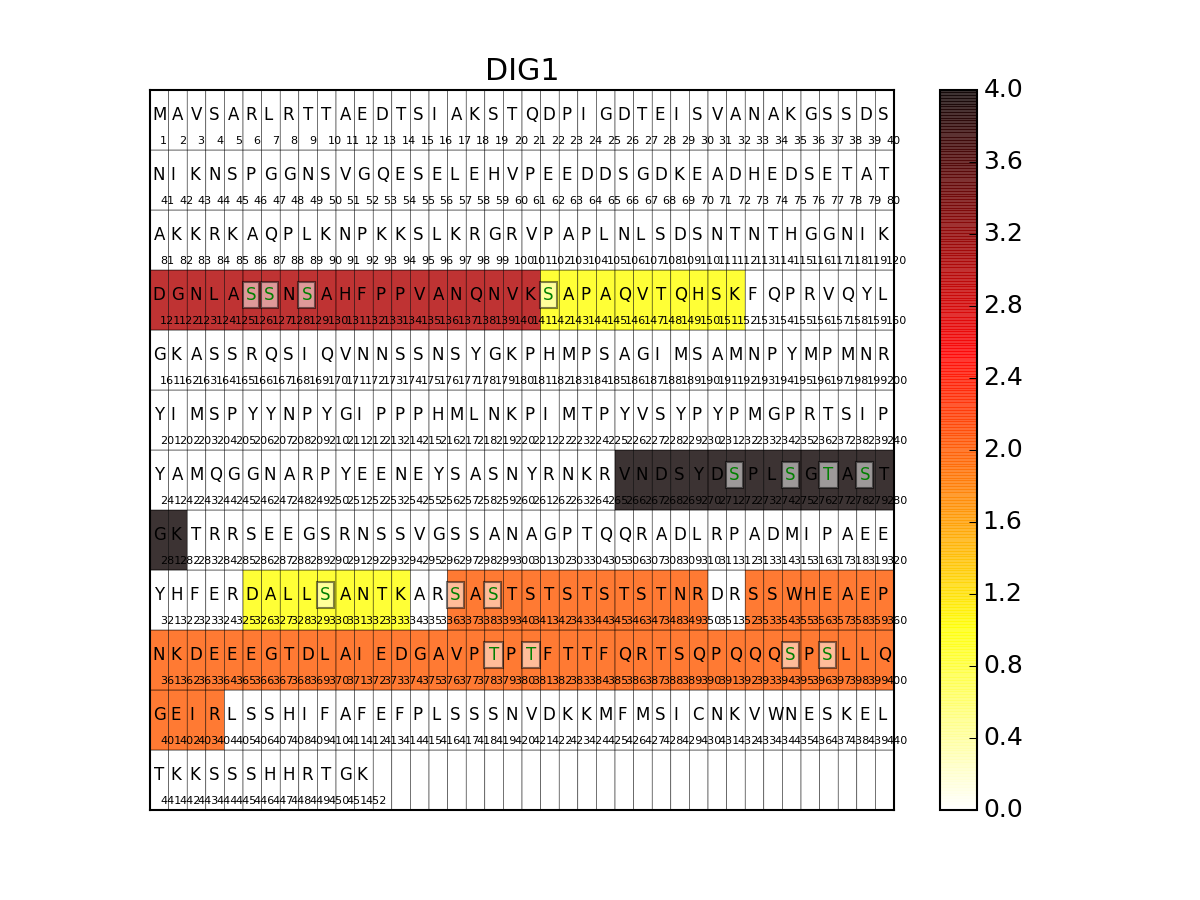
- show_sequence(protein, N=40, vmax=None, cmap='hot_r', fontsize=10)[source]
Show peptide and phosphorylation distribution on a sequence
import os
from msdas import *
r = readers.MassSpecReader(get_yeast_raw_data())
if os.path.exists("YEAST_annotations.pkl")==False:
    a = annotations.Annotations(r, "YEAST")
    a.get_uniprot_entries()
    a.set_annotations()
    a.to_pickle()
r.read_annotations("YEAST_annotations.pkl")
r.show_sequence("DIG1",fontsize=8)
(Source code, png, pdf)

Warning
once merged, some phospho are tagged ith merged name so we use the colum Sequence (not Sequence_Phospho)
- sort_psites_ors_only()[source]
Sort the psites location in psites string that contains OR, only
e.g., S3+S1 is renamed as S1+S3 but S3+S1^S7 is unchanged.
- valid_header = ['Identifier', 'Protein', 'Sequence', 'Sequence_Phospho', 'Psite', 'Entry', 'Entry_name']

- class Cleaner[source]
Tools inherited by msdas.readers.MassSpecReader to perform some tasks on grouping the peptides. Allows also some manipulation on the NAs.
Note
In principle you do not need to use this class, which is available via msdas.readers.MassSpecReader. However, it can be useful as a standalone class.
Requires the dataframe stored in df to be populated with a dataframe similar to those used in msdas.readers.MassSpecReader.
handling NA
Here, we create a simple dataframe with two columns. The last row contains 1 NA and 1 zero.:
from msdas import Cleaner
import pandas as pd

c = Cleaner()
c.df = pd.DataFrame({'A':[1,2,3,np.nan], 'B':[4,5,6,0]})
In Mass Spectrometry, zeros have no meaning. There is always some measurements of abundance being made. Zeros are sometimes used to represent a NA. The Cleaner class has a method set_zero_to_na() to replace all zeros by NAs:
>>> c.set_zero_to_na()
>>> c.df
    A   B
0   1   4
1   2   5
2   3   6
3 NaN NaN
Rows that contains all NAs are useless and one may want to remove them:
c.drop_na_count(2)
This statement removes all rows that contain 2 NAs. You can get the count of all NAs through the entire dataframe with the method get_na_count().
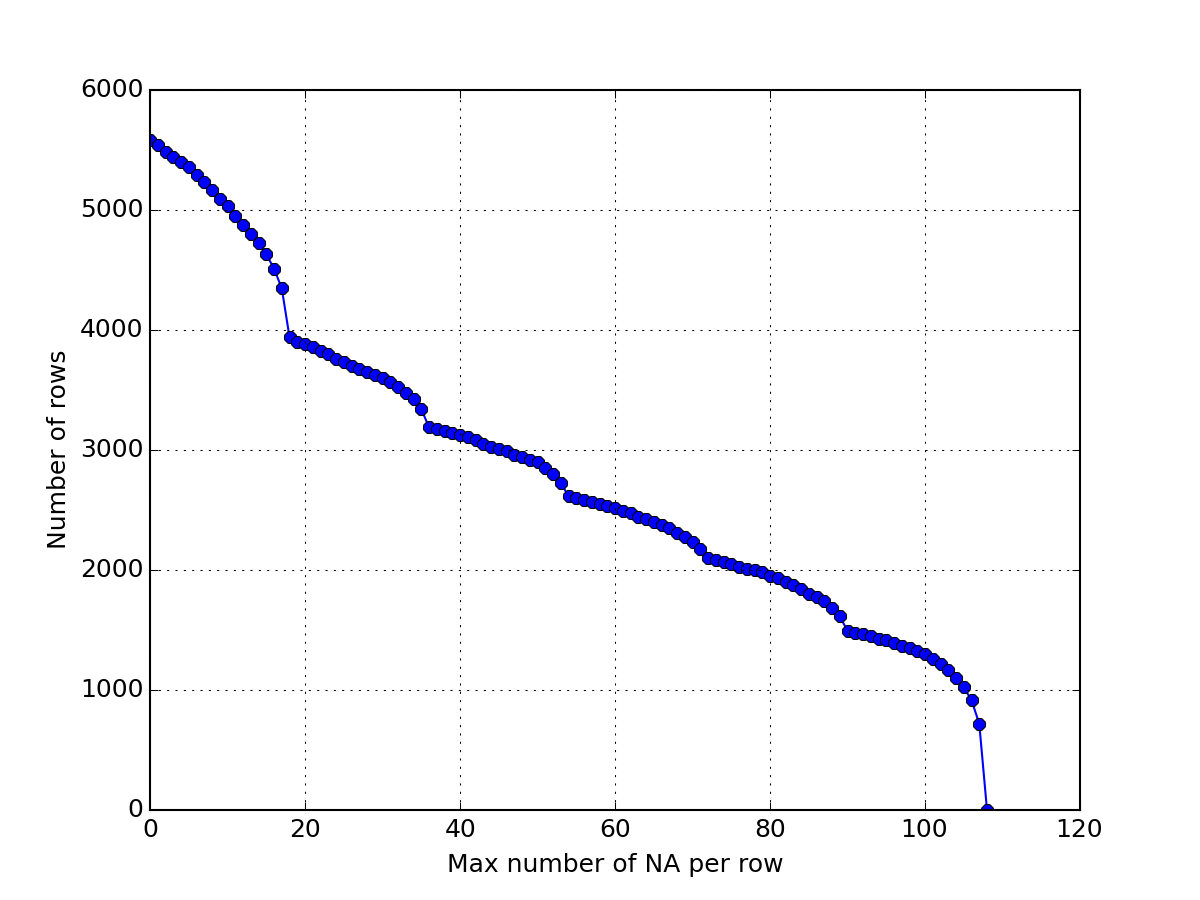
- drop_na_count(N=100000, inplace=True)[source]
removes rows with at least N NA values
A row may have replicates. In the YEAST data case, we have 3 replicates and 36 experiments; setting N=54 means removes all rows for which half of the measurements are NAs.
Here below, we use msdas.replicates.ReplicatesYeast, which inherit from MassSpecReader and therefore from Cleaner. Consequently, we can simplify the data by calling drop_oxidation() and merge_identical_peptides_sequence(). Then, we drop rows that have 108 NAs and plot the number of remaining rows. Then, we drop rows that have 2 NAs and so on until there is no more data. The plot shows the size of the dataframe as a function of the maximal number of NAs that is acceptable.
>>> import pylab
>>> from msdas import ReplicatesYeast, get_yeast_raw_data
>>> r = ReplicatesYeast(get_yeast_raw_data())
>>> r.drop_oxidation()
>>> r.merge_identical_peptide_sequence()
>>> size = []
>>> for n in range(108,-1,-1):
...     r.drop_na_count(n)
...     size.append(r.df.shape[0])
>>> pylab.plot(size, 'o-')
>>> pylab.grid()
>>> pylab.xlabel("Max number of NA per row")
>>> pylab.ylabel("Number of rows")
(Source code, png, pdf)

- drop_oxidation()[source]
Drop rows where the Sequence_Phospho contains the Oxidation string
That the the merge_identical_peptide_sequence() renames some sequences and add the “MERGED” prefix. Those rows are not to be removed since they contains measurements that correspond to a peptide with an oxidation but also possible another peptide without oxidation. There is no way currently to know that. So the MERGED peptide are ignored. Ideally, drop_oxidation() should be called before any merging.
- fix_duplicated_identifier()[source]
Make sure identifierse are unique
Some identifiers may be duplicates (same protein, same psites but different peptides) e.g.,
Protein                Sequence    Psite     Identifier
   DIG2  LSQKEEDHSGKPPTITTSPAEK  T83+S84   DIG2_T83+S84
   DIG2      EEDHSGKPPTITTSPAEK  T83+S84   DIG2_T83+S84
In this case, we append an additional id, which is an integer starting from 1. First row found has the id 1.:
Protein                Sequence    Psite     Identifier
   DIG2  LSQKEEDHSGKPPTITTSPAEK  T83+S84   DIG2_T83+S84_1
   DIG2      EEDHSGKPPTITTSPAEK  T83+S84   DIG2_T83+S84_2
- merge_identical_peptide_sequence()[source]
Merge (by adding) rows that have same protein and peptide sequence
They may have different psite locations but their number must agree. A new name for the psite has to be created to reflect what addition was performed. Instead of concatenating the psites, we factorise if possible. For instance, consider the simple case with no common location but a single location:
DVSQIT(Phospho)SSPK        T44
DVSQITSS(Phospho)PK        S46
This is a simple OR case and the new name is T44+S46. Let us now consider a case with 2 psites, one being common:
TRS(Phospho)S(Phospho)GTNNKDVSQITSSPK    S32^S33
TRSS(Phospho)GT(Phospho)NNKDVSQITSSPK    S33^T35
S33 is common to two sequence, so the new psite name is
S32+T35^S33
and so on.
See also
- merge_peptides_with_same_psites()[source]
Merge rows that are different peptides but same psites
in other words same psites are presumably peptides including in each other.
Rows may have same protein and psite but different peptides. This may happen when an enzyme cuts the peptide at different places. Consider for instance this case:
KVASMNSASLQDEAEPYDS(Phospho)DEAISK,S49,TOP1,
 VASMNSASLQDEAEPYDS(Phospho)DEAISK,S49,TOP1
In such cases, we add the data measurements and replace the 2 rows by a single one. The Peptide stored is the first one (arbitrary choice).
Actually, you may also have the Oxidation present, which may be 2 different rows but there are added as expected:
DS(Phospho)SLLFSPAAVAM(Oxidation)R       S515
DS(Phospho)SLLFSPAAVAMR       S515
In this case, the 2 rows are added.
Identifier are unchanged
Note
if two peptides are identical, there are also taken into account here and being added.
See also
1.6. Handling replicates with MassSpecReplicates (replicates modules)
- class ReplicatesYeast(data, verbose=False, cleanup=True)[source]
This class is a specialisation of Replicates dedicated to the YEAST data
The data set comprises 36 experiment that are combination of alpha hormone at different times (0,1,5,10,20,45)
constructor
Parameters: - data – a valid input to msdas.readesr.MassSpecReader
- cleanup – see msdas.readesr.MassSpecReader for details.
- clean_na_paper(inplace=True, N=2)[source]
To be used with YEAST data only
Parameters: N – max number of NAs per experiment The YEAST data set is made of 6 experiments of 6 data points times 3 replicates. We first average the data over replicates so we have 6 experiments of 6 data points. In each experiments, if there have less than 6 - N values, then that experiment is reset: all data (including replicates) are set to NAs.
- clean_na_paper2(inplace=True, N=2, M=2)[source]
To be used with YEAST data only
Identify rows with at least 2 experiments (M=2) with more than 6-N values and crosses the 6 x replicates measurements in the experiment.
- drop_na_exceeds_minnonzero(min_non_zero=4)[source]
drop rows where Number of number of non-null values is below 4
Note
Not used anymore. Maybe dropped.
- get_na_per_experiment_after_averaging()[source]
average data and figure out number of NA per alpha experiment
- get_na_per_salt_experiment_after_averaging()[source]
average data and figure out number of NA per alpha experiment
- times = [0, 1, 5, 10, 20, 45]
times
input tags to be found
- class Replicates(data, verbose=False, cleanup=True)[source]
Investigate the replicates in the raw dat sets
The purpose of this class is to analyse a full data set with replicates, to remove rows that are meaningless, to compute mean/sigma on replicates and identify rows that have large errors.
Replicates are identified as follows. If the input is a CSV file, columns with the same name are considered replicates to each other. Internally, in the dataframe, an index is appended. The first replicate does not have an index appended though. For instance, 3 columns called X1 will be renamed internally as:
X1
X1.1
X1.2
If you save the dataframe into a CSV file, these convention is kept and names will be kept as it is.
from msdas import *
r = ReplicatesYeast(get_yeast_raw_data(), verbose=True)
Since Replicates inherits from msdas.readers.MassSpecReader, some functionalities can be re-used such as plotting, selection of data, annotations...
Here are some notations used in the documentation.
 represent a row that corresponds to a combination
of protein name and psites.
represent a row that corresponds to a combination
of protein name and psites.- There are possibly more than 1 experiment, which number is
 and indexed
thanks to the
and indexed
thanks to the  letter.
 - There are
 replicates for each measurement. A replicate is
indexed with
replicates for each measurement. A replicate is
indexed with  .
.
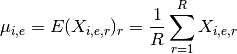
Using the notations above, one datum in the dataframe can be denoted as
 . We denote
  the mean and
  the
standard deviation.
the
standard deviation. is the mean over replicates and is a
NxE matrix.
is the mean over replicates and is a
NxE matrix.- If you then want to average the resulting mean over experiment (to get the
grand mean), we denote it as
 . This
is equivalent to
. This
is equivalent to  .
.
Note however, that for standard deviation, the distinction and order of the indices matters.
 is a N-length vector of standard
deviations for each combi of protein and psite.
is a N-length vector of standard
deviations for each combi of protein and psite. is a NxE matrix of standard deviations.
There are quite a few methods to extract these information either as full dataframe or set of dataframe inside a dictionary. For instance, get_mus() returns the mean over each
constructor
Parameters: - data – a valid input to msdas.readers.MassSpecReader
- cleanup – see msdas.readers.MassSpecReader for details.
- boxplot_replicates_by_experiment(tag, indices=None, fontsize=8)[source]
BoxPlot of the replicates for a given experiment
Parameters: - tag (str) – a valid measurement name to look for replicates.
- indices – list of indices to look at. If data set is large, you will want to use this parameter. Note that indices is not a range i,e., range(0,20) may not work because index 10 is not present.
- fontsize – fontsize used for the x-axis
from msdas import *
r = replicates.ReplicatesYeast(get_yeast_raw_data())
r.boxplot_replicates_by_experiment("a0_t0", indices=r.df.index[0:20])
(Source code, png, pdf)

- get_average_mu()[source]
Return grand mean
Returns: a vector with the grand mean over protein/psites The grand mean is the mean of the mean over replicates and experiments that is:
This is equivalent to taking the mean over the experiment of the output of get_mu_df()
Warning
may contain NAs
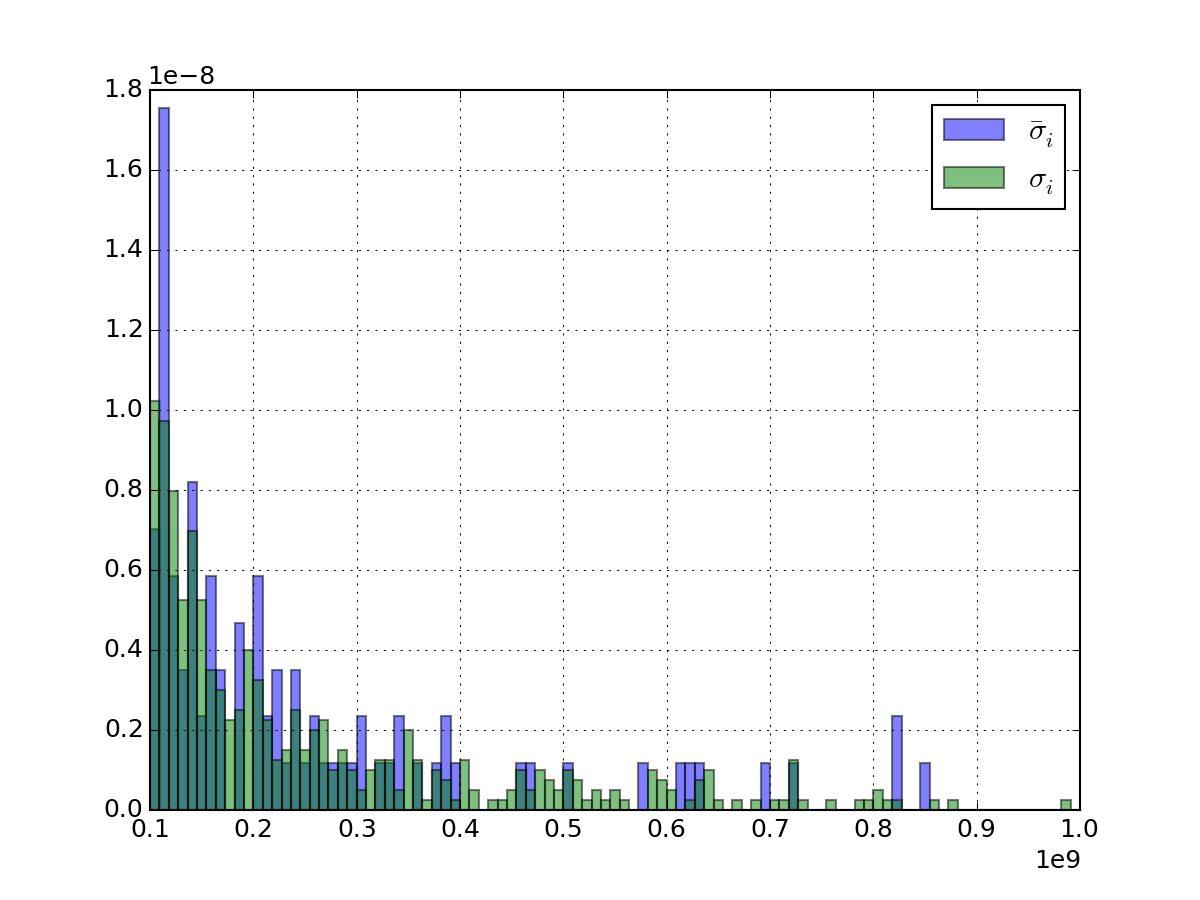
- get_average_sigma()[source]
average of individual sigma on data measurements replicates
Returns: a vector with average sigma computed for each experiment. For instance, if you have 3 replicates (R=3) on 5 psites (N=5) for E=10 experiments, you get 5 values (average of 10 sigmas computed on 3 replicates)

Note
this is not the standard deviation over experiment and replicates
 but the average
of the standard deviation over replicates. See figure below.
but the average
of the standard deviation over replicates. See figure below.>>> import pylab >>> from msdas import * >>> r = replicates.ReplicatesYeast(get_yeast_raw_data()) >>> x = pylab.linspace(1e8, 1e9, 100) >>> r.get_average_sigma().hist(bins=x, alpha=0.5, normed=True, label=r"$\bar{\sigma}_i$") >>> r.df.std(axis=1).hist(alpha=0.5, bins=x, normed=True, label=r"$\sigma_{i}$") >>> pylab.legend()
(Source code, png, pdf)

Warning
may contain NAs
- get_coefficient_variation()[source]
Return dictionary containing the coefficient of variation for each measurement

In the dictionary, keys correspond to the name of a measurement as returned by get_unique_measurement_name(). Values are time series with the coefficient of variation.
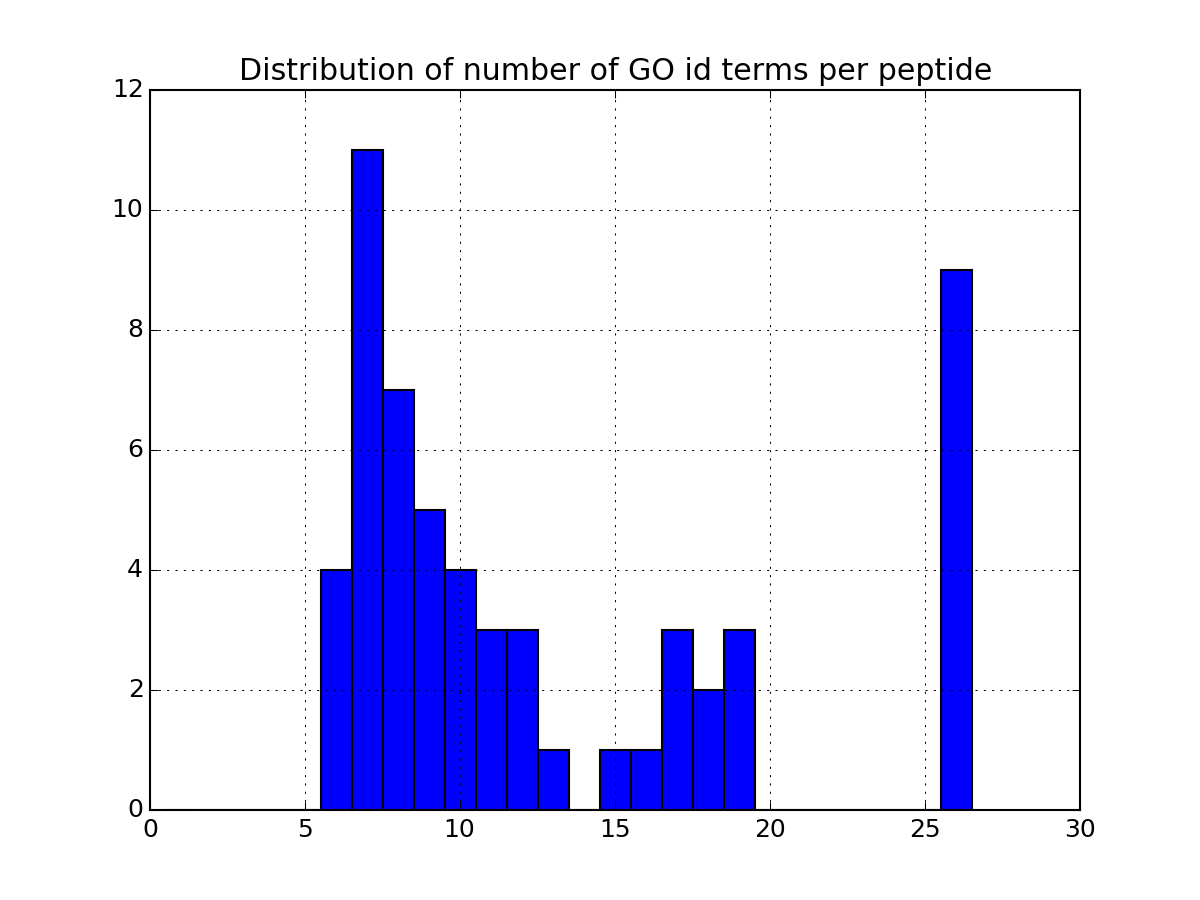
- get_errors()[source]
Returns dataframe with errors (dictionary version)
Errors are computed as follows:
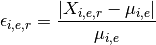
with
In the dictionary, keys correspond to the name of a measurement as returned by get_unique_measurement_name(). Values are dataframe with the errors for each replicate.
- get_mean_errors_df()[source]
Returns dataframe with errors averaged (dataframe version)
This is taking the results of get_errors(), compute the average for each key/value and builds up a dataframe.
Returns: dataframe with averaged errors. See also
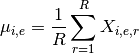
- get_mus()[source]
Return mean of replicates as a dictionary
Mathematical, it returns a NxE matrix computed as follows:
Returns: a dictionary. Keys are the E unique measurement names Values are each vector  of length N protein/psites
- get_replicates_from_one_unique_measurement(name)[source]
Given a unique name, returns a dataframe with only its replicates
See also
- get_sigmas()[source]
Return standard deviation of replicates as a dictionary
Mathematical, it returns a NxE matrix computed as follows :
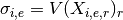
Returns: a dictionary. Keys are the E unique measurement names Values are each vector of length N protein/psites
- get_unique_measurement_name()[source]
Returns unique column names without replicates.
If there are replicates, they have the same column name in the CSV file but in the dataframe, there are encoded differently with an appended suffix. For instance, three replicates of the colum t0 will be renamed t0, t0.1, t0.2.
This method returns all unique names before the dot charater. For instance, with a dataframe that contains the following columns: t0, t0.1, t0.2, t5, t5.1, t5.2, this methods returns a list that contains t0 and t5 strings.
Note
names are sorted alphabetically
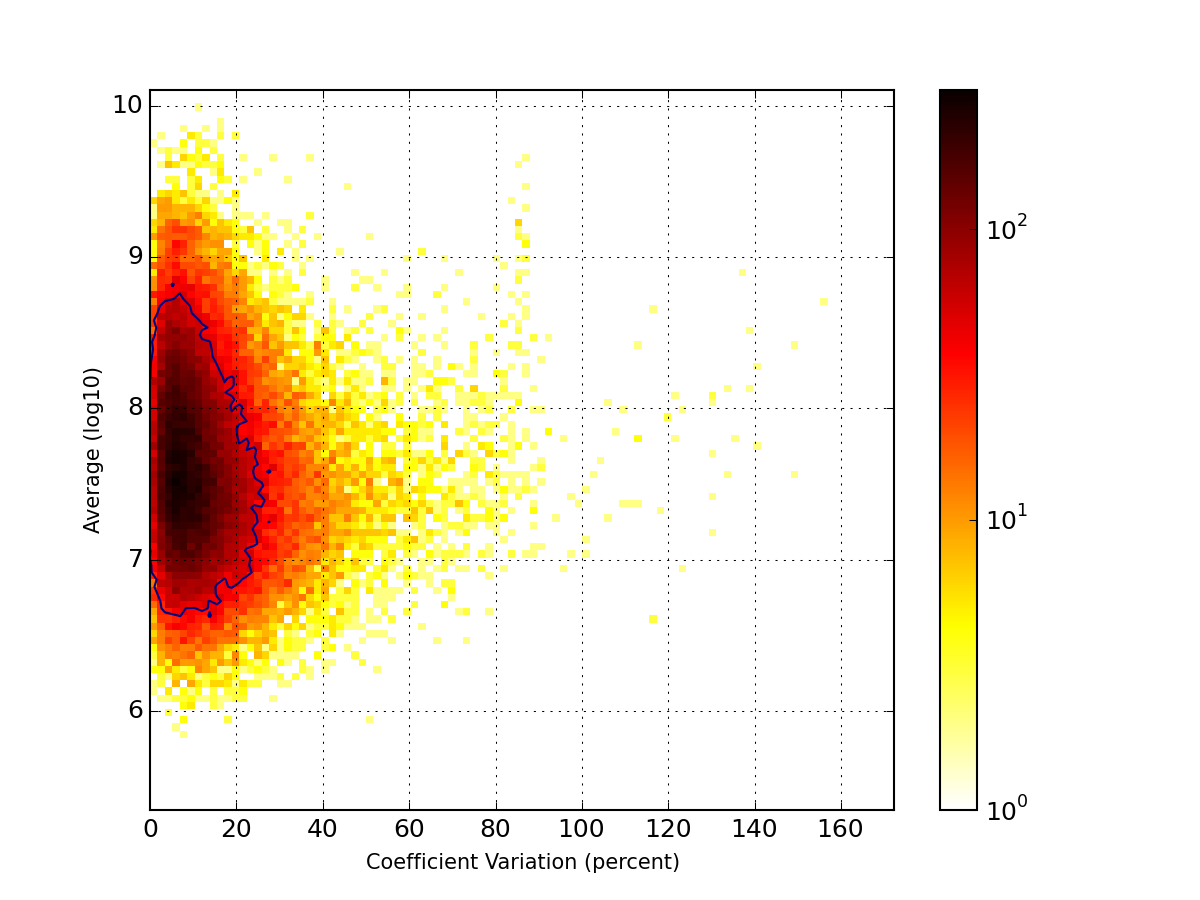
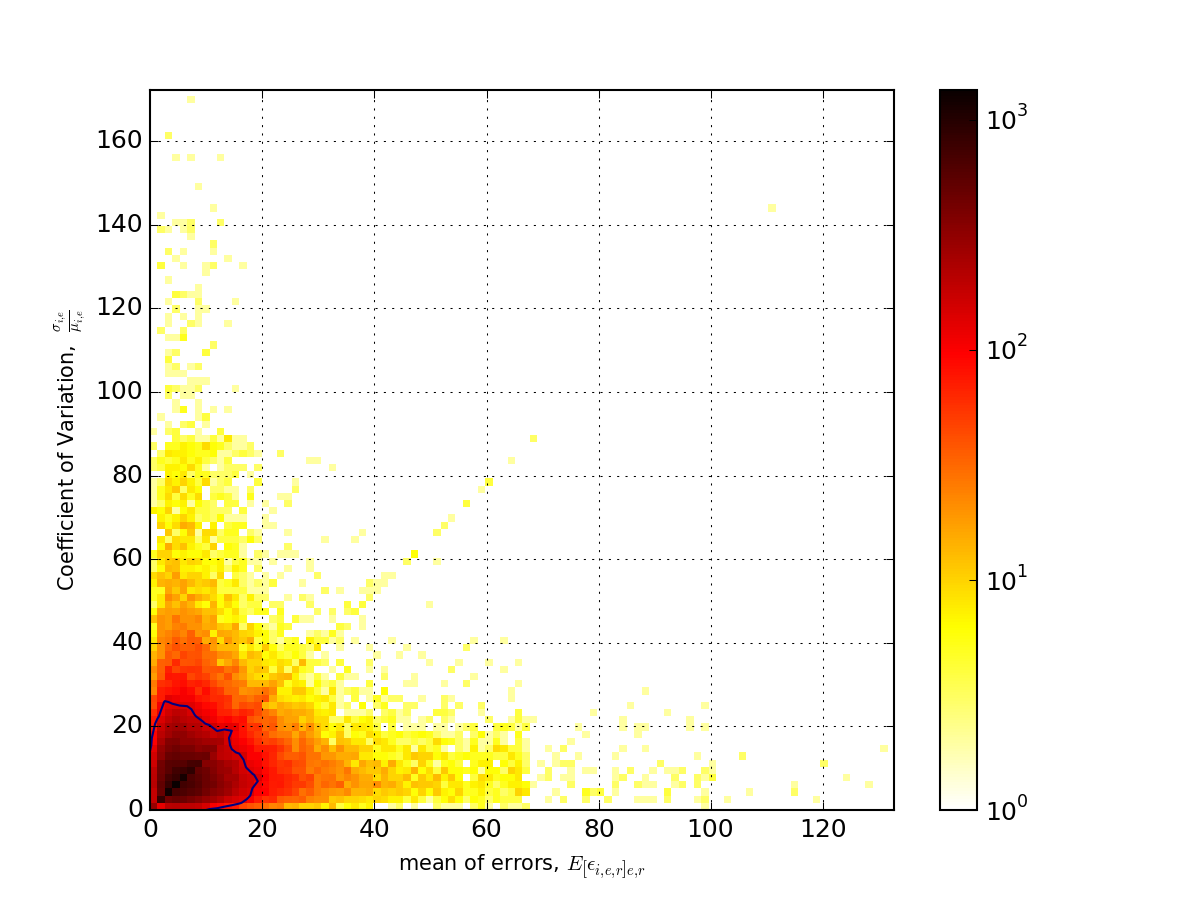
- hist2d_errors_versus_cv(bins=100, cmap='hot_r', fontsize=10, Nlevels=4, contour=True, **kargs)[source]
Show hist 2D of mean of errors across replicates and experiment versus Coefficient variation.
Parameters: - bins (int) – binning for the 2D histogram
- fontsize – fontsize for the labels
- contour – show some contours
- Nlevels (int) – must be more than 2
>>> from msdas import *
>>> r = replicates.ReplicatesYeast(get_yeast_raw_data())
>>> r.drop_na_count(54) # to speed up the plot creation
>>> r.hist2d_errors_versus_cv()
(Source code, png, pdf)

- hist2d_mu_versus_cv(bins=100, cmap='hot_r', fontsize=10, Nlevels=4, contour=True, **kargs)[source]
plots histogram of mean across replicates versus coefficient variation
Parameters: - bins (int) – binning for the 2D histogram
- fontsize – fontsize for the labels
- contour – show some contours
- Nlevels (int) – must be more than 2
>>> from msdas import *
>>> r = replicates.ReplicatesYeast(get_yeast_raw_data())
>>> r.drop_na_count(54) # to speed up the plot creation
>>> r.hist2d_mu_versus_cv()
(Source code, png, pdf)
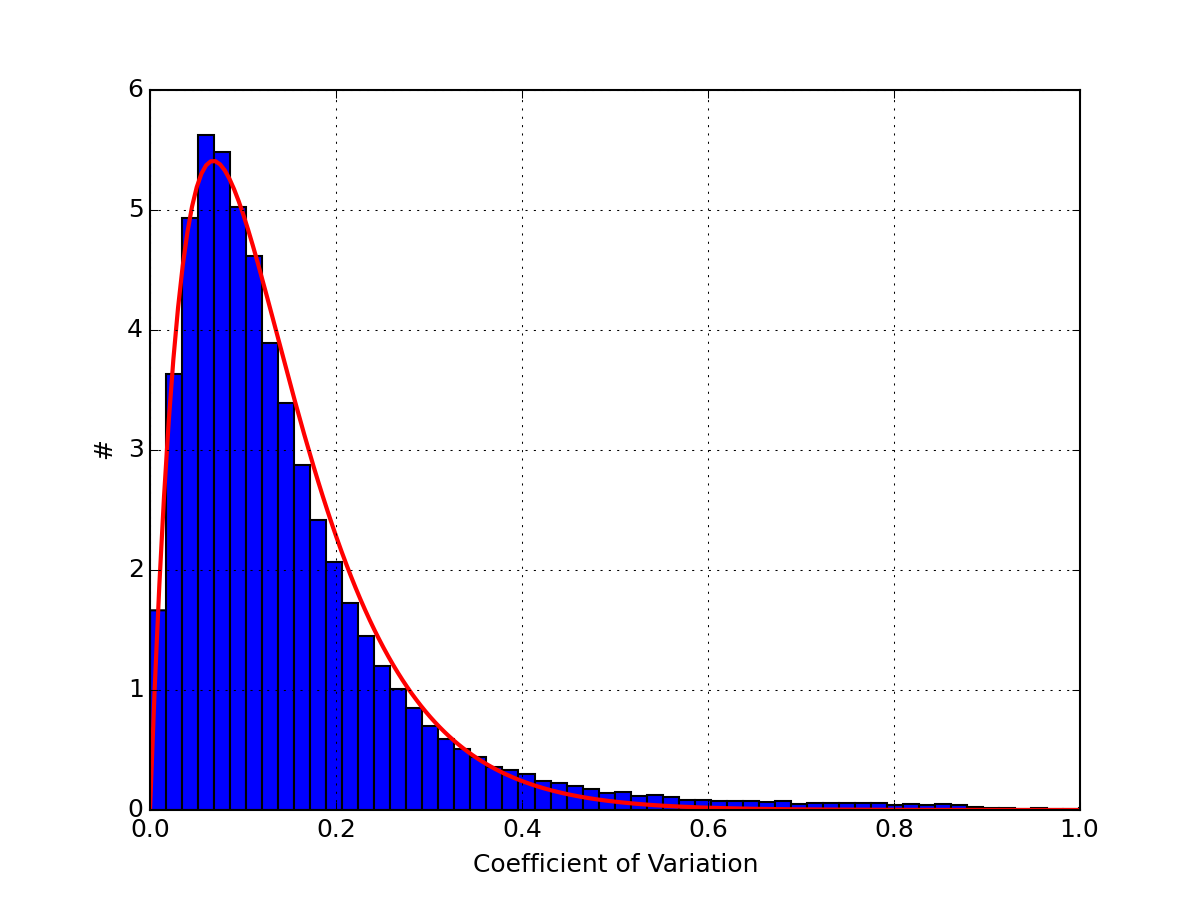
- hist_coefficient_variation(merge=True, tags=None, **kargs)[source]
Plots histogram of the coefficient variation
That is, the quantity:

import pylab
import scipy.stats
from msdas import *
r = replicates.ReplicatesYeast(get_yeast_raw_data())
r.hist_coefficient_variation(normed=True)
x = pylab.linspace(0, 1, 200)
pylab.plot(x, scipy.stats.gamma.pdf(x,2, scale=0.068), lw=2, color='r')
pylab.xlim([0,1])
(Source code, png, pdf)

- hist_na_per_experiments(bins=None, **kargs)[source]
Histogram of the number of NA per rows
Parameters: - kargs – optional parameter accepted by matplotlib.hist function.
- bins – binning of the histogram
from msdas import *
from easydev import gsf
filename= gsf("msdas", "data", "YEAST_raw_sample.csv")
r = Replicates(filename, verbose=False)
r.hist_na_per_experiments()
(Source code, png, pdf)
- pcolor_na(sort_index=False, noxticks=True, cmap='jet')[source]
plots the number of NA versus experiment and protein
Parameters: - sort_index –
- noxticks – can be slow if you have thousands of protein names
Returns: dataframe used with NAs per row and experiment
from msdas import *
from easydev import gsf
filename= gsf("msdas", "data", "YEAST_raw_sample.csv")
r = Replicates(filename, verbose=False)
r.pcolor_na()
(Source code, png, pdf)
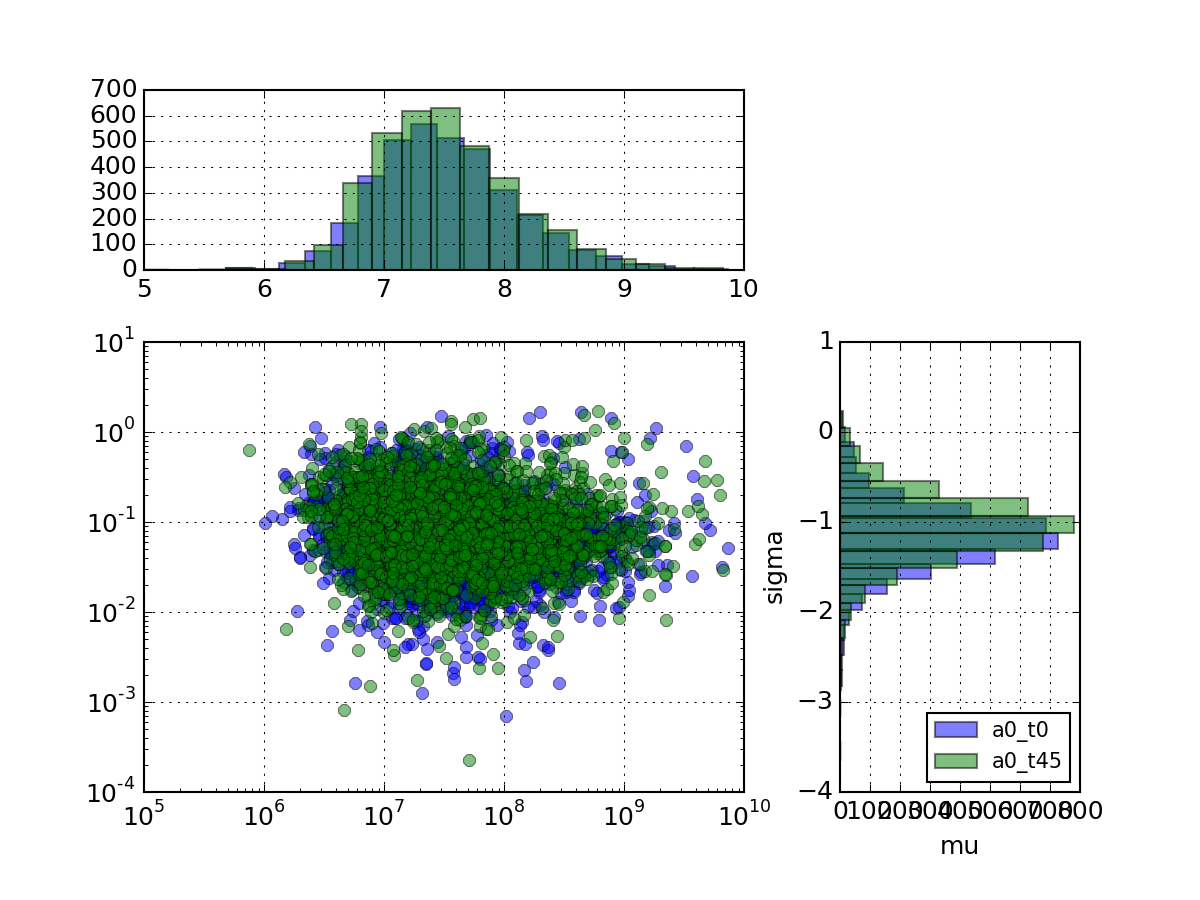
- plot_mu_sigma(tag_list=None, histograms=True, loglog=True, fontsize_legend=10)[source]
Plots coefficient variation versus sigma as a scatter plot with histograms
Parameters: tag_list (list) – list of measurement to look at (Defaults to all) from msdas import * r = replicates.ReplicatesYeast(get_yeast_raw_data()) r.plot_mu_sigma(tag_list=["a0_t0", "a0_t45"], loglog=True, histograms=True)
(Source code, png, pdf)
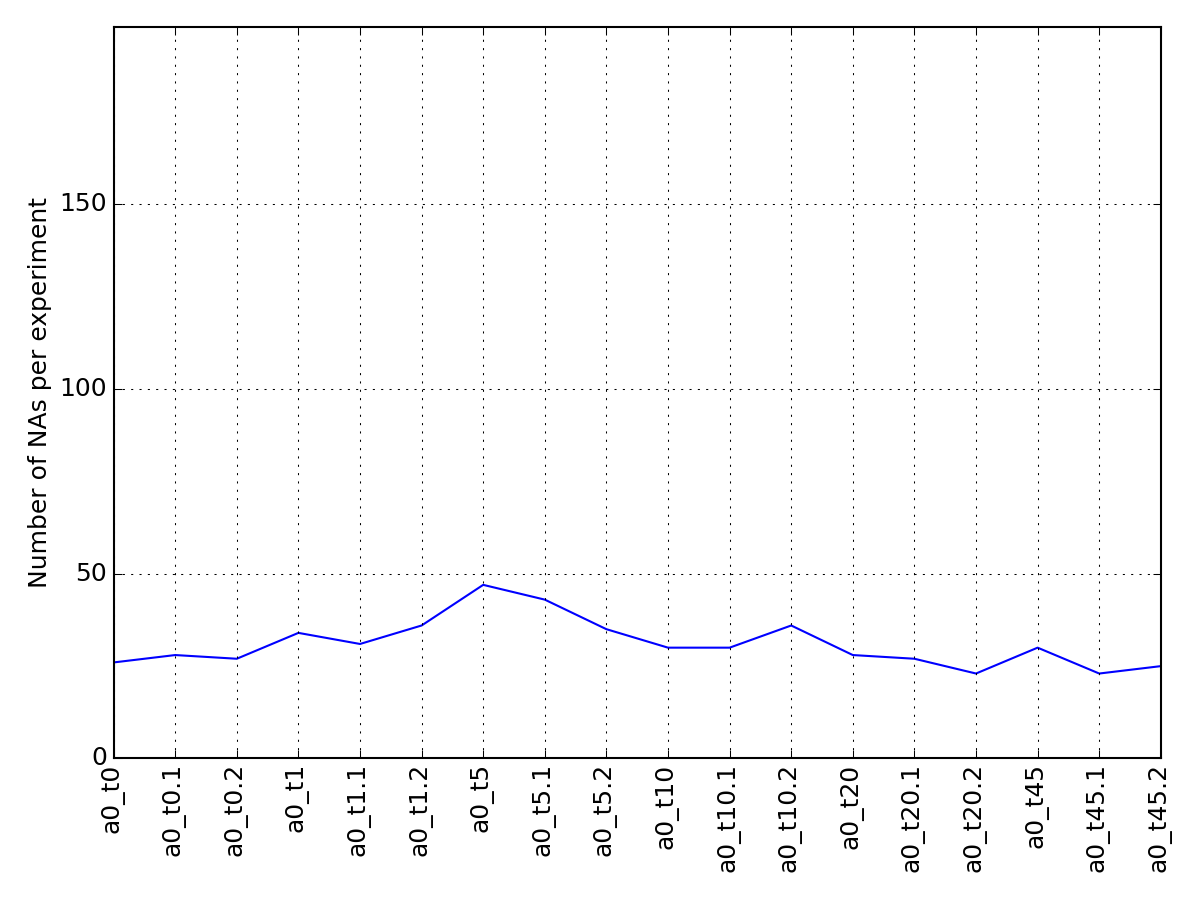
- plot_na_per_experiment(percent=False)[source]
plot curve showing number of NAs per experiment
from msdas import *
from easydev import gsf
filename= gsf("msdas", "data", "YEAST_raw_sample.csv")
r = Replicates(filename, verbose=False)
r.plot_na_per_experiment()
(Source code, png, pdf)
- reset()[source]
Reset the dataframe to its original contenst.
Since loading large data set takes some time to initialise, this could be useful for debugging if you cut the dataframe using for instance drop_na_count().
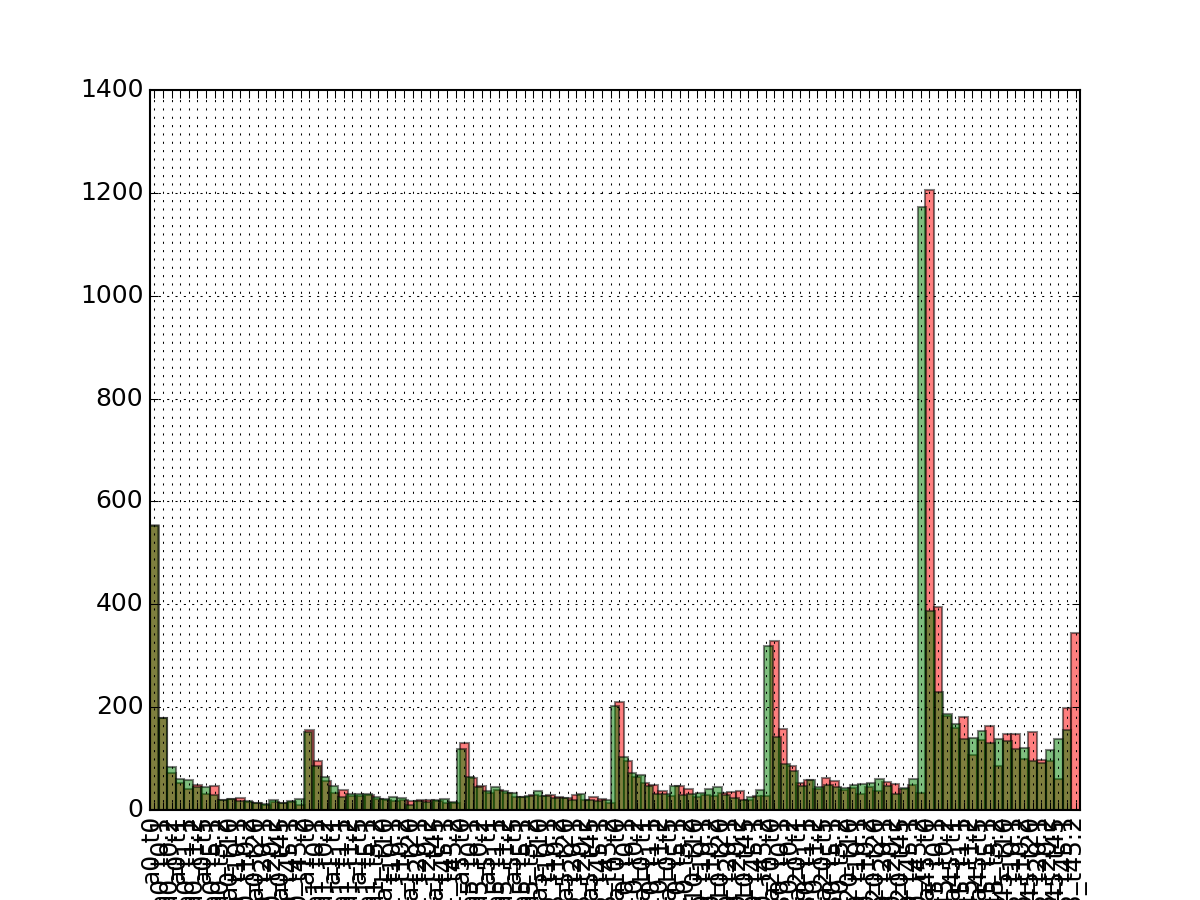
- set_irrelevant_replicates_to_na()[source]
Set unique replicate to NAs
If an experiment has no replicates (0 or 1), you may want to set the experiment to NA. This is not relevant if there are zero replicates since the value may already be an NA but may make sense when there is only one replicate, for which no errors can be obtained.
from msdas import *
r = ReplicatesYeast(get_yeast_raw_data(), verbose=False)
r.set_irrelevant_replicates_to_na()
r.hist_na_per_experiments(color="r", alpha=0.5)
r.reset()
r.hist_na_per_experiments(color="g", alpha=0.5)
(Source code, png, pdf)

1.7. psites
- class PSites(verbose=True)[source]
Utilities to manipulate and validate phosphorylation sites (psites) encoding
Psites stands for phosphorylation sites. There are encoded in different w ays depending on the input data files. This class provides methods to help decipher the different format and convert them into a common one.
Psites indicate the position of a phosphorylation on a given sequence of amino acids as well as the amino acid on which the phosphorylation occured. For instance:
S20means there is a phosphorylation on Serine at poistion 20 of the protein sequence. Possibly, you may have more than one phosphorylation. In order to encode several locations, we use the ^ character to represent an AND. Mote that sometimes a location may be ambiguous. In such case, we use the + character to represent an OR.
We use the following conventions.
- no spaces
- aminod acids are encoded with capitalised letters
- S25^T40 means there are 2 psites at position 25 AND 40
- S25+S26 means there is an ambiguity and the psite is located at poisiton 25 OR 40
- S25+S26^T40 means there are 2 psites, one of which is ambiguous (S25).
The number of psites is equal to the number of ^ characters plus one.
- AND = '^'
- OR = '+'
- append_oxidation(sequence, psites)[source]
Update psite string with Oxydation location if present in the sequence
Sometimes, the tag Oxydation is present in the sequence but not reflected in the psite string. This function update the psite according to the Oxidation tags.
Parameters: - sequence (str) – sequence of amino acid with position of phospho and oxidation as in the following example: KVS(Phospho)VGSM(Oxidation)G
- sites (str) – a valid psite string (capitalised letters)
Returns: Updated psite string with oxidation locations. See example below.
>>> from msdas.psites import PSites
>>> p = PSites()
>>> sequence = "KVS(Phospho)VGSM(Oxidation)GS(Phospho)GK"
>>> psites = "S956^S962"
>>> p.append_oxidation(sequence, psites)
'S956^M960^S962'
Todo
somehow we do not need the psite string as a parameter. Can be extracted from the sequence anyway.
- get_common_psites(psites_list)[source]
Given a list of psites of the form Y182^T180, returns common factor
>>> p = PSites()
>>> p.get_common_psites(['S177^Y182', 'T180^Y182'])
{'Y182'}
The OR characters are ignored.
Note
used by get_factorised_psites()
- get_factorised_psites(psites_list)[source]
Given a list of psites, find common and ambiguous parts and return new string
Only the AND psites are factorised.
>>> p = PSites()
>>> p.get_factorised_psites(['S177^Y182', 'T180^Y182'])
'S177+T180^Y182'
>>> p.get_factorised_psites(["S272^T277^S279", "S272^S275^S279"])
'S275+T277^S272^S279'
The returned string in the last example tells us that there are 3 phosphosites (2 ^ character + 1). The first psiste is ambiguous (S275+T277)
Note this example:
>>> p.get_factorised_psites(["S1+S4^S3", "S2+S1^S3"])
'S1+S1+S2+S4^S3'
Warning
in this example, be aware that (i), even though psites are not ordered by location in the input, there are in the output and (ii) if there are duplicates sites (e.g., S1) there are not simplified for now.
- isvalid(psites)[source]
Return true is site is using a valid format
Checks that:
- letters are capitalised and in the valid_letters (default T, Y, S, M)
- there is no spaces
- number of aminod acid is compatible with separators (+/^). e.g, T4T5 is not correct. It should be either S4+S5 or S4^S5.
Parameters: psite (str) – a psites string (e.g., S2^T5) Returns: boolean See also
the convention is explained in the class documentation.
>>> from msdas import PSites
>>> p = PSites()
>>> p.isvalid("T1+S2^T")
False
- remove_duplicated(psites)[source]
Remove duplicates psites in a psite string
>>> from msdas.psites import PSites
>>> p = PSites()
>>> p.remove_duplicated("S3^S4^S3")
'S3^S4'
- remove_spaces(psite)[source]
Removes spaces found in a psite string
Sometimes, psites are separated by ;. These characters are kept in this function but should be replaced once the meaning is known by AND or OR character.
- sort_psites_ors_only(psites)[source]
Sort psites
Parameters: psites (str) – a valid psites string. Returns: modified psites >>> from msdas import PSites >>> p = PSites() >>> p.sort_psites_ors_only("S2+S1") 'S1+S2'
Psites that contain AND character are not processed.
- sorted(psites_list)[source]
Sort the psites found in the psites list using their positions
If there is an ambiguous site, the + is ignored and only the first psite is used for the position.
>>> from msdas.psites import PSites
>>> p = PSites()
>>> p.sorted(["S3", "S1", "S4+S5"])
'S1^S3^S4+S5'
>>> p.sorted(["S3", "S1", "S8+S7"])
'S1^S3^S7+S8'
1.8. tools (modification)
- class Requires[source]
A fake decorator to require attribute to be present in a class instance.
Warning
this is for developers only.
This is not a decorator but a method to be called at the beginning of another method to check for the presence of an attribute.
- class SequenceTools[source]
Some common tools for developers
Warning
this is for developers only.
- class Modification(modif=None)[source]
Tools to manipulate the modification string found in mass spec data.
Some Mass Spec data contains modifications encoded as follows:
[3] S+79.9663|[5] S+79.9663
For this sequence:
RESPSPAPKPRMeaning there are 2 phospho sites (separated by the pipe) at position 3 (an S) and 5 (another S). This class provides tools to handle the modification.
m = Modification()
m.get_individual_psites_from_modification("[3] S+79.9663|[5] S+79.9663")
construcor
Parameters: modif – a valid modification string. If not provided, can be provided later as an attribute - example = '[3] S+79.9663|[5] S+79.9663'
- get_individual_psites(modif=None)[source]
Returns individual psite location given a full string of modifications
>>> from msdas import Modification
>>> m = Modification()
>>> m.get_individual_psites("[5] S+7777| [1] T+5555")
['S5', 'T1']
- modif2psites(modif=None)[source]
Return single psites stirng from modification string
>>> from msdas import Modification
>>> m = Modification()
>>> m.modif2psites("[5] S+7777| [1] T+5555")
'T1^S5'
Note
psites are sorted by position
See also
- modification
- psites
- psites2modif(psites)[source]
Transform a psites to a modification-like string
Parameters: psites (str) – e.g. S1^T2 see msdas.psites.PSites for details. Not implemented if + characters are present in the psites string
1.9. annotations
- class Annotations(data, organism=None, verbose=True, annotations=None, **kargs)[source]
Create/store/read annotations from uniprot and figure out entry names
The Annotations classes allows one to populate the dataframe attribute df with the Entry and Entry_name columns (UniProt entries). This is not strictly speaking required columns but provide more tools if available. The annotations also creates a new dataframe called annotations that stores in particular the protein sequence and the GO terms. The former being used to check the peptide sequence and the latter to plot relevant histogram about GO terms.
This class inherits from msdas.readers.MassSpecReader. Consequently, input can be a MassSpecReader instance, or a filename or even nothing (data can be read at a later stage). The dataframe must contain the Protein column.
One reason to fetch the entries from UniProt is that the protein column name may contain typos or non-uniprot entries, therefore it is quite useful to fetch all entries from uniprot based on the protein name provided. This can be done thanks to the get_uniprot_entries(). This method fills a dictionary called _mapping (note the underscore), which is used to populate a new column in the dataframe called Entry.
If your initial dataframe contains the columns “Entry” with all valid UniProt entries (e.g., P23300) then the _mapping attribute is populated during the initialisation and the call to get_uniprot_entries() can be skipped. If called, it will also be faster but will overwrite the content of the Entry column. You can also fill/correct/complete the _mapping attribute before calling get_uniprot_entries()
>>> from msdas import annotations
>>> import pandas as pd
>>> df = pd.DataFrame({
    'Protein':['DIG1'],
    'Sequence_Phospho':['SS(Phospho)T'],
    'Psite':['S2']})
>>> a = annotations.Annotations(df, "YEAST")
>>> a._mapping
{}
>>> a.get_uniprot_entries()
{'DIG1_YEAST': ['Q03063']}
>>> a.df.Entry
0    Q03063
Name: Entry, dtype: object
Then, call set_annotations(), which will fetch all annotations from uniprot and store them in a new dataframe in the annotations attribute
a.set_annotations()
a.annotations
A new field called Entry_name is also added to the dataframe itself:
a.df.Entry_name
On a big data set, it may take a few minutes to fetch all information from uniprot. So, we also provide tools to save and read back the relevant information ( read_annotations(), to_pickle(), to_csv() )
from msdas import *
r = readers.MassSpecReader(get_yeast_raw_data())
# this takes about 10 minutes depending on the connection for 1600 unique protein names
r.get_uniprot_entries()
r.set_annotations()
r.to_pickle(tag="test") # creates a file called YEAST_annotations_test.pkl
r.to_csv("data.csv")
Next time, just type:
from msdas import *
a = annotations.Annotations("data.csv", "YEAST")
a.read_annotations("YEAST_annotations_test.pkl")
To check that the entries are correct, one thing that can be done is to look for the peptide sequence into the FASTA sequence found in the annotations:
a.check_entries_versus_sequence()
This is a very good sanity check to verify that the entry names found correspond to the peptide provided. If not, the protein name was probably wrong or was a gene name that could not be mapped correctly to the correct protein.
If some entries are not found or mapping was not found, you need to manually check the issues and update the _mapping attribute, update the uniprot entries and annotations:
a._mapping[entry] = ['entry name']
a.get_uniprot_entries()
a.set_annotations()
a.check_entries_versus_sequence()
if you cannot find a mapping, we would recommend to delete the item from the dataframe df.
Constructor
Parameters: - data – a MassSpecReader compatible input (e.g., CSV file, None, a MassSpecReader instance). See msdas.readers.MassSpecReader documentation for details
- organism – valid uniprot identifier for the organism e.g., HUMAN YEAST.
- annotations – a pickled file containing the annotations saved using to_pickle().
- kargs – valid parameter recognised by msdas.readers.MassSpecReader
- annotations = None
the dataframe where annotations from uniprot will be stored.
- check_entries_versus_sequence()[source]
Check that peptide sequence are contained in uniprot sequence
This is a very good sanity check on the validity of the uniprot entry names found by get_uniprot_entries() method
If a peptide sequence is not found, it means that the protein name is not correct.
See AnnotationsYeast class where the AnnotationsYeast.update_mapping() is used to update the incorrect mapping.
See also
- find_sequence_blast(seq, email)[source]
Utility to search for a sequence using BLAST via bioservices
Parameters: - seq (str) – the sequence
- email – a valid email address
Note
This is using NCIBlast web service via BioServices.
- get_uniprot_entries(Nmax=50)[source]
Search for the uniprot entries and entry names given protein column.
Protein names from the dataframe are first used to feed uniprot mapping tool. Some protein names won’t be found as a uniprot entry because there are not uniprot entry name but gene names. We therefore also scan missing entries by looking for gene names. Once found, the proposed items that contain the gene names and organism are candidates for the entry names. There may be several solutions though, which explain why the values in the _mapping dictionary are made of lists. If several candidates are found, warning and raised.
Results are stored in _mapping and in the dataframe itself.
Let us show one example with 3 protein names that cover all cases:
- DIG1, is a valid uniprot entry
- ASC1 is not a uniprot entry. It is a gene name from which the entry may be retrieved automatically.
- LEU1 is a gene name AND a uniprot entry. This is an ambiguous case. The default is to use the uniprot entry but if you call check_entries_versus_sequence() (after meth:set_annotations) you will see that there is a mismatch meaning that LEU1_YEAST provided in the protein column is catually not the protein name but the gene name
>>> import pandas as pd
>>> from msdas import *
>>> df = pd.DataFrame({'Protein':['DIG1', 'LEU1', 'ASC1'],
    'Sequence_Phospho':['S(Phospho)APAQVTQHSK', 'VEVTS(Phospho)EDEK',
                        'DS(Phospho)VTIISAGNDK'],
    'Psite':['S142','S495', 'S166']})
>>> a = Annotations(df, "YEAST)
>>> a.get_uniprot_entries()
>>> a._mapping
{'ASC1_YEAST': ['P38011', 'P01120'],
 'DIG1_YEAST': ['Q03063'],
 'LEU1_YEAST': ['P06208-1', 'P06208']}
Here, DIG1 has one unique entry. This is expected because DIG1 is in fact an entry name (unique by definition). ASC1 is a gene name. This method figures out that it correspond to either P38011 or P01120. There are several entries because mapping from gene to protein is not unique. By default, the entry with highest score appears first. There is no 100% guarantee that this mapping is correct and check_entries_versus_sequence() should be called to check that the peptide sequence is contained in this entry sequence. The last case (LEU1) is even more problematic because it is a valid entry name even though the protein name provided is actually a gene name... again call check_entries_versus_sequence().
>>> a.set_annotations()
>>> a.check_entries_versus_sequence()
P06208-1 not found in the annotations index
So, here we are told that amongst the 3 entries, P06208-1 is not found. This the LEU1 case. If you were to use batch tool, you would figure out given the peptide sequence that this is actually LEUC_YEAST entry with uniprot entry LEUC_YEAST/P07264.
So, you need to manually update the mapping:
>>> a._mapping['LEU1_YEAST'] = ['P07264']
>>> a.get_uniprot_entries() # to update the main df with new entries
>>> a.set_annotations() # to retrieve the sequence of LEUC_YEAST
>>> a.check_entries_versus_sequence()
See also
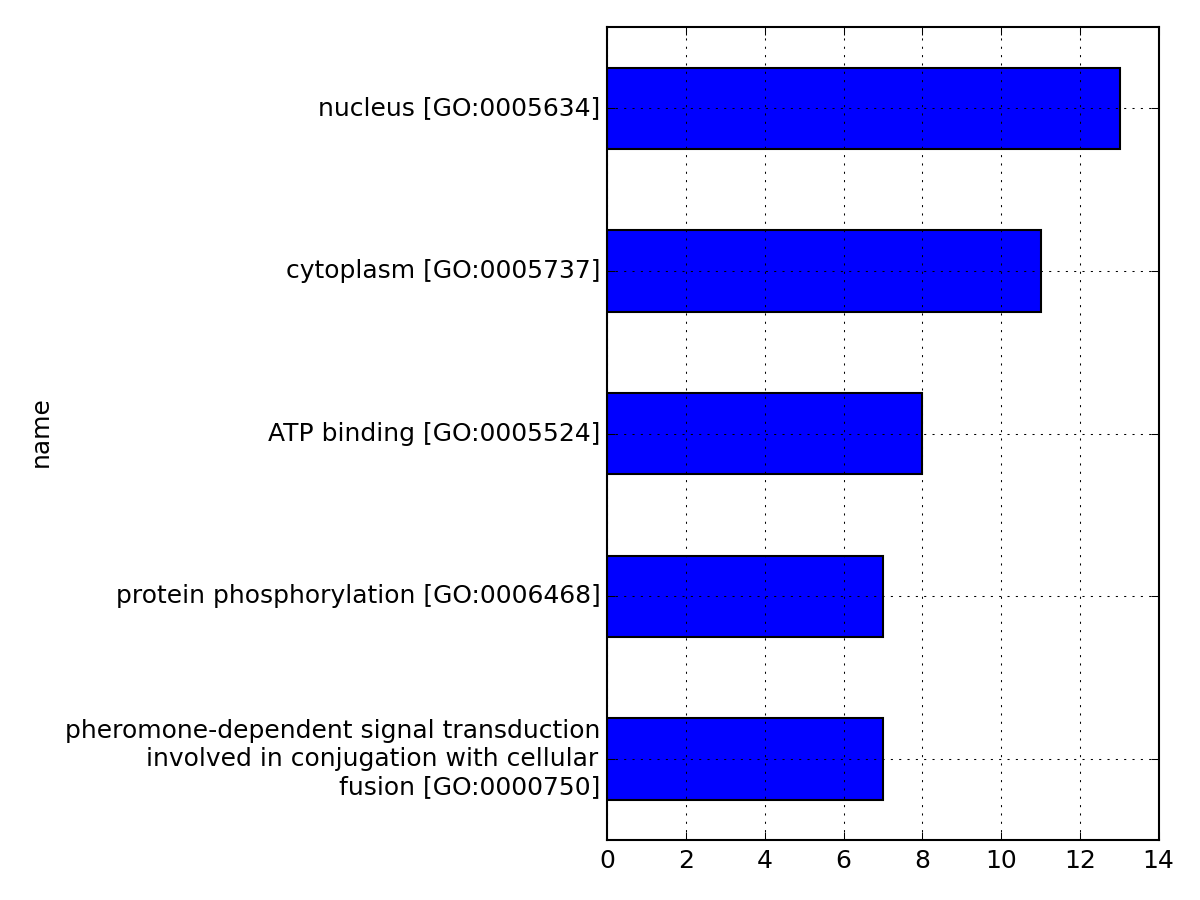
- hist_most_relevant_goids(N=10, tight_layout=True, wrap_length=40, drop_duplicates=True, **kargs)[source]
Plot histogram of the GO identifiers found in all proteins.
Parameters: - N (int) – restrict histogram to terms that appear at least N times
- wrap_length (int) – wrap text on the y-axis by wrap_length (defaults to 40)
- drop_duplicates – drop the duplicated entries
- kargs – pandas.plot arguments accepted.
from msdas import *
m = Annotations(get_yeast_small_data(), "YEAST", verbose=False)
m.set_annotations()
m.hist_most_relevant_goids(N=5)
(Source code, png, pdf)

Todo
this is made on the annotations dataframe. Should be done based on the entry names in the dataframe
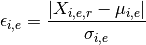
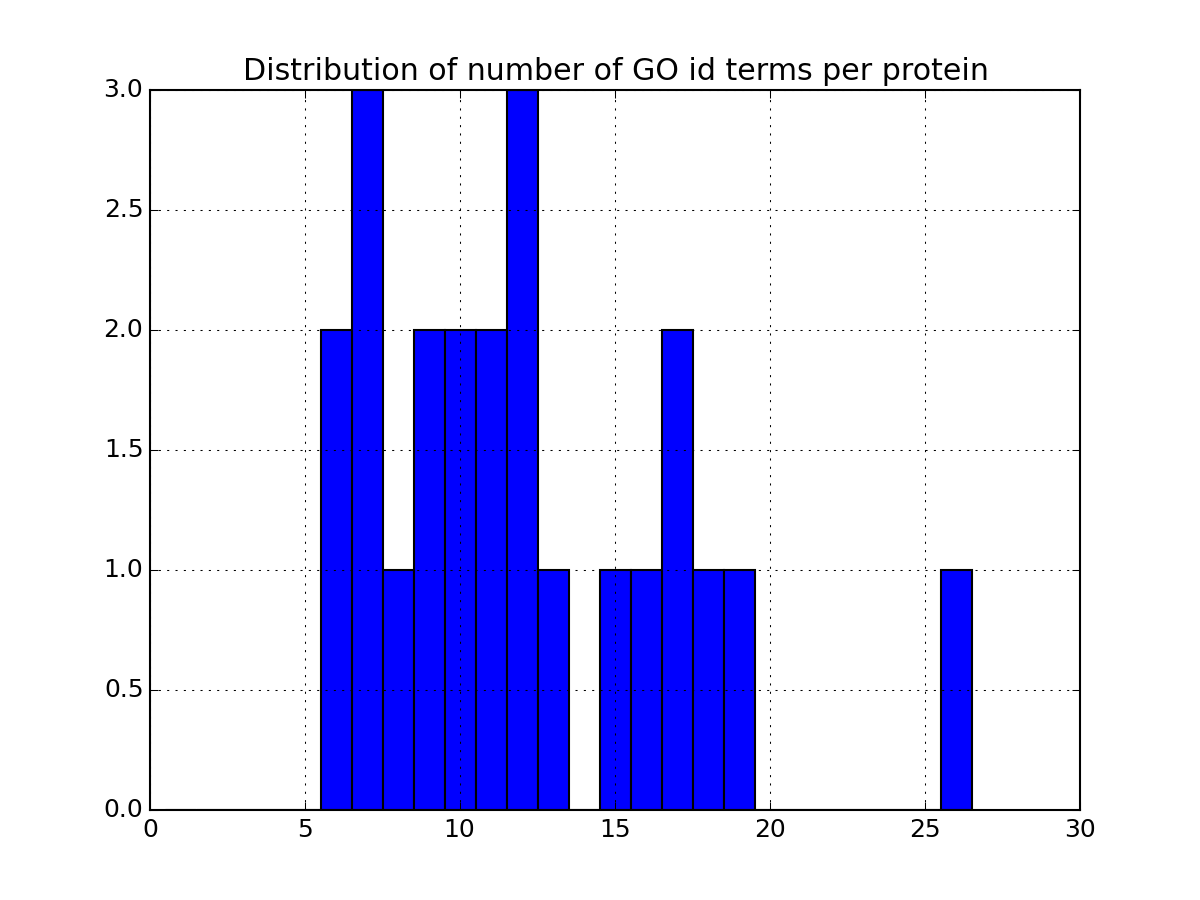
- plot_goid_histogram(drop_duplicates=True)[source]
Histrogram of the number of GO terms per petide or protein
Parameters: drop_duplicates – ignore duplicates entries from msdas import * m = Annotations(get_yeast_small_data(), "YEAST", verbose=False) m.set_annotations() m.plot_goid_histogram()
Todo
is this functional process or not
- read_pickle(filename)[source]
Read annotations in pickled format as saved by to_pickle()
Parameters: filename (str) – filename to read
- set_annotations(Nmax=100)[source]
Fetched all information from uniprot and set annotations as a pandas dataframe.
Look into the dataframe Entry column and update the annotations dataframe to populate missing entries. The Entry column in the df should have been populated by get_uniprot_entries() with valid entries from Uniprot.
If you have thousand of entries, this is taking a few minutes. You can save the annotations and read them back using msdas.MassSpecReader.read_annotations() and to_pickle().
- to_csv(filename)[source]
Export the dataframe with data and annotations into a CSV file
set_annotations() and get_uniprot_entries() must have been called.

- class AnnotationsYeast(data, verbose=True, annotations=None, **kargs)[source]
Class dedicated to the YEAST data analysis
This class is almost identical to Annotations. It contains extra code to cleanup the mapping based on further manual investigations of the gene mapping to protein, which may be ambiguous (see Annotations.get_uniprot_entries() for details).
from msdas import *
from easydev import gsf
filename = gsf("msdas", "data", "YEAST_raw_sample.csv")
r = MassSpecReader(r)
a = AnnotationsYEAST(r)
a.get_uniprot()
a.set_annotations()
Only 80% of the protein names are found directly using UniProt. The 20% remaining are actually gene names on which a mapping to protein has to be done. Yet, sometimes, there is an ambiguity that remains either because the gene name is also a valid entry name or because the gene maps to several entry names. This list gives some of these ambiguities. The first one is used by default (based on highest score) but may not be correct. See for instance Annotations.check_entries_versus_sequence() to help you figuring out which one is the correct one.
- ALD3_YEAST [‘P54114’, ‘P40047’]
- ALD4_YEAST [‘P46367’, ‘P54114’]
- CKI1_YEAST [‘P20485’, ‘P23292’]
- CPR1_YEAST [‘P14832’, ‘P16603’]
- PRS5_YEAST [‘Q12265’, ‘P23638’]
- RPL16B_YEAST [‘P26785’, ‘Q3E757’, ‘P05739’]
- RPL32_YEAST [‘P38061’, ‘P14120’]
- RPL6A_YEAST [‘Q02326’, ‘P05737’]
- RPS7A_YEAST [‘P26786’, ‘P0CX36’]
- RPS7B_YEAST [‘P48164’, ‘P0CX35’]
- CPR1_YEAST [‘P14832’, ‘P16603’]
- ECM17_YEAST [‘P40458’, ‘P47169’]
- RPL16B_YEAST [‘P26785’, ‘Q3E757’, ‘P05739’]
- RPS7B_YEAST [‘P48164’, ‘P0CX35’]
- ASC1_YEAST [‘P38011’, ‘P01120’]
- ECM17_YEAST [‘P40458’, ‘P47169’]
Notes on the data: - NPL3_356^S349 has a wrong psite name. Given the sequence, it should be NPL3_S349
- Same issue with TIF3 (IF4B_YEAST) where trailing number without phospho was removed by hand.
- FLO9 1004^554^464^374^T329^T779, T(Phospho)GTFTSTSTEM(Oxidation)TTVTGTNGQPTDETVIVI should be T779
- One entry is AD5;7 which is wrongly named to not clash with CSV format. The proper name is indeed AD5,7. We renamed it in the file as PUR2_YEAST. We checked the sequence
- To find the mapping, we used blast from bioservices to figure out the sequence of the protein and checked on uniprot. See update_mapping function
- Typo in the original code for ABP1 peptide: small e was found. KEPVKT eSP APAAK should be KEPVKT PSP APAAK
- Possible typo is STE11_S323 location should be S326
- Also possible typoe IMP2 has 2 rows called IMP2’ (note the quote)
Here are proteins names provided in the Yeast_data_set that are actually gene names. Using bioservices, we figure out possible uniprot entries but similarlly to the YEF3 there is maybe an ambiguity on the name:
77 P54114 ALD4   could be ALDH4_YEAST ([') whereas P54114 is ALD3
2077 P23638 PRS5    KPR5_YEAST  '
6664 P01120 ASC1  GBLP_YEAST  P38011
there are 6 peptide labelled CTR9. In fact, it is 2 different peptides. first 4 are CTR9 2 last are EAMAISEHNVKDDSDLSDKDNEYDEEQPR . This is defintely CTR9 but is not exactly in the sequence. Missing K at the end
SIR1_YEAST exists but the peptide sequence cannot be found either using blast or manual searh on uniprot possibly sirp1 but not yeast organism; it is yeasb. Actually may still be SIR1 but Uniprot changed the sequence. See persona communicatoin with uniprot.
Constructor
Same as Annotations except that organism must not be provided.
- update_mapping()[source]
Update the mapping with known keys
There are issues in the naming because of a mixing of protein and gene names. Methods in Annotations found most of the mapping. However, there are some ambiguities and the mappind dictionary is corrected as follows. Checked with uniprot and blast.
we remove “ADE5,7_YEAST” (replaced by PUR2 if found)
ADE5,7_YEAST P07244 PUR2_YEAST YEF3_YEAST P16521 FEN1_YEAST P25358 FEN1 is actually ELO2_YEAST HIS7_YEAST P33734 HIS7 is actually HIS5_YEAST LEU1_YEAST P07264 this is LEUC_YEAST P07264 NTH1_YEAST P32356 TREA_YEAST NTH2_YEAST P35172 TREB_YEAST ECM17_YEAST P47169 MET5_YEAST RPL6A_YEAST Q02326 RL6A_YEAST RPS7A_YEAST P26786 RS7A_YEAST YJU2_YEAST P28320 CWC16_YEAST no blast results but checked ASC1_YEAST P38011 GBLP_YEAST PSA1_YEAST P41940 no blast result; gene name MPG1_YEAST CTR9_YEAST P89105 CTR9_YEAST correct but see note below IMP2_YEAST P32351 IMPX_YEAST no blast result;IMP2 is gene name Note
there is also a protein called IMP2’ (note the quote), which presumably is also IMP2. Kept as it is fow now