2. Building PKN
From the uniprot annotations:
from msdas import *
a = annotations.Annotations(get_yeast_small_data(), "YEAST")
a.get_uniprot_entries()
a.set_annotations()
n = network.NetworkFromUniProt(a.annotations)
c = n.get_cnograph_intact()
c.plot()
c.export2sif("PKN-uniprot.sif")
From phosphogrid (yeast case only):
from msdas import phosphogrid, readers, yeast
m = readers.MassSpecReader(yeast.get_yeast_small_data())
gene_names = set(list(m.df.Protein))
p = phosphogrid.PhosphoGRID()
p.run(gene_names=gene_names)
p.export2sif()
p.plot()
p.export2sif("PKN-phospho.sif")
(Source code, png, pdf)

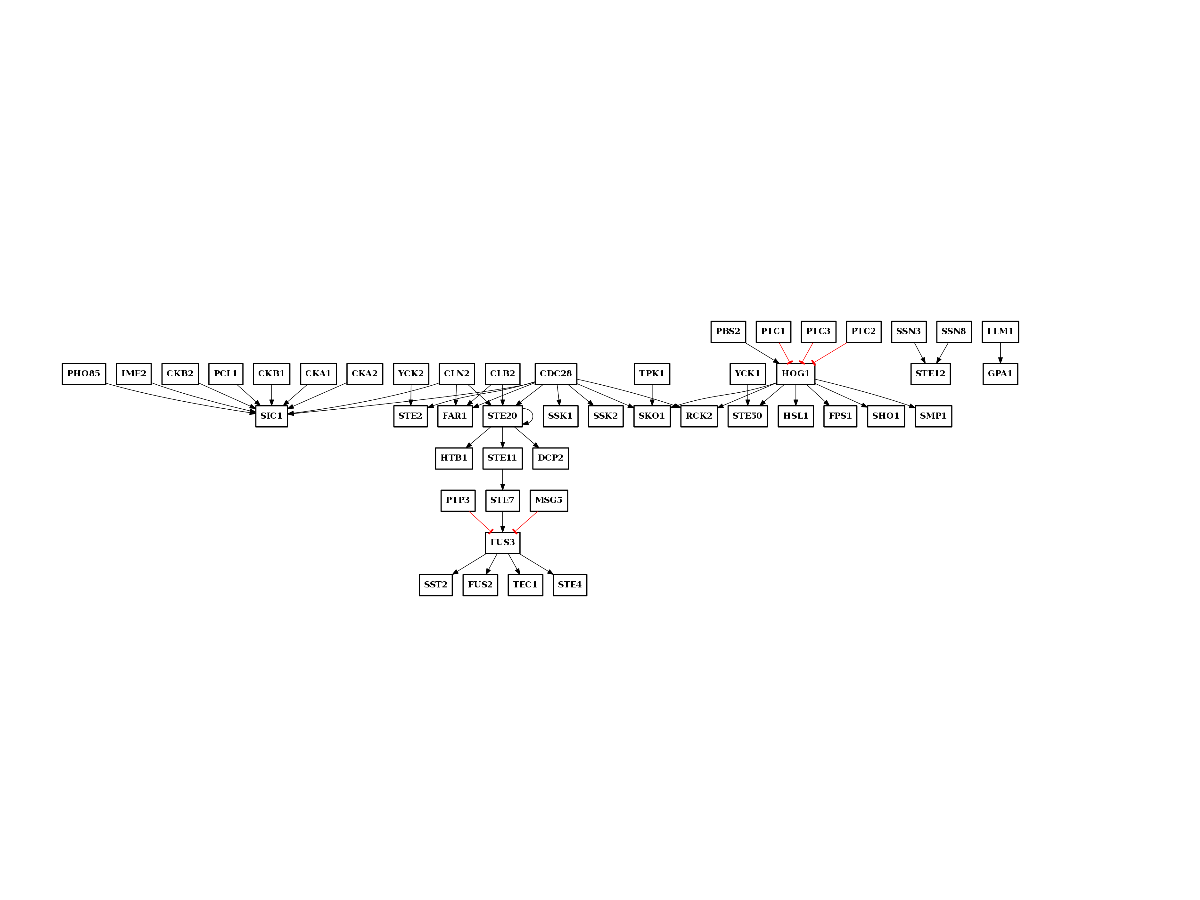
In addition, we have a PKN that comes from curation. It is in the MS-DAS shared directory and is called PKN-yeast.sif:
from cellnopt.core import CNOGraph
from easydev import get_share_file as gsf
c = CNOGraph(gsf("msdas", "data", "PKN-yeast.sif"))
c.plotdot()
(Source code, png, pdf)

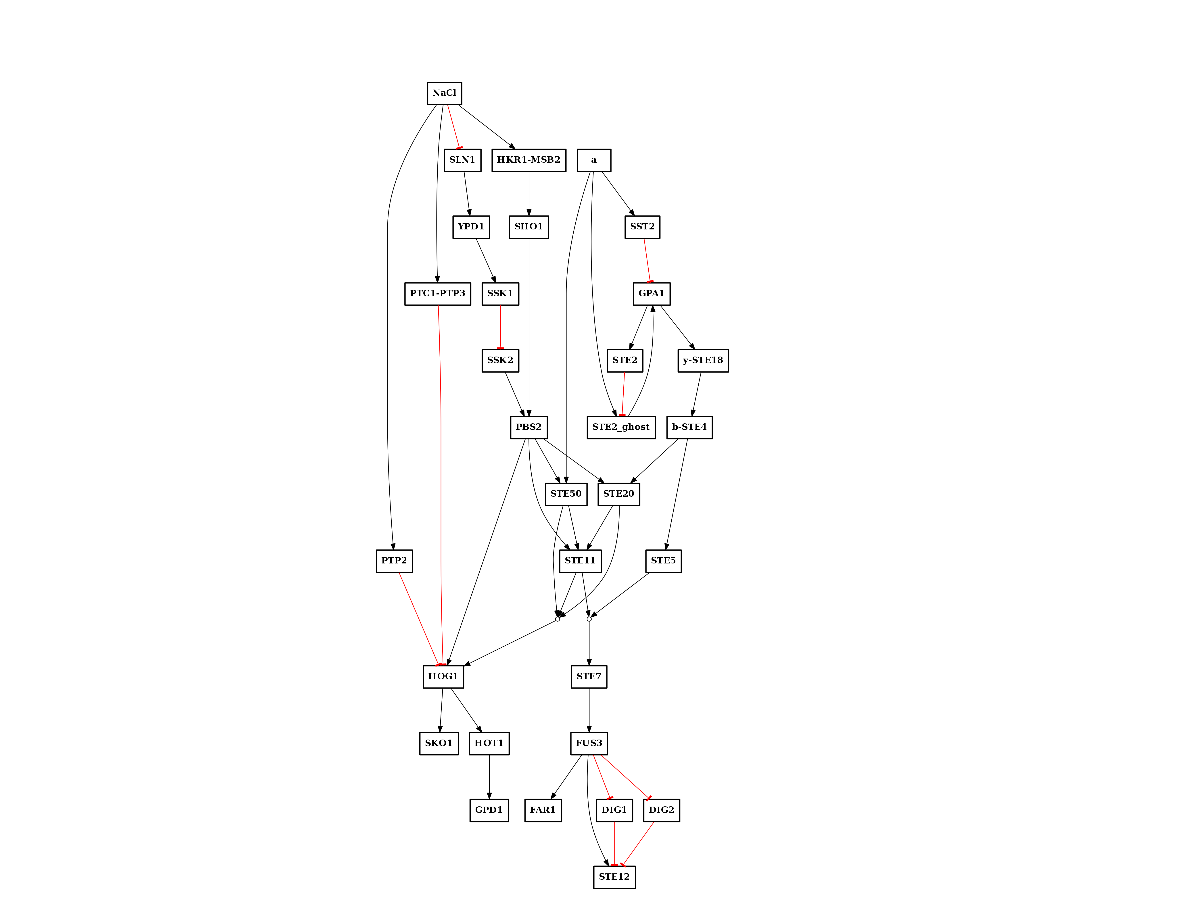
We can now combine the 3 PKNs. Note, however, that is the current version, the names in the second PKN have the organism appended to the node names, so we first need to remove that suffix. Then, we can use CNOGraph from cellnopt.core package to merge the 3 PKNs together:
from msdas import phosphogrid, readers, yeast
m = readers.MassSpecReader(yeast.get_yeast_small_data())
from cellnopt.core import *
from easydev import get_share_file as gsf
# Curated PKN
c1 = CNOGraph(gsf("msdas", "data", "PKN-yeast.sif"))

# Uniprot PKN
c2 = CNOGraph("PKN-uniprot.sif")
# rename node names
mapping = dict([(n, n.split("_")[0]) for n in c2.nodes()])
c2 = c2.rename_node(mapping)

# phosphogrid PKN
c3 = CNOGraph("PKN-phospho.sif")

# In order to see the contribution, we need to combine the  PKNs using CNOGraphMultiEdges
c = cnograph.CNOGraphMultiEdges()
for e in c1.edges(data=True):
    c.add_edge(e[0], e[1], edgecolor=.1, **e[2])
for e in c2.edges(data=True):
    c.add_edge(e[0], e[1], edgecolor=.5, **e[2])
for e in c3.edges(data=True):
    c.add_edge(e[0], e[1], edgecolor=.9, **e[2])
c._stimuli = ["a","NaCl"]
c._signals = list(set(m.df.Protein))
c.cutnonc() # this is taking for ever ... why ?

c.plotdot(edge_attribute="edgecolor", cmap="jet")

from pylab import barh, legend
barh(00,00,10,color=c._get_hex_color_from_value(.9, "jet"))
barh(00,00,10,color=c._get_hex_color_from_value(.5, "jet"))
barh(00,00,10,color=c._get_hex_color_from_value(.1, "jet"))
legend(["phospho","uniprot","curated"], loc="lower right")
from cellnopt.core import CNOGraph
from easydev import get_share_file as gsf
from msdas import phosphogrid, yeast, readers
m = readers.MassSpecReader(yeast.get_yeast_small_data())
# Curated PKN
c1 = CNOGraph(gsf("msdas", "data", "PKN-yeast.sif"))

# Uniprot PKN
c2 = CNOGraph("PKN-uniprot.sif")

# phosphogrid PKN
c3 = CNOGraph("PKN-phospho.sif")

# In order to merge, we can use the CNOGraph. Note however, that multi edges are merged.
# if activation and inhibition at the same time, one is taken randomly
c = c1+c2+c3
c._stimuli = ["a","NaCl"]
c._signals = list(set(m.df.Protein))
c.cutnonc()
c.plot()