Plot widget fundamentals
QwtPlot
-
class
qwt.plot.QwtPlot(*args)[source]¶ A 2-D plotting widget
QwtPlot is a widget for plotting two-dimensional graphs. An unlimited number of plot items can be displayed on its canvas. Plot items might be curves (
qwt.plot_curve.QwtPlotCurve), markers (qwt.plot_marker.QwtPlotMarker), the grid (qwt.plot_grid.QwtPlotGrid), or anything else derived fromQwtPlotItem.A plot can have up to four axes, with each plot item attached to an x- and a y axis. The scales at the axes can be explicitly set (QwtScaleDiv), or are calculated from the plot items, using algorithms (QwtScaleEngine) which can be configured separately for each axis.
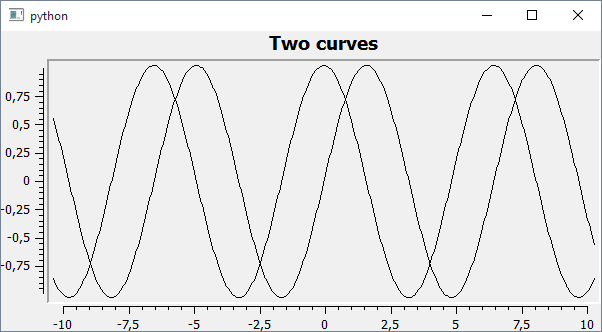
The following example is a good starting point to see how to set up a plot widget:
from qwt.qt.QtGui import QApplication
from qwt import QwtPlot, QwtPlotCurve
import numpy as np

app = QApplication([])

x = np.linspace(-10, 10, 500)
y1, y2 = np.cos(x), np.sin(x)

my_plot = QwtPlot("Two curves")
curve1, curve2 = QwtPlotCurve("Curve 1"), QwtPlotCurve("Curve 2")
curve1.setData(x, y1)
curve2.setData(x, y2)
curve1.attach(my_plot)
curve2.attach(my_plot)
my_plot.resize(600, 300)
my_plot.replot()
my_plot.show()

app.exec_()
-
class
QwtPlot([title=""][, parent=None])¶ Parameters: - title (str) – Title text
- parent (QWidget) – Parent widget
-
QwtPlot.axisWidget(axisId)[source]¶ Parameters: axisId (int) – Axis index Returns: Scale widget of the specified axis, or None if axisId is invalid.
-
QwtPlot.setAxisScaleEngine(axisId, scaleEngine)[source]¶ Change the scale engine for an axis
Parameters: - axisId (int) – Axis index
- scaleEngine (qwt.scale_engine.QwtScaleEngine) – Scale engine
See also
-
QwtPlot.axisScaleEngine(axisId)[source]¶ Parameters: axisId (int) – Axis index Returns: Scale engine for a specific axis See also
-
QwtPlot.axisAutoScale(axisId)[source]¶ Parameters: axisId (int) – Axis index Returns: True, if autoscaling is enabled
-
QwtPlot.axisEnabled(axisId)[source]¶ Parameters: axisId (int) – Axis index Returns: True, if a specified axis is enabled
-
QwtPlot.axisFont(axisId)[source]¶ Parameters: axisId (int) – Axis index Returns: The font of the scale labels for a specified axis
-
QwtPlot.axisMaxMajor(axisId)[source]¶ Parameters: axisId (int) – Axis index Returns: The maximum number of major ticks for a specified axis
-
QwtPlot.axisMaxMinor(axisId)[source]¶ Parameters: axisId (int) – Axis index Returns: The maximum number of minor ticks for a specified axis
-
QwtPlot.axisScaleDiv(axisId)[source]¶ Parameters: axisId (int) – Axis index Returns: The scale division of a specified axis axisScaleDiv(axisId).lowerBound(), axisScaleDiv(axisId).upperBound() are the current limits of the axis scale.
-
QwtPlot.axisScaleDraw(axisId)[source]¶ Parameters: axisId (int) – Axis index Returns: Specified scaleDraw for axis, or NULL if axis is invalid.
-
QwtPlot.axisStepSize(axisId)[source]¶ Parameters: axisId (int) – Axis index Returns: step size parameter value This doesn’t need to be the step size of the current scale.
-
QwtPlot.axisInterval(axisId)[source]¶ Parameters: axisId (int) – Axis index Returns: The current interval of the specified axis This is only a convenience function for axisScaleDiv(axisId).interval()
See also
-
QwtPlot.axisTitle(axisId)[source]¶ Parameters: axisId (int) – Axis index Returns: Title of a specified axis
-
QwtPlot.enableAxis(axisId, tf=True)[source]¶ Enable or disable a specified axis
When an axis is disabled, this only means that it is not visible on the screen. Curves, markers and can be attached to disabled axes, and transformation of screen coordinates into values works as normal.
Only xBottom and yLeft are enabled by default.
Parameters: - axisId (int) – Axis index
- tf (bool) – True (enabled) or False (disabled)
-
QwtPlot.invTransform(axisId, pos)[source]¶ Transform the x or y coordinate of a position in the drawing region into a value.
Parameters: - axisId (int) – Axis index
- pos (int) – position
Warning
The position can be an x or a y coordinate, depending on the specified axis.
-
QwtPlot.transform(axisId, value)[source]¶ Transform a value into a coordinate in the plotting region
Parameters: - axisId (int) – Axis index
- value (fload) – Value
Returns: X or Y coordinate in the plotting region corresponding to the value.
-
QwtPlot.setAxisFont(axisId, font)[source]¶ Change the font of an axis
Parameters: - axisId (int) – Axis index
- font (QFont) – Font
Warning
This function changes the font of the tick labels, not of the axis title.
-
QwtPlot.setAxisAutoScale(axisId, on)[source]¶ Enable autoscaling for a specified axis
This member function is used to switch back to autoscaling mode after a fixed scale has been set. Autoscaling is enabled by default.
Parameters: - axisId (int) – Axis index
- on (bool) – On/Off
See also
Note
The autoscaling flag has no effect until updateAxes() is executed ( called by replot() ).
-
QwtPlot.setAxisScale(axisId, min_, max_, stepSize=0)[source]¶ Disable autoscaling and specify a fixed scale for a selected axis.
In updateAxes() the scale engine calculates a scale division from the specified parameters, that will be assigned to the scale widget. So updates of the scale widget usually happen delayed with the next replot.
Parameters: - axisId (int) – Axis index
- min (float) – Minimum of the scale
- max (float) – Maximum of the scale
- stepSize (float) – Major step size. If <code>step == 0</code>, the step size is calculated automatically using the maxMajor setting.
-
QwtPlot.setAxisScaleDiv(axisId, scaleDiv)[source]¶ Disable autoscaling and specify a fixed scale for a selected axis.
The scale division will be stored locally only until the next call of updateAxes(). So updates of the scale widget usually happen delayed with the next replot.
Parameters: - axisId (int) – Axis index
- scaleDiv (qwt.scale_div.QwtScaleDiv) – Scale division
See also
-
QwtPlot.setAxisScaleDraw(axisId, scaleDraw)[source]¶ Set a scale draw
Parameters: - axisId (int) – Axis index
- scaleDraw (qwt.scale_draw.QwtScaleDraw) – Object responsible for drawing scales.
By passing scaleDraw it is possible to extend QwtScaleDraw functionality and let it take place in QwtPlot. Please note that scaleDraw has to be created with new and will be deleted by the corresponding QwtScale member ( like a child object ).
See also
qwt.scale_draw.QwtScaleDraw,qwt.scale_widget.QwtScaleWigdetWarning
The attributes of scaleDraw will be overwritten by those of the previous QwtScaleDraw.
-
QwtPlot.setAxisLabelAlignment(axisId, alignment)[source]¶ Change the alignment of the tick labels
Parameters: - axisId (int) – Axis index
- alignment (Qt.Alignment) – Or’d Qt.AlignmentFlags
-
QwtPlot.setAxisLabelRotation(axisId, rotation)[source]¶ Rotate all tick labels
Parameters: - axisId (int) – Axis index
- rotation (float) – Angle in degrees. When changing the label rotation, the label alignment might be adjusted too.
See also
setLabelRotation(),setAxisLabelAlignment()
-
QwtPlot.setAxisMaxMinor(axisId, maxMinor)[source]¶ Set the maximum number of minor scale intervals for a specified axis
Parameters: - axisId (int) – Axis index
- maxMinor (int) – Maximum number of minor steps
See also
-
QwtPlot.setAxisMaxMajor(axisId, maxMajor)[source]¶ Set the maximum number of major scale intervals for a specified axis
Parameters: - axisId (int) – Axis index
- maxMajor (int) – Maximum number of major steps
See also
-
QwtPlot.setAxisTitle(axisId, title)[source]¶ Change the title of a specified axis
Parameters: - axisId (int) – Axis index
- title (qwt.text.QwtText or str) – axis title
-
QwtPlot.updateAxes()[source]¶ Rebuild the axes scales
In case of autoscaling the boundaries of a scale are calculated from the bounding rectangles of all plot items, having the QwtPlotItem.AutoScale flag enabled (QwtScaleEngine.autoScale()). Then a scale division is calculated (QwtScaleEngine.didvideScale()) and assigned to scale widget.
When the scale boundaries have been assigned with setAxisScale() a scale division is calculated (QwtScaleEngine.didvideScale()) for this interval and assigned to the scale widget.
When the scale has been set explicitly by setAxisScaleDiv() the locally stored scale division gets assigned to the scale widget.
The scale widget indicates modifications by emitting a QwtScaleWidget.scaleDivChanged() signal.
updateAxes() is usually called by replot().
-
QwtPlot.setCanvas(canvas)[source]¶ Set the drawing canvas of the plot widget.
The default canvas is a QwtPlotCanvas.
Parameters: canvas (QWidget) – Canvas Widget See also
-
QwtPlot.autoRefresh()[source]¶ Replots the plot if
autoReplot()is True.
-
QwtPlot.setAutoReplot(tf)[source]¶ Set or reset the autoReplot option
If the autoReplot option is set, the plot will be updated implicitly by manipulating member functions. Since this may be time-consuming, it is recommended to leave this option switched off and call
replot()explicitly if necessary.The autoReplot option is set to false by default, which means that the user has to call
replot()in order to make changes visible.Parameters: tf (bool) – True or False. Defaults to True. See also
-
QwtPlot.setTitle(title)[source]¶ Change the plot’s title
Parameters: title (str or qwt.text.QwtText) – New title See also
Change the text the footer
Parameters: text (str or qwt.text.QwtText) – New text of the footer See also
Returns: Text of the footer See also
Returns: Footer label widget.
-
QwtPlot.setPlotLayout(layout)[source]¶ Assign a new plot layout
Parameters: layout (qwt.plot_layout.QwtPlotLayout) – Layout See also
-
QwtPlot.replot()[source]¶ Redraw the plot
If the autoReplot option is not set (which is the default) or if any curves are attached to raw data, the plot has to be refreshed explicitly in order to make changes visible.
See also
-
QwtPlot.getCanvasMarginsHint(maps, canvasRect)[source]¶ Calculate the canvas margins
Parameters: - maps (list) – QwtPlot.axisCnt maps, mapping between plot and paint device coordinates
- canvasRect (QRectF) – Bounding rectangle where to paint
Plot items might indicate, that they need some extra space at the borders of the canvas by the QwtPlotItem.Margins flag.
See also
updateCanvasMargins(),getCanvasMarginHint()
-
QwtPlot.updateCanvasMargins()[source]¶ Update the canvas margins
Plot items might indicate, that they need some extra space at the borders of the canvas by the QwtPlotItem.Margins flag.
-
QwtPlot.drawCanvas(painter)[source]¶ Redraw the canvas.
Parameters: painter (QPainter) – Painter used for drawing Warning
drawCanvas calls drawItems what is also used for printing. Applications that like to add individual plot items better overload drawItems()
-
QwtPlot.drawItems(painter, canvasRect, maps)[source]¶ Redraw the canvas.
Parameters: - painter (QPainter) – Painter used for drawing
- canvasRect (QRectF) – Bounding rectangle where to paint
- maps (list) – QwtPlot.axisCnt maps, mapping between plot and paint device coordinates
Note
Usually canvasRect is contentsRect() of the plot canvas. Due to a bug in Qt this rectangle might be wrong for certain frame styles ( f.e QFrame.Box ) and it might be necessary to fix the margins manually using QWidget.setContentsMargins()
-
QwtPlot.canvasMap(axisId)[source]¶ Parameters: axisId (int) – Axis Returns: Map for the axis on the canvas. With this map pixel coordinates can translated to plot coordinates and vice versa. See also
qwt.scale_map.QwtScaleMap,transform(),invTransform()
-
QwtPlot.setCanvasBackground(brush)[source]¶ Change the background of the plotting area
Sets brush to QPalette.Window of all color groups of the palette of the canvas. Using canvas().setPalette() is a more powerful way to set these colors.
Parameters: brush (QBrush) – New background brush See also
-
QwtPlot.axisValid(axisId)[source]¶ Parameters: axisId (int) – Axis Returns: True if the specified axis exists, otherwise False
-
QwtPlot.insertLegend(legend, pos=None, ratio=-1)[source]¶ Insert a legend
If the position legend is QwtPlot.LeftLegend or QwtPlot.RightLegend the legend will be organized in one column from top to down. Otherwise the legend items will be placed in a table with a best fit number of columns from left to right.
insertLegend() will set the plot widget as parent for the legend. The legend will be deleted in the destructor of the plot or when another legend is inserted.
Legends, that are not inserted into the layout of the plot widget need to connect to the legendDataChanged() signal. Calling updateLegend() initiates this signal for an initial update. When the application code wants to implement its own layout this also needs to be done for rendering plots to a document ( see QwtPlotRenderer ).
Parameters: - legend (qwt.legend.QwtAbstractLegend) – Legend
- pos (QwtPlot.LegendPosition) – The legend’s position.
- ratio (float) – Ratio between legend and the bounding rectangle of title, canvas and axes
Note
For top/left position the number of columns will be limited to 1, otherwise it will be set to unlimited.
Note
The legend will be shrunk if it would need more space than the given ratio. The ratio is limited to ]0.0 .. 1.0]. In case of <= 0.0 it will be reset to the default ratio. The default vertical/horizontal ratio is 0.33/0.5.
-
QwtPlot.updateLegend(plotItem=None)[source]¶ If plotItem is None, emit QwtPlot.SIG_LEGEND_DATA_CHANGED for all plot item. Otherwise, emit the signal for passed plot item.
Parameters: plotItem (qwt.plot.QwtPlotItem) – Plot item See also
QwtPlotItem.legendData(),QwtPlot.SIG_LEGEND_DATA_CHANGED
-
QwtPlot.updateLegendItems(plotItem, legendData)[source]¶ Update all plot items interested in legend attributes
Call QwtPlotItem.updateLegend(), when the QwtPlotItem.LegendInterest flag is set.
Parameters: - plotItem (qwt.plot.QwtPlotItem) – Plot item
- legendData (list) – Entries to be displayed for the plot item ( usually 1 )
See also
QwtPlotItem.LegendInterest(),QwtPlotItem.updateLegend()
-
QwtPlot.attachItem(plotItem, on)[source]¶ Attach/Detach a plot item
Parameters: - plotItem (qwt.plot.QwtPlotItem) – Plot item
- on (bool) – When true attach the item, otherwise detach it
-
QwtPlot.print_(printer)[source]¶ Print plot to printer
Parameters: printer (QPaintDevice or QPrinter or QSvgGenerator) – Printer
-
QwtPlot.exportTo(filename, size=(800, 600), size_mm=None, resolution=72.0, format_=None)[source]¶ Export plot to PDF or image file (SVG, PNG, ...)
Parameters: - filename (str) – Filename
- size (tuple) – (width, height) size in pixels
- size_mm (tuple) – (width, height) size in millimeters
- resolution (float) – Image resolution
- format (str) – File format (PDF, SVG, PNG, ...)
-
class
QwtPlotItem
-
class
qwt.plot.QwtPlotItem(title=None)[source]¶ Base class for items on the plot canvas
A plot item is “something”, that can be painted on the plot canvas, or only affects the scales of the plot widget. They can be categorized as:
Representator
A “Representator” is an item that represents some sort of data on the plot canvas. The different representator classes are organized according to the characteristics of the data:
qwt.plot_marker.QwtPlotMarker: Represents a point or a horizontal/vertical coordinateqwt.plot_curve.QwtPlotCurve: Represents a series of points
Decorators
A “Decorator” is an item, that displays additional information, that is not related to any data:
Depending on the QwtPlotItem.ItemAttribute flags, an item is included into autoscaling or has an entry on the legend.
Before misusing the existing item classes it might be better to implement a new type of plot item ( don’t implement a watermark as spectrogram ). Deriving a new type of QwtPlotItem primarily means to implement the YourPlotItem.draw() method.
See also
The cpuplot example shows the implementation of additional plot items.
-
class
QwtPlotItem([title=None])¶ Constructor
Parameters: title (qwt.text.QwtText or str) – Title of the item
-
QwtPlotItem.attach(plot)[source]¶ Attach the item to a plot.
This method will attach a QwtPlotItem to the QwtPlot argument. It will first detach the QwtPlotItem from any plot from a previous call to attach (if necessary). If a None argument is passed, it will detach from any QwtPlot it was attached to.
Parameters: plot (qwt.plot.QwtPlot) – Plot widget See also
-
QwtPlotItem.detach()[source]¶ Detach the item from a plot.
This method detaches a QwtPlotItem from any QwtPlot it has been associated with.
See also
-
QwtPlotItem.rtti()[source]¶ Return rtti for the specific class represented. QwtPlotItem is simply a virtual interface class, and base classes will implement this method with specific rtti values so a user can differentiate them.
Returns: rtti value
-
QwtPlotItem.z()[source]¶ Plot items are painted in increasing z-order.
Returns: item z order See also
-
QwtPlotItem.setZ(z)[source]¶ Set the z value
Plot items are painted in increasing z-order.
Parameters: z (float) – Z-value See also
-
QwtPlotItem.setTitle(title)[source]¶ Set a new title
Parameters: title (qwt.text.QwtText or str) – Title See also
-
QwtPlotItem.setItemAttribute(attribute, on=True)[source]¶ Toggle an item attribute
Parameters: - attribute (int) – Attribute type
- on (bool) – True/False
See also
-
QwtPlotItem.testItemAttribute(attribute)[source]¶ Test an item attribute
Parameters: attribute (int) – Attribute type Returns: True/False See also
-
QwtPlotItem.setItemInterest(interest, on)[source]¶ Toggle an item interest
Parameters: - attribute (int) – Interest type
- on (bool) – True/False
See also
-
QwtPlotItem.testItemInterest(interest)[source]¶ Test an item interest
Parameters: attribute (int) – Interest type Returns: True/False See also
-
QwtPlotItem.setRenderHint(hint, on=True)[source]¶ Toggle a render hint
Parameters: - hint (int) – Render hint
- on (bool) – True/False
See also
-
QwtPlotItem.testRenderHint(hint)[source]¶ Test a render hint
Parameters: attribute (int) – Render hint Returns: True/False See also
-
QwtPlotItem.setLegendIconSize(size)[source]¶ Set the size of the legend icon
The default setting is 8x8 pixels
Parameters: size (QSize) – Size See also
-
QwtPlotItem.legendIcon(index, size)[source]¶ Parameters: - index (int) – Index of the legend entry (usually there is only one)
- size (QSizeF) – Icon size
Returns: Icon representing the item on the legend
The default implementation returns an invalid icon
See also
-
QwtPlotItem.defaultIcon(brush, size)[source]¶ Return a default icon from a brush
The default icon is a filled rectangle used in several derived classes as legendIcon().
Parameters: - brush (QBrush) – Fill brush
- size (QSizeF) – Icon size
Returns: A filled rectangle
-
QwtPlotItem.setVisible(on)[source]¶ Show/Hide the item
Parameters: on (bool) – Show if True, otherwise hide See also
-
QwtPlotItem.itemChanged()[source]¶ Update the legend and call QwtPlot.autoRefresh() for the parent plot.
See also
QwtPlot.legendChanged(),QwtPlot.autoRefresh()
-
QwtPlotItem.setAxes(xAxis, yAxis)[source]¶ Set X and Y axis
The item will painted according to the coordinates of its Axes.
Parameters: - xAxis (int) – X Axis (QwtPlot.xBottom or QwtPlot.xTop)
- yAxis (int) – Y Axis (QwtPlot.yLeft or QwtPlot.yRight)
See also
-
QwtPlotItem.setAxis(xAxis, yAxis)[source]¶ Set X and Y axis
Warning
setAxis has been removed in Qwt6: please use
setAxes()instead
-
QwtPlotItem.setXAxis(axis)[source]¶ Set the X axis
The item will painted according to the coordinates its Axes.
Parameters: axis (int) – X Axis (QwtPlot.xBottom or QwtPlot.xTop) See also
-
QwtPlotItem.setYAxis(axis)[source]¶ Set the Y axis
The item will painted according to the coordinates its Axes.
Parameters: axis (int) – Y Axis (QwtPlot.yLeft or QwtPlot.yRight) See also
-
QwtPlotItem.boundingRect()[source]¶ Returns: An invalid bounding rect: QRectF(1.0, 1.0, -2.0, -2.0) Note
A width or height < 0.0 is ignored by the autoscaler
-
QwtPlotItem.getCanvasMarginHint(xMap, yMap, canvasRect)[source]¶ Calculate a hint for the canvas margin
When the QwtPlotItem::Margins flag is enabled the plot item indicates, that it needs some margins at the borders of the canvas. This is f.e. used by bar charts to reserve space for displaying the bars.
The margins are in target device coordinates ( pixels on screen )
Parameters: - xMap (qwt.scale_map.QwtScaleMap) – Maps x-values into pixel coordinates.
- yMap (qwt.scale_map.QwtScaleMap) – Maps y-values into pixel coordinates.
- canvasRect (QRectF) – Contents rectangle of the canvas in painter coordinates
-
QwtPlotItem.legendData()[source]¶ Return all information, that is needed to represent the item on the legend
QwtLegendData is basically a list of QVariants that makes it possible to overload and reimplement legendData() to return almost any type of information, that is understood by the receiver that acts as the legend.
The default implementation returns one entry with the title() of the item and the legendIcon().
Returns: Data, that is needed to represent the item on the legend See also
-
QwtPlotItem.updateLegend(item, data)[source]¶ Update the item to changes of the legend info
Plot items that want to display a legend ( not those, that want to be displayed on a legend ! ) will have to implement updateLegend().
updateLegend() is only called when the LegendInterest interest is enabled. The default implementation does nothing.
Parameters: - item (qwt.plot.QwtPlotItem) – Plot item to be displayed on a legend
- data (list) – Attributes how to display item on the legend
Note
Plot items, that want to be displayed on a legend need to enable the QwtPlotItem.Legend flag and to implement legendData() and legendIcon()
-
QwtPlotItem.scaleRect(xMap, yMap)[source]¶ Calculate the bounding scale rectangle of 2 maps
Parameters: - xMap (qwt.scale_map.QwtScaleMap) – Maps x-values into pixel coordinates.
- yMap (qwt.scale_map.QwtScaleMap) – Maps y-values into pixel coordinates.
Returns: Bounding scale rect of the scale maps, not normalized
-
QwtPlotItem.paintRect(xMap, yMap)[source]¶ Calculate the bounding paint rectangle of 2 maps
Parameters: - xMap (qwt.scale_map.QwtScaleMap) – Maps x-values into pixel coordinates.
- yMap (qwt.scale_map.QwtScaleMap) – Maps y-values into pixel coordinates.
Returns: Bounding paint rectangle of the scale maps, not normalized
-
class
qwt.plot.QwtPlotDict[source]¶ A dictionary for plot items
QwtPlotDict organizes plot items in increasing z-order. If autoDelete() is enabled, all attached items will be deleted in the destructor of the dictionary. QwtPlotDict can be used to get access to all QwtPlotItem items - or all items of a specific type - that are currently on the plot.
-
setAutoDelete(autoDelete)[source]¶ En/Disable Auto deletion
If Auto deletion is on all attached plot items will be deleted in the destructor of QwtPlotDict. The default value is on.
Parameters: autoDelete (bool) – enable/disable See also
-
insertItem(item)[source]¶ Insert a plot item
Parameters: item (qwt.plot.QwtPlotItem) – PlotItem See also
-
removeItem(item)[source]¶ Remove a plot item
Parameters: item (qwt.plot.QwtPlotItem) – PlotItem See also
-
detachItems(rtti, autoDelete)[source]¶ Detach items from the dictionary
Parameters: - rtti (int) – In case of QwtPlotItem.Rtti_PlotItem detach all items otherwise only those items of the type rtti.
- autoDelete (bool) – If true, delete all detached items
-
itemList(rtti=None)[source]¶ A list of attached plot items.
Use caution when iterating these lists, as removing/detaching an item will invalidate the iterator. Instead you can place pointers to objects to be removed in a removal list, and traverse that list later.
Parameters: rtti (int) – In case of QwtPlotItem.Rtti_PlotItem detach all items otherwise only those items of the type rtti. Returns: List of all attached plot items of a specific type. If rtti is None, return a list of all attached plot items.
-
-
class
qwt.plot.QwtPlot(*args)[source] A 2-D plotting widget
QwtPlot is a widget for plotting two-dimensional graphs. An unlimited number of plot items can be displayed on its canvas. Plot items might be curves (
qwt.plot_curve.QwtPlotCurve), markers (qwt.plot_marker.QwtPlotMarker), the grid (qwt.plot_grid.QwtPlotGrid), or anything else derived fromQwtPlotItem.A plot can have up to four axes, with each plot item attached to an x- and a y axis. The scales at the axes can be explicitly set (QwtScaleDiv), or are calculated from the plot items, using algorithms (QwtScaleEngine) which can be configured separately for each axis.
The following example is a good starting point to see how to set up a plot widget:
from qwt.qt.QtGui import QApplication
from qwt import QwtPlot, QwtPlotCurve
import numpy as np

app = QApplication([])

x = np.linspace(-10, 10, 500)
y1, y2 = np.cos(x), np.sin(x)

my_plot = QwtPlot("Two curves")
curve1, curve2 = QwtPlotCurve("Curve 1"), QwtPlotCurve("Curve 2")
curve1.setData(x, y1)
curve2.setData(x, y2)
curve1.attach(my_plot)
curve2.attach(my_plot)
my_plot.resize(600, 300)
my_plot.replot()
my_plot.show()

app.exec_()
-
class
QwtPlot([title=""][, parent=None]) Parameters: - title (str) – Title text
- parent (QWidget) – Parent widget
-
QwtPlot.initAxesData()[source] Initialize axes
-
QwtPlot.axisWidget(axisId)[source] Parameters: axisId (int) – Axis index Returns: Scale widget of the specified axis, or None if axisId is invalid.
-
QwtPlot.setAxisScaleEngine(axisId, scaleEngine)[source] Change the scale engine for an axis
Parameters: - axisId (int) – Axis index
- scaleEngine (qwt.scale_engine.QwtScaleEngine) – Scale engine
See also
-
QwtPlot.axisScaleEngine(axisId)[source] Parameters: axisId (int) – Axis index Returns: Scale engine for a specific axis See also
-
QwtPlot.axisAutoScale(axisId)[source] Parameters: axisId (int) – Axis index Returns: True, if autoscaling is enabled
-
QwtPlot.axisEnabled(axisId)[source] Parameters: axisId (int) – Axis index Returns: True, if a specified axis is enabled
-
QwtPlot.axisFont(axisId)[source] Parameters: axisId (int) – Axis index Returns: The font of the scale labels for a specified axis
-
QwtPlot.axisMaxMajor(axisId)[source] Parameters: axisId (int) – Axis index Returns: The maximum number of major ticks for a specified axis
-
QwtPlot.axisMaxMinor(axisId)[source] Parameters: axisId (int) – Axis index Returns: The maximum number of minor ticks for a specified axis
-
QwtPlot.axisScaleDiv(axisId)[source] Parameters: axisId (int) – Axis index Returns: The scale division of a specified axis axisScaleDiv(axisId).lowerBound(), axisScaleDiv(axisId).upperBound() are the current limits of the axis scale.
-
QwtPlot.axisScaleDraw(axisId)[source] Parameters: axisId (int) – Axis index Returns: Specified scaleDraw for axis, or NULL if axis is invalid.
-
QwtPlot.axisStepSize(axisId)[source] Parameters: axisId (int) – Axis index Returns: step size parameter value This doesn’t need to be the step size of the current scale.
-
QwtPlot.axisInterval(axisId)[source] Parameters: axisId (int) – Axis index Returns: The current interval of the specified axis This is only a convenience function for axisScaleDiv(axisId).interval()
See also
-
QwtPlot.axisTitle(axisId)[source] Parameters: axisId (int) – Axis index Returns: Title of a specified axis
-
QwtPlot.enableAxis(axisId, tf=True)[source] Enable or disable a specified axis
When an axis is disabled, this only means that it is not visible on the screen. Curves, markers and can be attached to disabled axes, and transformation of screen coordinates into values works as normal.
Only xBottom and yLeft are enabled by default.
Parameters: - axisId (int) – Axis index
- tf (bool) – True (enabled) or False (disabled)
-
QwtPlot.invTransform(axisId, pos)[source] Transform the x or y coordinate of a position in the drawing region into a value.
Parameters: - axisId (int) – Axis index
- pos (int) – position
Warning
The position can be an x or a y coordinate, depending on the specified axis.
-
QwtPlot.transform(axisId, value)[source] Transform a value into a coordinate in the plotting region
Parameters: - axisId (int) – Axis index
- value (fload) – Value
Returns: X or Y coordinate in the plotting region corresponding to the value.
-
QwtPlot.setAxisFont(axisId, font)[source] Change the font of an axis
Parameters: - axisId (int) – Axis index
- font (QFont) – Font
Warning
This function changes the font of the tick labels, not of the axis title.
-
QwtPlot.setAxisAutoScale(axisId, on)[source] Enable autoscaling for a specified axis
This member function is used to switch back to autoscaling mode after a fixed scale has been set. Autoscaling is enabled by default.
Parameters: - axisId (int) – Axis index
- on (bool) – On/Off
See also
Note
The autoscaling flag has no effect until updateAxes() is executed ( called by replot() ).
-
QwtPlot.setAxisScale(axisId, min_, max_, stepSize=0)[source] Disable autoscaling and specify a fixed scale for a selected axis.
In updateAxes() the scale engine calculates a scale division from the specified parameters, that will be assigned to the scale widget. So updates of the scale widget usually happen delayed with the next replot.
Parameters: - axisId (int) – Axis index
- min (float) – Minimum of the scale
- max (float) – Maximum of the scale
- stepSize (float) – Major step size. If <code>step == 0</code>, the step size is calculated automatically using the maxMajor setting.
-
QwtPlot.setAxisScaleDiv(axisId, scaleDiv)[source] Disable autoscaling and specify a fixed scale for a selected axis.
The scale division will be stored locally only until the next call of updateAxes(). So updates of the scale widget usually happen delayed with the next replot.
Parameters: - axisId (int) – Axis index
- scaleDiv (qwt.scale_div.QwtScaleDiv) – Scale division
See also
-
QwtPlot.setAxisScaleDraw(axisId, scaleDraw)[source] Set a scale draw
Parameters: - axisId (int) – Axis index
- scaleDraw (qwt.scale_draw.QwtScaleDraw) – Object responsible for drawing scales.
By passing scaleDraw it is possible to extend QwtScaleDraw functionality and let it take place in QwtPlot. Please note that scaleDraw has to be created with new and will be deleted by the corresponding QwtScale member ( like a child object ).
See also
qwt.scale_draw.QwtScaleDraw,qwt.scale_widget.QwtScaleWigdetWarning
The attributes of scaleDraw will be overwritten by those of the previous QwtScaleDraw.
-
QwtPlot.setAxisLabelAlignment(axisId, alignment)[source] Change the alignment of the tick labels
Parameters: - axisId (int) – Axis index
- alignment (Qt.Alignment) – Or’d Qt.AlignmentFlags
-
QwtPlot.setAxisLabelRotation(axisId, rotation)[source] Rotate all tick labels
Parameters: - axisId (int) – Axis index
- rotation (float) – Angle in degrees. When changing the label rotation, the label alignment might be adjusted too.
See also
setLabelRotation(),setAxisLabelAlignment()
-
QwtPlot.setAxisMaxMinor(axisId, maxMinor)[source] Set the maximum number of minor scale intervals for a specified axis
Parameters: - axisId (int) – Axis index
- maxMinor (int) – Maximum number of minor steps
See also
-
QwtPlot.setAxisMaxMajor(axisId, maxMajor)[source] Set the maximum number of major scale intervals for a specified axis
Parameters: - axisId (int) – Axis index
- maxMajor (int) – Maximum number of major steps
See also
-
QwtPlot.setAxisTitle(axisId, title)[source] Change the title of a specified axis
Parameters: - axisId (int) – Axis index
- title (qwt.text.QwtText or str) – axis title
-
QwtPlot.updateAxes()[source] Rebuild the axes scales
In case of autoscaling the boundaries of a scale are calculated from the bounding rectangles of all plot items, having the QwtPlotItem.AutoScale flag enabled (QwtScaleEngine.autoScale()). Then a scale division is calculated (QwtScaleEngine.didvideScale()) and assigned to scale widget.
When the scale boundaries have been assigned with setAxisScale() a scale division is calculated (QwtScaleEngine.didvideScale()) for this interval and assigned to the scale widget.
When the scale has been set explicitly by setAxisScaleDiv() the locally stored scale division gets assigned to the scale widget.
The scale widget indicates modifications by emitting a QwtScaleWidget.scaleDivChanged() signal.
updateAxes() is usually called by replot().
-
QwtPlot.setCanvas(canvas)[source] Set the drawing canvas of the plot widget.
The default canvas is a QwtPlotCanvas.
Parameters: canvas (QWidget) – Canvas Widget See also
-
QwtPlot.autoRefresh()[source] Replots the plot if
autoReplot()is True.
-
QwtPlot.setAutoReplot(tf)[source] Set or reset the autoReplot option
If the autoReplot option is set, the plot will be updated implicitly by manipulating member functions. Since this may be time-consuming, it is recommended to leave this option switched off and call
replot()explicitly if necessary.The autoReplot option is set to false by default, which means that the user has to call
replot()in order to make changes visible.Parameters: tf (bool) – True or False. Defaults to True. See also
-
QwtPlot.autoReplot()[source] Returns: True if the autoReplot option is set. See also
-
QwtPlot.setTitle(title)[source] Change the plot’s title
Parameters: title (str or qwt.text.QwtText) – New title See also
-
QwtPlot.title()[source] Returns: Title of the plot See also
-
QwtPlot.titleLabel()[source] Returns: Title label widget.
-
QwtPlot.setFooter(text)[source] Change the text the footer
Parameters: text (str or qwt.text.QwtText) – New text of the footer See also
-
QwtPlot.footer()[source] Returns: Text of the footer See also
-
QwtPlot.footerLabel()[source] Returns: Footer label widget.
-
QwtPlot.setPlotLayout(layout)[source] Assign a new plot layout
Parameters: layout (qwt.plot_layout.QwtPlotLayout) – Layout See also
-
QwtPlot.plotLayout()[source] Returns: the plot’s layout See also
-
QwtPlot.legend()[source] Returns: the plot’s legend See also
-
QwtPlot.canvas()[source] Returns: the plot’s canvas
-
QwtPlot.sizeHint()[source] Returns: Size hint for the plot widget See also
-
QwtPlot.minimumSizeHint()[source] Returns: Return a minimum size hint
-
QwtPlot.replot()[source] Redraw the plot
If the autoReplot option is not set (which is the default) or if any curves are attached to raw data, the plot has to be refreshed explicitly in order to make changes visible.
See also
-
QwtPlot.updateLayout()[source] Adjust plot content to its current size.
See also
resizeEvent()
-
QwtPlot.getCanvasMarginsHint(maps, canvasRect)[source] Calculate the canvas margins
Parameters: - maps (list) – QwtPlot.axisCnt maps, mapping between plot and paint device coordinates
- canvasRect (QRectF) – Bounding rectangle where to paint
Plot items might indicate, that they need some extra space at the borders of the canvas by the QwtPlotItem.Margins flag.
See also
updateCanvasMargins(),getCanvasMarginHint()
-
QwtPlot.updateCanvasMargins()[source] Update the canvas margins
Plot items might indicate, that they need some extra space at the borders of the canvas by the QwtPlotItem.Margins flag.
-
QwtPlot.drawCanvas(painter)[source] Redraw the canvas.
Parameters: painter (QPainter) – Painter used for drawing Warning
drawCanvas calls drawItems what is also used for printing. Applications that like to add individual plot items better overload drawItems()
-
QwtPlot.drawItems(painter, canvasRect, maps)[source] Redraw the canvas.
Parameters: - painter (QPainter) – Painter used for drawing
- canvasRect (QRectF) – Bounding rectangle where to paint
- maps (list) – QwtPlot.axisCnt maps, mapping between plot and paint device coordinates
Note
Usually canvasRect is contentsRect() of the plot canvas. Due to a bug in Qt this rectangle might be wrong for certain frame styles ( f.e QFrame.Box ) and it might be necessary to fix the margins manually using QWidget.setContentsMargins()
-
QwtPlot.canvasMap(axisId)[source] Parameters: axisId (int) – Axis Returns: Map for the axis on the canvas. With this map pixel coordinates can translated to plot coordinates and vice versa. See also
qwt.scale_map.QwtScaleMap,transform(),invTransform()
-
QwtPlot.setCanvasBackground(brush)[source] Change the background of the plotting area
Sets brush to QPalette.Window of all color groups of the palette of the canvas. Using canvas().setPalette() is a more powerful way to set these colors.
Parameters: brush (QBrush) – New background brush See also
-
QwtPlot.canvasBackground()[source] Returns: Background brush of the plotting area. See also
-
QwtPlot.axisValid(axisId)[source] Parameters: axisId (int) – Axis Returns: True if the specified axis exists, otherwise False
-
QwtPlot.insertLegend(legend, pos=None, ratio=-1)[source] Insert a legend
If the position legend is QwtPlot.LeftLegend or QwtPlot.RightLegend the legend will be organized in one column from top to down. Otherwise the legend items will be placed in a table with a best fit number of columns from left to right.
insertLegend() will set the plot widget as parent for the legend. The legend will be deleted in the destructor of the plot or when another legend is inserted.
Legends, that are not inserted into the layout of the plot widget need to connect to the legendDataChanged() signal. Calling updateLegend() initiates this signal for an initial update. When the application code wants to implement its own layout this also needs to be done for rendering plots to a document ( see QwtPlotRenderer ).
Parameters: - legend (qwt.legend.QwtAbstractLegend) – Legend
- pos (QwtPlot.LegendPosition) – The legend’s position.
- ratio (float) – Ratio between legend and the bounding rectangle of title, canvas and axes
Note
For top/left position the number of columns will be limited to 1, otherwise it will be set to unlimited.
Note
The legend will be shrunk if it would need more space than the given ratio. The ratio is limited to ]0.0 .. 1.0]. In case of <= 0.0 it will be reset to the default ratio. The default vertical/horizontal ratio is 0.33/0.5.
-
QwtPlot.updateLegend(plotItem=None)[source] If plotItem is None, emit QwtPlot.SIG_LEGEND_DATA_CHANGED for all plot item. Otherwise, emit the signal for passed plot item.
Parameters: plotItem (qwt.plot.QwtPlotItem) – Plot item See also
QwtPlotItem.legendData(),QwtPlot.SIG_LEGEND_DATA_CHANGED
-
QwtPlot.updateLegendItems(plotItem, legendData)[source] Update all plot items interested in legend attributes
Call QwtPlotItem.updateLegend(), when the QwtPlotItem.LegendInterest flag is set.
Parameters: - plotItem (qwt.plot.QwtPlotItem) – Plot item
- legendData (list) – Entries to be displayed for the plot item ( usually 1 )
See also
QwtPlotItem.LegendInterest(),QwtPlotItem.updateLegend()
-
QwtPlot.attachItem(plotItem, on)[source] Attach/Detach a plot item
Parameters: - plotItem (qwt.plot.QwtPlotItem) – Plot item
- on (bool) – When true attach the item, otherwise detach it
-
QwtPlot.print_(printer)[source] Print plot to printer
Parameters: printer (QPaintDevice or QPrinter or QSvgGenerator) – Printer
-
QwtPlot.exportTo(filename, size=(800, 600), size_mm=None, resolution=72.0, format_=None)[source] Export plot to PDF or image file (SVG, PNG, ...)
Parameters: - filename (str) – Filename
- size (tuple) – (width, height) size in pixels
- size_mm (tuple) – (width, height) size in millimeters
- resolution (float) – Image resolution
- format (str) – File format (PDF, SVG, PNG, ...)
-
class
-
class
qwt.plot.QwtPlotItem(title=None)[source] Base class for items on the plot canvas
A plot item is “something”, that can be painted on the plot canvas, or only affects the scales of the plot widget. They can be categorized as:
Representator
A “Representator” is an item that represents some sort of data on the plot canvas. The different representator classes are organized according to the characteristics of the data:
qwt.plot_marker.QwtPlotMarker: Represents a point or a horizontal/vertical coordinateqwt.plot_curve.QwtPlotCurve: Represents a series of points
Decorators
A “Decorator” is an item, that displays additional information, that is not related to any data:
Depending on the QwtPlotItem.ItemAttribute flags, an item is included into autoscaling or has an entry on the legend.
Before misusing the existing item classes it might be better to implement a new type of plot item ( don’t implement a watermark as spectrogram ). Deriving a new type of QwtPlotItem primarily means to implement the YourPlotItem.draw() method.
See also
The cpuplot example shows the implementation of additional plot items.
-
class
QwtPlotItem([title=None]) Constructor
Parameters: title (qwt.text.QwtText or str) – Title of the item
-
QwtPlotItem.attach(plot)[source] Attach the item to a plot.
This method will attach a QwtPlotItem to the QwtPlot argument. It will first detach the QwtPlotItem from any plot from a previous call to attach (if necessary). If a None argument is passed, it will detach from any QwtPlot it was attached to.
Parameters: plot (qwt.plot.QwtPlot) – Plot widget See also
-
QwtPlotItem.detach()[source] Detach the item from a plot.
This method detaches a QwtPlotItem from any QwtPlot it has been associated with.
See also
-
QwtPlotItem.rtti()[source] Return rtti for the specific class represented. QwtPlotItem is simply a virtual interface class, and base classes will implement this method with specific rtti values so a user can differentiate them.
Returns: rtti value
-
QwtPlotItem.plot()[source] Returns: attached plot
-
QwtPlotItem.z()[source] Plot items are painted in increasing z-order.
Returns: item z order See also
-
QwtPlotItem.setZ(z)[source] Set the z value
Plot items are painted in increasing z-order.
Parameters: z (float) – Z-value See also
-
QwtPlotItem.setTitle(title)[source] Set a new title
Parameters: title (qwt.text.QwtText or str) – Title See also
-
QwtPlotItem.title()[source] Returns: Title of the item See also
-
QwtPlotItem.setItemAttribute(attribute, on=True)[source] Toggle an item attribute
Parameters: - attribute (int) – Attribute type
- on (bool) – True/False
See also
-
QwtPlotItem.testItemAttribute(attribute)[source] Test an item attribute
Parameters: attribute (int) – Attribute type Returns: True/False See also
-
QwtPlotItem.setItemInterest(interest, on)[source] Toggle an item interest
Parameters: - attribute (int) – Interest type
- on (bool) – True/False
See also
-
QwtPlotItem.testItemInterest(interest)[source] Test an item interest
Parameters: attribute (int) – Interest type Returns: True/False See also
-
QwtPlotItem.setRenderHint(hint, on=True)[source] Toggle a render hint
Parameters: - hint (int) – Render hint
- on (bool) – True/False
See also
-
QwtPlotItem.testRenderHint(hint)[source] Test a render hint
Parameters: attribute (int) – Render hint Returns: True/False See also
-
QwtPlotItem.setLegendIconSize(size)[source] Set the size of the legend icon
The default setting is 8x8 pixels
Parameters: size (QSize) – Size See also
-
QwtPlotItem.legendIconSize()[source] Returns: Legend icon size See also
-
QwtPlotItem.legendIcon(index, size)[source] Parameters: - index (int) – Index of the legend entry (usually there is only one)
- size (QSizeF) – Icon size
Returns: Icon representing the item on the legend
The default implementation returns an invalid icon
See also
-
QwtPlotItem.defaultIcon(brush, size)[source] Return a default icon from a brush
The default icon is a filled rectangle used in several derived classes as legendIcon().
Parameters: - brush (QBrush) – Fill brush
- size (QSizeF) – Icon size
Returns: A filled rectangle
-
QwtPlotItem.show()[source] Show the item
-
QwtPlotItem.hide()[source] Hide the item
-
QwtPlotItem.setVisible(on)[source] Show/Hide the item
Parameters: on (bool) – Show if True, otherwise hide See also
-
QwtPlotItem.isVisible()[source] Returns: True if visible See also
-
QwtPlotItem.itemChanged()[source] Update the legend and call QwtPlot.autoRefresh() for the parent plot.
See also
QwtPlot.legendChanged(),QwtPlot.autoRefresh()
-
QwtPlotItem.legendChanged()[source] Update the legend of the parent plot.
See also
-
QwtPlotItem.setAxes(xAxis, yAxis)[source] Set X and Y axis
The item will painted according to the coordinates of its Axes.
Parameters: - xAxis (int) – X Axis (QwtPlot.xBottom or QwtPlot.xTop)
- yAxis (int) – Y Axis (QwtPlot.yLeft or QwtPlot.yRight)
See also
-
QwtPlotItem.setAxis(xAxis, yAxis)[source] Set X and Y axis
Warning
setAxis has been removed in Qwt6: please use
setAxes()instead
-
QwtPlotItem.setXAxis(axis)[source] Set the X axis
The item will painted according to the coordinates its Axes.
Parameters: axis (int) – X Axis (QwtPlot.xBottom or QwtPlot.xTop) See also
-
QwtPlotItem.setYAxis(axis)[source] Set the Y axis
The item will painted according to the coordinates its Axes.
Parameters: axis (int) – Y Axis (QwtPlot.yLeft or QwtPlot.yRight) See also
-
QwtPlotItem.xAxis()[source] Returns: xAxis
-
QwtPlotItem.yAxis()[source] Returns: yAxis
-
QwtPlotItem.boundingRect()[source] Returns: An invalid bounding rect: QRectF(1.0, 1.0, -2.0, -2.0) Note
A width or height < 0.0 is ignored by the autoscaler
-
QwtPlotItem.getCanvasMarginHint(xMap, yMap, canvasRect)[source] Calculate a hint for the canvas margin
When the QwtPlotItem::Margins flag is enabled the plot item indicates, that it needs some margins at the borders of the canvas. This is f.e. used by bar charts to reserve space for displaying the bars.
The margins are in target device coordinates ( pixels on screen )
Parameters: - xMap (qwt.scale_map.QwtScaleMap) – Maps x-values into pixel coordinates.
- yMap (qwt.scale_map.QwtScaleMap) – Maps y-values into pixel coordinates.
- canvasRect (QRectF) – Contents rectangle of the canvas in painter coordinates
-
QwtPlotItem.legendData()[source] Return all information, that is needed to represent the item on the legend
QwtLegendData is basically a list of QVariants that makes it possible to overload and reimplement legendData() to return almost any type of information, that is understood by the receiver that acts as the legend.
The default implementation returns one entry with the title() of the item and the legendIcon().
Returns: Data, that is needed to represent the item on the legend See also
-
QwtPlotItem.updateLegend(item, data)[source] Update the item to changes of the legend info
Plot items that want to display a legend ( not those, that want to be displayed on a legend ! ) will have to implement updateLegend().
updateLegend() is only called when the LegendInterest interest is enabled. The default implementation does nothing.
Parameters: - item (qwt.plot.QwtPlotItem) – Plot item to be displayed on a legend
- data (list) – Attributes how to display item on the legend
Note
Plot items, that want to be displayed on a legend need to enable the QwtPlotItem.Legend flag and to implement legendData() and legendIcon()
-
QwtPlotItem.scaleRect(xMap, yMap)[source] Calculate the bounding scale rectangle of 2 maps
Parameters: - xMap (qwt.scale_map.QwtScaleMap) – Maps x-values into pixel coordinates.
- yMap (qwt.scale_map.QwtScaleMap) – Maps y-values into pixel coordinates.
Returns: Bounding scale rect of the scale maps, not normalized
-
QwtPlotItem.paintRect(xMap, yMap)[source] Calculate the bounding paint rectangle of 2 maps
Parameters: - xMap (qwt.scale_map.QwtScaleMap) – Maps x-values into pixel coordinates.
- yMap (qwt.scale_map.QwtScaleMap) – Maps y-values into pixel coordinates.
Returns: Bounding paint rectangle of the scale maps, not normalized
QwtPlotCanvas
-
class
qwt.plot_canvas.QwtPlotCanvas(plot=None)[source]¶ Canvas of a QwtPlot.
Canvas is the widget where all plot items are displayed
See also
Paint attributes:
QwtPlotCanvas.BackingStore:
Paint double buffered reusing the content of the pixmap buffer when possible.
Using a backing store might improve the performance significantly, when working with widget overlays (like rubber bands). Disabling the cache might improve the performance for incremental paints (using
qwt.plot_directpainter.QwtPlotDirectPainter).QwtPlotCanvas.Opaque:
Try to fill the complete contents rectangle of the plot canvas
When using styled backgrounds Qt assumes, that the canvas doesn’t fill its area completely (f.e because of rounded borders) and fills the area below the canvas. When this is done with gradients it might result in a serious performance bottleneck - depending on the size.
When the Opaque attribute is enabled the canvas tries to identify the gaps with some heuristics and to fill those only.
Warning
Will not work for semitransparent backgrounds
QwtPlotCanvas.HackStyledBackground:
Try to improve painting of styled backgrounds
QwtPlotCanvas supports the box model attributes for customizing the layout with style sheets. Unfortunately the design of Qt style sheets has no concept how to handle backgrounds with rounded corners - beside of padding.
When HackStyledBackground is enabled the plot canvas tries to separate the background from the background border by reverse engineering to paint the background before and the border after the plot items. In this order the border gets perfectly antialiased and you can avoid some pixel artifacts in the corners.
QwtPlotCanvas.ImmediatePaint:
When ImmediatePaint is set replot() calls repaint() instead of update().
See also
replot(),QWidget.repaint(),QWidget.update()
Focus indicators:
QwtPlotCanvas.NoFocusIndicator:
Don’t paint a focus indicator
QwtPlotCanvas.CanvasFocusIndicator:
The focus is related to the complete canvas. Paint the focus indicator using paintFocus()
QwtPlotCanvas.ItemFocusIndicator:
The focus is related to an item (curve, point, ...) on the canvas. It is up to the application to display a focus indication using f.e. highlighting.
-
class
QwtPlotCanvas([plot=None])¶ Constructor
Parameters: plot (qwt.plot.QwtPlot) – Parent plot widget See also
-
QwtPlotCanvas.setPaintAttribute(attribute, on=True)[source]¶ Changing the paint attributes
Paint attributes:
- QwtPlotCanvas.BackingStore
- QwtPlotCanvas.Opaque
- QwtPlotCanvas.HackStyledBackground
- QwtPlotCanvas.ImmediatePaint
Parameters: - attribute (int) – Paint attribute
- on (bool) – On/Off
See also
-
QwtPlotCanvas.testPaintAttribute(attribute)[source]¶ Test whether a paint attribute is enabled
Parameters: attribute (int) – Paint attribute Returns: True, when attribute is enabled See also
-
QwtPlotCanvas.setFocusIndicator(focusIndicator)[source]¶ Set the focus indicator
Focus indicators:
- QwtPlotCanvas.NoFocusIndicator
- QwtPlotCanvas.CanvasFocusIndicator
- QwtPlotCanvas.ItemFocusIndicator
Parameters: focusIndicator (int) – Focus indicator See also
-
QwtPlotCanvas.setBorderRadius(radius)[source]¶ Set the radius for the corners of the border frame
Parameters: radius (float) – Radius of a rounded corner See also
-
QwtPlotCanvas.drawBorder(painter)[source]¶ Draw the border of the plot canvas
Parameters: painter (QPainter) – Painter See also
-
QwtPlotCanvas.drawFocusIndicator(painter)[source]¶ Draw the focus indication
Parameters: painter (QPainter) – Painter
-
class
qwt.plot_canvas.QwtPlotCanvas(plot=None)[source] Canvas of a QwtPlot.
Canvas is the widget where all plot items are displayed
See also
Paint attributes:
QwtPlotCanvas.BackingStore:
Paint double buffered reusing the content of the pixmap buffer when possible.
Using a backing store might improve the performance significantly, when working with widget overlays (like rubber bands). Disabling the cache might improve the performance for incremental paints (using
qwt.plot_directpainter.QwtPlotDirectPainter).QwtPlotCanvas.Opaque:
Try to fill the complete contents rectangle of the plot canvas
When using styled backgrounds Qt assumes, that the canvas doesn’t fill its area completely (f.e because of rounded borders) and fills the area below the canvas. When this is done with gradients it might result in a serious performance bottleneck - depending on the size.
When the Opaque attribute is enabled the canvas tries to identify the gaps with some heuristics and to fill those only.
Warning
Will not work for semitransparent backgrounds
QwtPlotCanvas.HackStyledBackground:
Try to improve painting of styled backgrounds
QwtPlotCanvas supports the box model attributes for customizing the layout with style sheets. Unfortunately the design of Qt style sheets has no concept how to handle backgrounds with rounded corners - beside of padding.
When HackStyledBackground is enabled the plot canvas tries to separate the background from the background border by reverse engineering to paint the background before and the border after the plot items. In this order the border gets perfectly antialiased and you can avoid some pixel artifacts in the corners.
QwtPlotCanvas.ImmediatePaint:
When ImmediatePaint is set replot() calls repaint() instead of update().
See also
replot(),QWidget.repaint(),QWidget.update()
Focus indicators:
QwtPlotCanvas.NoFocusIndicator:
Don’t paint a focus indicator
QwtPlotCanvas.CanvasFocusIndicator:
The focus is related to the complete canvas. Paint the focus indicator using paintFocus()
QwtPlotCanvas.ItemFocusIndicator:
The focus is related to an item (curve, point, ...) on the canvas. It is up to the application to display a focus indication using f.e. highlighting.
-
class
QwtPlotCanvas([plot=None]) Constructor
Parameters: plot (qwt.plot.QwtPlot) – Parent plot widget See also
-
QwtPlotCanvas.plot()[source] Returns: Parent plot widget
-
QwtPlotCanvas.setPaintAttribute(attribute, on=True)[source] Changing the paint attributes
Paint attributes:
- QwtPlotCanvas.BackingStore
- QwtPlotCanvas.Opaque
- QwtPlotCanvas.HackStyledBackground
- QwtPlotCanvas.ImmediatePaint
Parameters: - attribute (int) – Paint attribute
- on (bool) – On/Off
See also
-
QwtPlotCanvas.testPaintAttribute(attribute)[source] Test whether a paint attribute is enabled
Parameters: attribute (int) – Paint attribute Returns: True, when attribute is enabled See also
-
QwtPlotCanvas.backingStore()[source] Returns: Backing store, might be None
-
QwtPlotCanvas.invalidateBackingStore()[source] Invalidate the internal backing store
-
QwtPlotCanvas.setFocusIndicator(focusIndicator)[source] Set the focus indicator
Focus indicators:
- QwtPlotCanvas.NoFocusIndicator
- QwtPlotCanvas.CanvasFocusIndicator
- QwtPlotCanvas.ItemFocusIndicator
Parameters: focusIndicator (int) – Focus indicator See also
-
QwtPlotCanvas.focusIndicator()[source] Returns: Focus indicator See also
-
QwtPlotCanvas.setBorderRadius(radius)[source] Set the radius for the corners of the border frame
Parameters: radius (float) – Radius of a rounded corner See also
-
QwtPlotCanvas.borderRadius()[source] Returns: Radius for the corners of the border frame See also
-
QwtPlotCanvas.drawBorder(painter)[source] Draw the border of the plot canvas
Parameters: painter (QPainter) – Painter See also
-
QwtPlotCanvas.drawFocusIndicator(painter)[source] Draw the focus indication
Parameters: painter (QPainter) – Painter
-
QwtPlotCanvas.replot()[source] Invalidate the paint cache and repaint the canvas
-
QwtPlotCanvas.updateStyleSheetInfo()[source] Update the cached information about the current style sheet
-
QwtPlotCanvas.borderPath(rect)[source] Calculate the painter path for a styled or rounded border
When the canvas has no styled background or rounded borders the painter path is empty.
Parameters: rect (QRect) – Bounding rectangle of the canvas Returns: Painter path, that can be used for clipping
Plot items
QwtPlotGrid
-
class
qwt.plot_grid.QwtPlotGrid[source]¶ A class which draws a coordinate grid
The QwtPlotGrid class can be used to draw a coordinate grid. A coordinate grid consists of major and minor vertical and horizontal grid lines. The locations of the grid lines are determined by the X and Y scale divisions which can be assigned with setXDiv() and setYDiv(). The draw() member draws the grid within a bounding rectangle.
-
enableX(on)[source]¶ Enable or disable vertical grid lines
Parameters: on (bool) – Enable (true) or disable See also
-
enableY(on)[source]¶ Enable or disable horizontal grid lines
Parameters: on (bool) – Enable (true) or disable See also
-
enableXMin(on)[source]¶ Enable or disable minor vertical grid lines.
Parameters: on (bool) – Enable (true) or disable See also
-
enableYMin(on)[source]¶ Enable or disable minor horizontal grid lines.
Parameters: on (bool) – Enable (true) or disable See also
-
setXDiv(scaleDiv)[source]¶ Assign an x axis scale division
Parameters: scaleDiv (qwt.scale_div.QwtScaleDiv) – Scale division
-
setYDiv(scaleDiv)[source]¶ Assign an y axis scale division
Parameters: scaleDiv (qwt.scale_div.QwtScaleDiv) – Scale division
-
setPen(*args)[source]¶ Build and/or assign a pen for both major and minor grid lines
-
setPen(color, width, style)[source] Build and assign a pen for both major and minor grid lines
In Qt5 the default pen width is 1.0 ( 0.0 in Qt4 ) what makes it non cosmetic (see QPen.isCosmetic()). This method signature has been introduced to hide this incompatibility.
Parameters: - color (QColor) – Pen color
- width (float) – Pen width
- style (Qt.PenStyle) – Pen style
-
setPen(pen)[source] Assign a pen for both major and minor grid lines
Parameters: pen (QPen) – New pen
See also
pen(),brush()-
-
setMajorPen(*args)[source]¶ Build and/or assign a pen for both major grid lines
-
setMajorPen(color, width, style)[source] Build and assign a pen for both major grid lines
In Qt5 the default pen width is 1.0 ( 0.0 in Qt4 ) what makes it non cosmetic (see QPen.isCosmetic()). This method signature has been introduced to hide this incompatibility.
Parameters: - color (QColor) – Pen color
- width (float) – Pen width
- style (Qt.PenStyle) – Pen style
-
setMajorPen(pen)[source] Assign a pen for the major grid lines
Parameters: pen (QPen) – New pen
See also
majorPen(),setMinorPen(),setPen(),pen(),brush()-
-
setMinorPen(*args)[source]¶ Build and/or assign a pen for both minor grid lines
-
setMinorPen(color, width, style)[source] Build and assign a pen for both minor grid lines
In Qt5 the default pen width is 1.0 ( 0.0 in Qt4 ) what makes it non cosmetic (see QPen.isCosmetic()). This method signature has been introduced to hide this incompatibility.
Parameters: - color (QColor) – Pen color
- width (float) – Pen width
- style (Qt.PenStyle) – Pen style
-
setMinorPen(pen)[source] Assign a pen for the minor grid lines
Parameters: pen (QPen) – New pen
See also
minorPen(),setMajorPen(),setPen(),pen(),brush()-
-
draw(painter, xMap, yMap, canvasRect)[source]¶ Draw the grid
The grid is drawn into the bounding rectangle such that grid lines begin and end at the rectangle’s borders. The X and Y maps are used to map the scale divisions into the drawing region screen.
Parameters: - painter (QPainter) – Painter
- xMap (qwt.scale_map.QwtScaleMap) – X axis map
- yMap (qwt.scale_map.QwtScaleMap) – Y axis
- canvasRect (QRectF) – Contents rectangle of the plot canvas
-
-
class
qwt.plot_grid.QwtPlotGrid[source] A class which draws a coordinate grid
The QwtPlotGrid class can be used to draw a coordinate grid. A coordinate grid consists of major and minor vertical and horizontal grid lines. The locations of the grid lines are determined by the X and Y scale divisions which can be assigned with setXDiv() and setYDiv(). The draw() member draws the grid within a bounding rectangle.
-
rtti()[source] Returns: Return QwtPlotItem.Rtti_PlotGrid
-
enableX(on)[source] Enable or disable vertical grid lines
Parameters: on (bool) – Enable (true) or disable See also
-
enableY(on)[source] Enable or disable horizontal grid lines
Parameters: on (bool) – Enable (true) or disable See also
-
enableXMin(on)[source] Enable or disable minor vertical grid lines.
Parameters: on (bool) – Enable (true) or disable See also
-
enableYMin(on)[source] Enable or disable minor horizontal grid lines.
Parameters: on (bool) – Enable (true) or disable See also
-
setXDiv(scaleDiv)[source] Assign an x axis scale division
Parameters: scaleDiv (qwt.scale_div.QwtScaleDiv) – Scale division
-
setYDiv(scaleDiv)[source] Assign an y axis scale division
Parameters: scaleDiv (qwt.scale_div.QwtScaleDiv) – Scale division
-
setPen(*args)[source] Build and/or assign a pen for both major and minor grid lines
-
setPen(color, width, style)[source] Build and assign a pen for both major and minor grid lines
In Qt5 the default pen width is 1.0 ( 0.0 in Qt4 ) what makes it non cosmetic (see QPen.isCosmetic()). This method signature has been introduced to hide this incompatibility.
Parameters: - color (QColor) – Pen color
- width (float) – Pen width
- style (Qt.PenStyle) – Pen style
-
setPen(pen)[source] Assign a pen for both major and minor grid lines
Parameters: pen (QPen) – New pen
See also
pen(),brush()-
-
setMajorPen(*args)[source] Build and/or assign a pen for both major grid lines
-
setMajorPen(color, width, style)[source] Build and assign a pen for both major grid lines
In Qt5 the default pen width is 1.0 ( 0.0 in Qt4 ) what makes it non cosmetic (see QPen.isCosmetic()). This method signature has been introduced to hide this incompatibility.
Parameters: - color (QColor) – Pen color
- width (float) – Pen width
- style (Qt.PenStyle) – Pen style
-
setMajorPen(pen)[source] Assign a pen for the major grid lines
Parameters: pen (QPen) – New pen
See also
majorPen(),setMinorPen(),setPen(),pen(),brush()-
-
setMinorPen(*args)[source] Build and/or assign a pen for both minor grid lines
-
setMinorPen(color, width, style)[source] Build and assign a pen for both minor grid lines
In Qt5 the default pen width is 1.0 ( 0.0 in Qt4 ) what makes it non cosmetic (see QPen.isCosmetic()). This method signature has been introduced to hide this incompatibility.
Parameters: - color (QColor) – Pen color
- width (float) – Pen width
- style (Qt.PenStyle) – Pen style
-
setMinorPen(pen)[source] Assign a pen for the minor grid lines
Parameters: pen (QPen) – New pen
See also
minorPen(),setMajorPen(),setPen(),pen(),brush()-
-
draw(painter, xMap, yMap, canvasRect)[source] Draw the grid
The grid is drawn into the bounding rectangle such that grid lines begin and end at the rectangle’s borders. The X and Y maps are used to map the scale divisions into the drawing region screen.
Parameters: - painter (QPainter) – Painter
- xMap (qwt.scale_map.QwtScaleMap) – X axis map
- yMap (qwt.scale_map.QwtScaleMap) – Y axis
- canvasRect (QRectF) – Contents rectangle of the plot canvas
-
majorPen()[source] Returns: the pen for the major grid lines See also
-
minorPen()[source] Returns: the pen for the minor grid lines See also
-
xMinEnabled()[source] Returns: True if minor vertical grid lines are enabled See also
-
yMinEnabled()[source] Returns: True if minor horizontal grid lines are enabled See also
-
xScaleDiv()[source] Returns: the scale division of the x axis
-
yScaleDiv()[source] Returns: the scale division of the y axis
-
updateScaleDiv(xScaleDiv, yScaleDiv)[source] Update the grid to changes of the axes scale division
Parameters: - xMap (qwt.scale_map.QwtScaleMap) – Scale division of the x-axis
- yMap (qwt.scale_map.QwtScaleMap) – Scale division of the y-axis
See also
updateAxes()
-
QwtPlotCurve
-
class
qwt.plot_curve.QwtPlotCurve(title=None)[source]¶ A plot item, that represents a series of points
A curve is the representation of a series of points in the x-y plane. It supports different display styles, interpolation ( f.e. spline ) and symbols.
See also
qwt.symbol.QwtSymbol(),qwt.scale_map.QwtScaleMap()Curve styles:
QwtPlotCurve.NoCurve:
Don’t draw a curve. Note: This doesn’t affect the symbols.
QwtPlotCurve.Lines:
Connect the points with straight lines. The lines might be interpolated depending on the ‘Fitted’ attribute. Curve fitting can be configured using setCurveFitter().
QwtPlotCurve.Sticks:
Draw vertical or horizontal sticks ( depending on the orientation() ) from a baseline which is defined by setBaseline().
QwtPlotCurve.Steps:
Connect the points with a step function. The step function is drawn from the left to the right or vice versa, depending on the QwtPlotCurve::Inverted attribute.
QwtPlotCurve.Dots:
Draw dots at the locations of the data points. Note: This is different from a dotted line (see setPen()), and faster as a curve in QwtPlotCurve::NoStyle style and a symbol painting a point.
QwtPlotCurve.UserCurve:
Styles >= QwtPlotCurve.UserCurve are reserved for derived classes of QwtPlotCurve that overload drawCurve() with additional application specific curve types.
Curve attributes:
QwtPlotCurve.Inverted:
For QwtPlotCurve.Steps only. Draws a step function from the right to the left.
QwtPlotCurve.Fitted:
Warning
This option is not supported in python-qwt.
Legend attributes:
QwtPlotCurve.LegendNoAttribute:
QwtPlotCurve tries to find a color representing the curve and paints a rectangle with it.
QwtPlotCurve.LegendShowLine:
If the style() is not QwtPlotCurve.NoCurve a line is painted with the curve pen().
QwtPlotCurve.LegendShowSymbol:
If the curve has a valid symbol it is painted.
QwtPlotCurve.LegendShowBrush:
If the curve has a brush a rectangle filled with the curve brush() is painted.
Paint attributes:
QwtPlotCurve.ClipPolygons:
Clip polygons before painting them. In situations, where points are far outside the visible area (f.e when zooming deep) this might be a substantial improvement for the painting performance
Warning
This option is currently not supported in python-qwt.
QwtPlotCurve.FilterPoints:
Tries to reduce the data that has to be painted, by sorting out duplicates, or paintings outside the visible area. Might have a notable impact on curves with many close points. Only a couple of very basic filtering algorithms are implemented.
QwtPlotCurve.MinimizeMemory:
Warning
This option was removed as it has no sense in python-qwt (the polyline plotting is not taking more memory than the array data that is already there).
QwtPlotCurve.ImageBuffer:
Render the points to a temporary image and paint the image. This is a very special optimization for Dots style, when having a huge amount of points. With a reasonable number of points QPainter.drawPoints() will be faster.
-
class
QwtPlotCurve([title=None])¶ Constructor
Parameters: title (qwt.text.QwtText or str or None) – Curve title
-
QwtPlotCurve.setPaintAttribute(attribute, on=True)[source]¶ Specify an attribute how to draw the curve
Supported paint attributes:
- QwtPlotCurve.FilterPoints
- QwtPlotCurve.ImageBuffer
Parameters: - attribute (int) – Paint attribute
- on (bool) – On/Off
See also
-
QwtPlotCurve.testPaintAttribute(attribute)[source]¶ Parameters: attribute (int) – Paint attribute Returns: True, when attribute is enabled See also
-
QwtPlotCurve.setLegendAttribute(attribute, on=True)[source]¶ Specify an attribute how to draw the legend icon
Legend attributes:
- QwtPlotCurve.LegendNoAttribute
- QwtPlotCurve.LegendShowLine
- QwtPlotCurve.LegendShowSymbol
- QwtPlotCurve.LegendShowBrush
Parameters: - attribute (int) – Legend attribute
- on (bool) – On/Off
See also
-
QwtPlotCurve.testLegendAttribute(attribute)[source]¶ Parameters: attribute (int) – Legend attribute Returns: True, when attribute is enabled See also
-
QwtPlotCurve.setStyle(style)[source]¶ Set the curve’s drawing style
Valid curve styles:
- QwtPlotCurve.NoCurve
- QwtPlotCurve.Lines
- QwtPlotCurve.Sticks
- QwtPlotCurve.Steps
- QwtPlotCurve.Dots
- QwtPlotCurve.UserCurve
Parameters: style (int) – Curve style See also
-
QwtPlotCurve.setSymbol(symbol)[source]¶ Assign a symbol
The curve will take the ownership of the symbol, hence the previously set symbol will be delete by setting a new one. If symbol is None no symbol will be drawn.
Parameters: symbol (qwt.symbol.QwtSymbol) – Symbol See also
-
QwtPlotCurve.symbol()[source]¶ Returns: Current symbol or None, when no symbol has been assigned See also
-
QwtPlotCurve.setPen(*args)[source]¶ Build and/or assign a pen, depending on the arguments.
-
setPen(color, width, style)[source] Build and assign a pen
In Qt5 the default pen width is 1.0 ( 0.0 in Qt4 ) what makes it non cosmetic (see QPen.isCosmetic()). This method signature has been introduced to hide this incompatibility.
Parameters: - color (QColor) – Pen color
- width (float) – Pen width
- style (Qt.PenStyle) – Pen style
-
setPen(pen)[source] Assign a pen
Parameters: pen (QPen) – New pen
-
-
QwtPlotCurve.setBrush(brush)[source]¶ Assign a brush.
In case of brush.style() != QBrush.NoBrush and style() != QwtPlotCurve.Sticks the area between the curve and the baseline will be filled.
In case not brush.color().isValid() the area will be filled by pen.color(). The fill algorithm simply connects the first and the last curve point to the baseline. So the curve data has to be sorted (ascending or descending).
Parameters: brush (QBrush or QColor) – New brush See also
-
QwtPlotCurve.brush()[source]¶ Returns: Brush used to fill the area between lines and the baseline See also
-
QwtPlotCurve.directPaint(from_, to)[source]¶ When observing a measurement while it is running, new points have to be added to an existing seriesItem. This method can be used to display them avoiding a complete redraw of the canvas.
Setting plot().canvas().setAttribute(Qt.WA_PaintOutsidePaintEvent, True) will result in faster painting, if the paint engine of the canvas widget supports this feature.
Parameters: - from (int) – Index of the first point to be painted
- to (int) – Index of the last point to be painted
See also
-
QwtPlotCurve.drawSeries(painter, xMap, yMap, canvasRect, from_, to)[source]¶ Draw an interval of the curve
Parameters: - painter (QPainter) – Painter
- xMap (qwt.scale_map.QwtScaleMap) – Maps x-values into pixel coordinates.
- yMap (qwt.scale_map.QwtScaleMap) – Maps y-values into pixel coordinates.
- canvasRect (QRectF) – Contents rectangle of the canvas
- from (int) – Index of the first point to be painted
- to (int) – Index of the last point to be painted. If to < 0 the curve will be painted to its last point.
See also
-
QwtPlotCurve.drawCurve(painter, style, xMap, yMap, canvasRect, from_, to)[source]¶ Draw the line part (without symbols) of a curve interval.
Parameters: - painter (QPainter) – Painter
- style (int) – curve style, see QwtPlotCurve.CurveStyle
- xMap (qwt.scale_map.QwtScaleMap) – Maps x-values into pixel coordinates.
- yMap (qwt.scale_map.QwtScaleMap) – Maps y-values into pixel coordinates.
- canvasRect (QRectF) – Contents rectangle of the canvas
- from (int) – Index of the first point to be painted
- to (int) – Index of the last point to be painted. If to < 0 the curve will be painted to its last point.
See also
draw(),drawDots(),drawLines(),drawSteps(),drawSticks()
-
QwtPlotCurve.drawLines(painter, xMap, yMap, canvasRect, from_, to)[source]¶ Draw lines
Parameters: - painter (QPainter) – Painter
- xMap (qwt.scale_map.QwtScaleMap) – Maps x-values into pixel coordinates.
- yMap (qwt.scale_map.QwtScaleMap) – Maps y-values into pixel coordinates.
- canvasRect (QRectF) – Contents rectangle of the canvas
- from (int) – Index of the first point to be painted
- to (int) – Index of the last point to be painted. If to < 0 the curve will be painted to its last point.
See also
draw(),drawDots(),drawSteps(),drawSticks()
-
QwtPlotCurve.drawSticks(painter, xMap, yMap, canvasRect, from_, to)[source]¶ Draw sticks
Parameters: - painter (QPainter) – Painter
- xMap (qwt.scale_map.QwtScaleMap) – Maps x-values into pixel coordinates.
- yMap (qwt.scale_map.QwtScaleMap) – Maps y-values into pixel coordinates.
- canvasRect (QRectF) – Contents rectangle of the canvas
- from (int) – Index of the first point to be painted
- to (int) – Index of the last point to be painted. If to < 0 the curve will be painted to its last point.
See also
draw(),drawDots(),drawSteps(),drawLines()
-
QwtPlotCurve.drawDots(painter, xMap, yMap, canvasRect, from_, to)[source]¶ Draw dots
Parameters: - painter (QPainter) – Painter
- xMap (qwt.scale_map.QwtScaleMap) – Maps x-values into pixel coordinates.
- yMap (qwt.scale_map.QwtScaleMap) – Maps y-values into pixel coordinates.
- canvasRect (QRectF) – Contents rectangle of the canvas
- from (int) – Index of the first point to be painted
- to (int) – Index of the last point to be painted. If to < 0 the curve will be painted to its last point.
See also
draw(),drawSticks(),drawSteps(),drawLines()
-
QwtPlotCurve.drawSteps(painter, xMap, yMap, canvasRect, from_, to)[source]¶ Draw steps
Parameters: - painter (QPainter) – Painter
- xMap (qwt.scale_map.QwtScaleMap) – Maps x-values into pixel coordinates.
- yMap (qwt.scale_map.QwtScaleMap) – Maps y-values into pixel coordinates.
- canvasRect (QRectF) – Contents rectangle of the canvas
- from (int) – Index of the first point to be painted
- to (int) – Index of the last point to be painted. If to < 0 the curve will be painted to its last point.
See also
draw(),drawSticks(),drawDots(),drawLines()
-
QwtPlotCurve.setCurveAttribute(attribute, on=True)[source]¶ Specify an attribute for drawing the curve
Supported curve attributes:
- QwtPlotCurve.Inverted
Parameters: - attribute (int) – Curve attribute
- on (bool) – On/Off
See also
-
QwtPlotCurve.fillCurve(painter, xMap, yMap, canvasRect, polygon)[source]¶ Fill the area between the curve and the baseline with the curve brush
Parameters: - painter (QPainter) – Painter
- xMap (qwt.scale_map.QwtScaleMap) – Maps x-values into pixel coordinates.
- yMap (qwt.scale_map.QwtScaleMap) – Maps y-values into pixel coordinates.
- canvasRect (QRectF) – Contents rectangle of the canvas
- polygon (QPolygonF) – Polygon - will be modified !
See also
-
QwtPlotCurve.closePolyline(painter, xMap, yMap, polygon)[source]¶ Complete a polygon to be a closed polygon including the area between the original polygon and the baseline.
Parameters: - painter (QPainter) – Painter
- xMap (qwt.scale_map.QwtScaleMap) – Maps x-values into pixel coordinates.
- yMap (qwt.scale_map.QwtScaleMap) – Maps y-values into pixel coordinates.
- polygon (QPolygonF) – Polygon to be completed
-
QwtPlotCurve.drawSymbols(painter, symbol, xMap, yMap, canvasRect, from_, to)[source]¶ Draw symbols
Parameters: - painter (QPainter) – Painter
- symbol (qwt.symbol.QwtSymbol) – Curve symbol
- xMap (qwt.scale_map.QwtScaleMap) – Maps x-values into pixel coordinates.
- yMap (qwt.scale_map.QwtScaleMap) – Maps y-values into pixel coordinates.
- canvasRect (QRectF) – Contents rectangle of the canvas
- from (int) – Index of the first point to be painted
- to (int) – Index of the last point to be painted. If to < 0 the curve will be painted to its last point.
See also
-
QwtPlotCurve.setBaseline(value)[source]¶ Set the value of the baseline
The baseline is needed for filling the curve with a brush or the Sticks drawing style.
The interpretation of the baseline depends on the orientation(). With Qt.Horizontal, the baseline is interpreted as a horizontal line at y = baseline(), with Qt.Vertical, it is interpreted as a vertical line at x = baseline().
The default value is 0.0.
Parameters: value (float) – Value of the baseline See also
-
QwtPlotCurve.closestPoint(pos)[source]¶ Find the closest curve point for a specific position
Parameters: pos (QPoint) – Position, where to look for the closest curve point Returns: tuple (index, dist) dist is the distance between the position and the closest curve point. index is the index of the closest curve point, or -1 if none can be found ( f.e when the curve has no points ).
Note
closestPoint() implements a dumb algorithm, that iterates over all points
-
QwtPlotCurve.legendIcon(index, size)[source]¶ Parameters: - index (int) – Index of the legend entry (ignored as there is only one)
- size (QSizeF) – Icon size
Returns: Icon representing the curve on the legend
-
QwtPlotCurve.setSamples(*args)[source]¶ Initialize data with an array of points.
-
setSamples(samples): Same as setData(QwtPointArrayData(samples))
Parameters: samples – List/array of points
-
setSamples(xData, yData, [size=None]): Same as setData(QwtPointArrayData(xData, yData, [size=None]))
Parameters: - xData – List/array of x values
- yData – List/array of y values
- size (int or None) – size of xData and yData
See also
qwt.point_data.QwtPointArrayData,-
-
class
qwt.plot_curve.QwtPlotCurve(title=None)[source] A plot item, that represents a series of points
A curve is the representation of a series of points in the x-y plane. It supports different display styles, interpolation ( f.e. spline ) and symbols.
See also
qwt.symbol.QwtSymbol(),qwt.scale_map.QwtScaleMap()Curve styles:
QwtPlotCurve.NoCurve:
Don’t draw a curve. Note: This doesn’t affect the symbols.
QwtPlotCurve.Lines:
Connect the points with straight lines. The lines might be interpolated depending on the ‘Fitted’ attribute. Curve fitting can be configured using setCurveFitter().
QwtPlotCurve.Sticks:
Draw vertical or horizontal sticks ( depending on the orientation() ) from a baseline which is defined by setBaseline().
QwtPlotCurve.Steps:
Connect the points with a step function. The step function is drawn from the left to the right or vice versa, depending on the QwtPlotCurve::Inverted attribute.
QwtPlotCurve.Dots:
Draw dots at the locations of the data points. Note: This is different from a dotted line (see setPen()), and faster as a curve in QwtPlotCurve::NoStyle style and a symbol painting a point.
QwtPlotCurve.UserCurve:
Styles >= QwtPlotCurve.UserCurve are reserved for derived classes of QwtPlotCurve that overload drawCurve() with additional application specific curve types.
Curve attributes:
QwtPlotCurve.Inverted:
For QwtPlotCurve.Steps only. Draws a step function from the right to the left.
QwtPlotCurve.Fitted:
Warning
This option is not supported in python-qwt.
Legend attributes:
QwtPlotCurve.LegendNoAttribute:
QwtPlotCurve tries to find a color representing the curve and paints a rectangle with it.
QwtPlotCurve.LegendShowLine:
If the style() is not QwtPlotCurve.NoCurve a line is painted with the curve pen().
QwtPlotCurve.LegendShowSymbol:
If the curve has a valid symbol it is painted.
QwtPlotCurve.LegendShowBrush:
If the curve has a brush a rectangle filled with the curve brush() is painted.
Paint attributes:
QwtPlotCurve.ClipPolygons:
Clip polygons before painting them. In situations, where points are far outside the visible area (f.e when zooming deep) this might be a substantial improvement for the painting performance
Warning
This option is currently not supported in python-qwt.
QwtPlotCurve.FilterPoints:
Tries to reduce the data that has to be painted, by sorting out duplicates, or paintings outside the visible area. Might have a notable impact on curves with many close points. Only a couple of very basic filtering algorithms are implemented.
QwtPlotCurve.MinimizeMemory:
Warning
This option was removed as it has no sense in python-qwt (the polyline plotting is not taking more memory than the array data that is already there).
QwtPlotCurve.ImageBuffer:
Render the points to a temporary image and paint the image. This is a very special optimization for Dots style, when having a huge amount of points. With a reasonable number of points QPainter.drawPoints() will be faster.
-
class
QwtPlotCurve([title=None]) Constructor
Parameters: title (qwt.text.QwtText or str or None) – Curve title
-
QwtPlotCurve.init()[source] Initialize internal members
-
QwtPlotCurve.rtti()[source] Returns: QwtPlotItem.Rtti_PlotCurve
-
QwtPlotCurve.setPaintAttribute(attribute, on=True)[source] Specify an attribute how to draw the curve
Supported paint attributes:
- QwtPlotCurve.FilterPoints
- QwtPlotCurve.ImageBuffer
Parameters: - attribute (int) – Paint attribute
- on (bool) – On/Off
See also
-
QwtPlotCurve.testPaintAttribute(attribute)[source] Parameters: attribute (int) – Paint attribute Returns: True, when attribute is enabled See also
-
QwtPlotCurve.setLegendAttribute(attribute, on=True)[source] Specify an attribute how to draw the legend icon
Legend attributes:
- QwtPlotCurve.LegendNoAttribute
- QwtPlotCurve.LegendShowLine
- QwtPlotCurve.LegendShowSymbol
- QwtPlotCurve.LegendShowBrush
Parameters: - attribute (int) – Legend attribute
- on (bool) – On/Off
See also
-
QwtPlotCurve.testLegendAttribute(attribute)[source] Parameters: attribute (int) – Legend attribute Returns: True, when attribute is enabled See also
-
QwtPlotCurve.setStyle(style)[source] Set the curve’s drawing style
Valid curve styles:
- QwtPlotCurve.NoCurve
- QwtPlotCurve.Lines
- QwtPlotCurve.Sticks
- QwtPlotCurve.Steps
- QwtPlotCurve.Dots
- QwtPlotCurve.UserCurve
Parameters: style (int) – Curve style See also
-
QwtPlotCurve.style()[source] Returns: Style of the curve See also
-
QwtPlotCurve.setSymbol(symbol)[source] Assign a symbol
The curve will take the ownership of the symbol, hence the previously set symbol will be delete by setting a new one. If symbol is None no symbol will be drawn.
Parameters: symbol (qwt.symbol.QwtSymbol) – Symbol See also
-
QwtPlotCurve.symbol()[source] Returns: Current symbol or None, when no symbol has been assigned See also
-
QwtPlotCurve.setPen(*args)[source] Build and/or assign a pen, depending on the arguments.
-
setPen(color, width, style)[source] Build and assign a pen
In Qt5 the default pen width is 1.0 ( 0.0 in Qt4 ) what makes it non cosmetic (see QPen.isCosmetic()). This method signature has been introduced to hide this incompatibility.
Parameters: - color (QColor) – Pen color
- width (float) – Pen width
- style (Qt.PenStyle) – Pen style
-
setPen(pen)[source] Assign a pen
Parameters: pen (QPen) – New pen
-
-
QwtPlotCurve.pen()[source] Returns: Pen used to draw the lines
-
QwtPlotCurve.setBrush(brush)[source] Assign a brush.
In case of brush.style() != QBrush.NoBrush and style() != QwtPlotCurve.Sticks the area between the curve and the baseline will be filled.
In case not brush.color().isValid() the area will be filled by pen.color(). The fill algorithm simply connects the first and the last curve point to the baseline. So the curve data has to be sorted (ascending or descending).
Parameters: brush (QBrush or QColor) – New brush See also
-
QwtPlotCurve.brush()[source] Returns: Brush used to fill the area between lines and the baseline See also
-
QwtPlotCurve.directPaint(from_, to)[source] When observing a measurement while it is running, new points have to be added to an existing seriesItem. This method can be used to display them avoiding a complete redraw of the canvas.
Setting plot().canvas().setAttribute(Qt.WA_PaintOutsidePaintEvent, True) will result in faster painting, if the paint engine of the canvas widget supports this feature.
Parameters: - from (int) – Index of the first point to be painted
- to (int) – Index of the last point to be painted
See also
-
QwtPlotCurve.drawSeries(painter, xMap, yMap, canvasRect, from_, to)[source] Draw an interval of the curve
Parameters: - painter (QPainter) – Painter
- xMap (qwt.scale_map.QwtScaleMap) – Maps x-values into pixel coordinates.
- yMap (qwt.scale_map.QwtScaleMap) – Maps y-values into pixel coordinates.
- canvasRect (QRectF) – Contents rectangle of the canvas
- from (int) – Index of the first point to be painted
- to (int) – Index of the last point to be painted. If to < 0 the curve will be painted to its last point.
See also
-
QwtPlotCurve.drawCurve(painter, style, xMap, yMap, canvasRect, from_, to)[source] Draw the line part (without symbols) of a curve interval.
Parameters: - painter (QPainter) – Painter
- style (int) – curve style, see QwtPlotCurve.CurveStyle
- xMap (qwt.scale_map.QwtScaleMap) – Maps x-values into pixel coordinates.
- yMap (qwt.scale_map.QwtScaleMap) – Maps y-values into pixel coordinates.
- canvasRect (QRectF) – Contents rectangle of the canvas
- from (int) – Index of the first point to be painted
- to (int) – Index of the last point to be painted. If to < 0 the curve will be painted to its last point.
See also
draw(),drawDots(),drawLines(),drawSteps(),drawSticks()
-
QwtPlotCurve.drawLines(painter, xMap, yMap, canvasRect, from_, to)[source] Draw lines
Parameters: - painter (QPainter) – Painter
- xMap (qwt.scale_map.QwtScaleMap) – Maps x-values into pixel coordinates.
- yMap (qwt.scale_map.QwtScaleMap) – Maps y-values into pixel coordinates.
- canvasRect (QRectF) – Contents rectangle of the canvas
- from (int) – Index of the first point to be painted
- to (int) – Index of the last point to be painted. If to < 0 the curve will be painted to its last point.
See also
draw(),drawDots(),drawSteps(),drawSticks()
-
QwtPlotCurve.drawSticks(painter, xMap, yMap, canvasRect, from_, to)[source] Draw sticks
Parameters: - painter (QPainter) – Painter
- xMap (qwt.scale_map.QwtScaleMap) – Maps x-values into pixel coordinates.
- yMap (qwt.scale_map.QwtScaleMap) – Maps y-values into pixel coordinates.
- canvasRect (QRectF) – Contents rectangle of the canvas
- from (int) – Index of the first point to be painted
- to (int) – Index of the last point to be painted. If to < 0 the curve will be painted to its last point.
See also
draw(),drawDots(),drawSteps(),drawLines()
-
QwtPlotCurve.drawDots(painter, xMap, yMap, canvasRect, from_, to)[source] Draw dots
Parameters: - painter (QPainter) – Painter
- xMap (qwt.scale_map.QwtScaleMap) – Maps x-values into pixel coordinates.
- yMap (qwt.scale_map.QwtScaleMap) – Maps y-values into pixel coordinates.
- canvasRect (QRectF) – Contents rectangle of the canvas
- from (int) – Index of the first point to be painted
- to (int) – Index of the last point to be painted. If to < 0 the curve will be painted to its last point.
See also
draw(),drawSticks(),drawSteps(),drawLines()
-
QwtPlotCurve.drawSteps(painter, xMap, yMap, canvasRect, from_, to)[source] Draw steps
Parameters: - painter (QPainter) – Painter
- xMap (qwt.scale_map.QwtScaleMap) – Maps x-values into pixel coordinates.
- yMap (qwt.scale_map.QwtScaleMap) – Maps y-values into pixel coordinates.
- canvasRect (QRectF) – Contents rectangle of the canvas
- from (int) – Index of the first point to be painted
- to (int) – Index of the last point to be painted. If to < 0 the curve will be painted to its last point.
See also
draw(),drawSticks(),drawDots(),drawLines()
-
QwtPlotCurve.setCurveAttribute(attribute, on=True)[source] Specify an attribute for drawing the curve
Supported curve attributes:
- QwtPlotCurve.Inverted
Parameters: - attribute (int) – Curve attribute
- on (bool) – On/Off
See also
-
QwtPlotCurve.testCurveAttribute(attribute)[source] Returns: True, if attribute is enabled See also
-
QwtPlotCurve.fillCurve(painter, xMap, yMap, canvasRect, polygon)[source] Fill the area between the curve and the baseline with the curve brush
Parameters: - painter (QPainter) – Painter
- xMap (qwt.scale_map.QwtScaleMap) – Maps x-values into pixel coordinates.
- yMap (qwt.scale_map.QwtScaleMap) – Maps y-values into pixel coordinates.
- canvasRect (QRectF) – Contents rectangle of the canvas
- polygon (QPolygonF) – Polygon - will be modified !
See also
-
QwtPlotCurve.closePolyline(painter, xMap, yMap, polygon)[source] Complete a polygon to be a closed polygon including the area between the original polygon and the baseline.
Parameters: - painter (QPainter) – Painter
- xMap (qwt.scale_map.QwtScaleMap) – Maps x-values into pixel coordinates.
- yMap (qwt.scale_map.QwtScaleMap) – Maps y-values into pixel coordinates.
- polygon (QPolygonF) – Polygon to be completed
-
QwtPlotCurve.drawSymbols(painter, symbol, xMap, yMap, canvasRect, from_, to)[source] Draw symbols
Parameters: - painter (QPainter) – Painter
- symbol (qwt.symbol.QwtSymbol) – Curve symbol
- xMap (qwt.scale_map.QwtScaleMap) – Maps x-values into pixel coordinates.
- yMap (qwt.scale_map.QwtScaleMap) – Maps y-values into pixel coordinates.
- canvasRect (QRectF) – Contents rectangle of the canvas
- from (int) – Index of the first point to be painted
- to (int) – Index of the last point to be painted. If to < 0 the curve will be painted to its last point.
See also
-
QwtPlotCurve.setBaseline(value)[source] Set the value of the baseline
The baseline is needed for filling the curve with a brush or the Sticks drawing style.
The interpretation of the baseline depends on the orientation(). With Qt.Horizontal, the baseline is interpreted as a horizontal line at y = baseline(), with Qt.Vertical, it is interpreted as a vertical line at x = baseline().
The default value is 0.0.
Parameters: value (float) – Value of the baseline See also
-
QwtPlotCurve.baseline()[source] Returns: Value of the baseline See also
-
QwtPlotCurve.closestPoint(pos)[source] Find the closest curve point for a specific position
Parameters: pos (QPoint) – Position, where to look for the closest curve point Returns: tuple (index, dist) dist is the distance between the position and the closest curve point. index is the index of the closest curve point, or -1 if none can be found ( f.e when the curve has no points ).
Note
closestPoint() implements a dumb algorithm, that iterates over all points
-
QwtPlotCurve.legendIcon(index, size)[source] Parameters: - index (int) – Index of the legend entry (ignored as there is only one)
- size (QSizeF) – Icon size
Returns: Icon representing the curve on the legend
-
QwtPlotCurve.setData(*args)[source] Compatibility with Qwt5
-
QwtPlotCurve.setSamples(*args)[source] Initialize data with an array of points.
-
setSamples(samples): Same as setData(QwtPointArrayData(samples))
Parameters: samples – List/array of points
-
setSamples(xData, yData, [size=None]): Same as setData(QwtPointArrayData(xData, yData, [size=None]))
Parameters: - xData – List/array of x values
- yData – List/array of y values
- size (int or None) – size of xData and yData
See also
qwt.point_data.QwtPointArrayData,-
QwtPlotMarker
-
class
qwt.plot_marker.QwtPlotMarker(title=None)[source]¶ A class for drawing markers
A marker can be a horizontal line, a vertical line, a symbol, a label or any combination of them, which can be drawn around a center point inside a bounding rectangle.
The setSymbol() member assigns a symbol to the marker. The symbol is drawn at the specified point.
With setLabel(), a label can be assigned to the marker. The setLabelAlignment() member specifies where the label is drawn. All the Align*-constants in Qt.AlignmentFlags (see Qt documentation) are valid. The interpretation of the alignment depends on the marker’s line style. The alignment refers to the center point of the marker, which means, for example, that the label would be printed left above the center point if the alignment was set to Qt.AlignLeft | Qt.AlignTop.
Line styles:
- QwtPlotMarker.NoLine: No line
- QwtPlotMarker.HLine: A horizontal line
- QwtPlotMarker.VLine: A vertical line
- QwtPlotMarker.Cross: A crosshair
-
setValue(*args)[source]¶ Set Value
-
setValue(pos): Parameters: pos (QPointF) – Position
-
setValue(x, y): Parameters: - x (float) – x position
- y (float) – y position
-
-
draw(painter, xMap, yMap, canvasRect)[source]¶ Draw the marker
Parameters: - painter (QPainter) – Painter
- xMap (qwt.scale_map.QwtScaleMap) – x Scale Map
- yMap (qwt.scale_map.QwtScaleMap) – y Scale Map
- canvasRect (QRectF) – Contents rectangle of the canvas in painter coordinates
-
drawLines(painter, canvasRect, pos)[source]¶ Draw the lines marker
Parameters: - painter (QPainter) – Painter
- canvasRect (QRectF) – Contents rectangle of the canvas in painter coordinates
- pos (QPointF) – Position of the marker, translated into widget coordinates
See also
-
drawLabel(painter, canvasRect, pos)[source]¶ Align and draw the text label of the marker
Parameters: - painter (QPainter) – Painter
- canvasRect (QRectF) – Contents rectangle of the canvas in painter coordinates
- pos (QPointF) – Position of the marker, translated into widget coordinates
See also
-
setLineStyle(style)[source]¶ Set the line style
Parameters: style (int) – Line style Line styles:
- QwtPlotMarker.NoLine: No line
- QwtPlotMarker.HLine: A horizontal line
- QwtPlotMarker.VLine: A vertical line
- QwtPlotMarker.Cross: A crosshair
See also
-
setSymbol(symbol)[source]¶ Assign a symbol
Parameters: symbol (qwt.symbol.QwtSymbol) – New symbol See also
-
setLabel(label)[source]¶ Set the label
Parameters: label (qwt.text.QwtText or str) – Label text See also
-
setLabelAlignment(align)[source]¶ Set the alignment of the label
In case of QwtPlotMarker.HLine the alignment is relative to the y position of the marker, but the horizontal flags correspond to the canvas rectangle. In case of QwtPlotMarker.VLine the alignment is relative to the x position of the marker, but the vertical flags correspond to the canvas rectangle.
In all other styles the alignment is relative to the marker’s position.
Parameters: align (Qt.Alignment) – Alignment See also
-
setLabelOrientation(orientation)[source]¶ Set the orientation of the label
When orientation is Qt.Vertical the label is rotated by 90.0 degrees (from bottom to top).
Parameters: orientation (Qt.Orientation) – Orientation of the label See also
-
setSpacing(spacing)[source]¶ Set the spacing
When the label is not centered on the marker position, the spacing is the distance between the position and the label.
Parameters: spacing (int) – Spacing See also
-
setLinePen(*args)[source]¶ Build and/or assigna a line pen, depending on the arguments.
-
setPen(color, width, style)¶ Build and assign a line pen
In Qt5 the default pen width is 1.0 ( 0.0 in Qt4 ) what makes it non cosmetic (see QPen.isCosmetic()). This method signature has been introduced to hide this incompatibility.
Parameters: - color (QColor) – Pen color
- width (float) – Pen width
- style (Qt.PenStyle) – Pen style
-
setPen(pen) Specify a pen for the line.
Parameters: pen (QPen) – New pen
See also
pen(),brush()-
-
class
qwt.plot_marker.QwtPlotMarker(title=None)[source] A class for drawing markers
A marker can be a horizontal line, a vertical line, a symbol, a label or any combination of them, which can be drawn around a center point inside a bounding rectangle.
The setSymbol() member assigns a symbol to the marker. The symbol is drawn at the specified point.
With setLabel(), a label can be assigned to the marker. The setLabelAlignment() member specifies where the label is drawn. All the Align*-constants in Qt.AlignmentFlags (see Qt documentation) are valid. The interpretation of the alignment depends on the marker’s line style. The alignment refers to the center point of the marker, which means, for example, that the label would be printed left above the center point if the alignment was set to Qt.AlignLeft | Qt.AlignTop.
Line styles:
- QwtPlotMarker.NoLine: No line
- QwtPlotMarker.HLine: A horizontal line
- QwtPlotMarker.VLine: A vertical line
- QwtPlotMarker.Cross: A crosshair
-
rtti()[source] Returns: QwtPlotItem.Rtti_PlotMarker
-
value()[source] Returns: Value
-
xValue()[source] Returns: x Value
-
yValue()[source] Returns: y Value
-
setValue(*args)[source] Set Value
-
setValue(pos): Parameters: pos (QPointF) – Position
-
setValue(x, y): Parameters: - x (float) – x position
- y (float) – y position
-
-
setXValue(x)[source] Set X Value
Parameters: x (float) – x position
-
setYValue(y)[source] Set Y Value
Parameters: y (float) – y position
-
draw(painter, xMap, yMap, canvasRect)[source] Draw the marker
Parameters: - painter (QPainter) – Painter
- xMap (qwt.scale_map.QwtScaleMap) – x Scale Map
- yMap (qwt.scale_map.QwtScaleMap) – y Scale Map
- canvasRect (QRectF) – Contents rectangle of the canvas in painter coordinates
-
drawLines(painter, canvasRect, pos)[source] Draw the lines marker
Parameters: - painter (QPainter) – Painter
- canvasRect (QRectF) – Contents rectangle of the canvas in painter coordinates
- pos (QPointF) – Position of the marker, translated into widget coordinates
See also
-
drawLabel(painter, canvasRect, pos)[source] Align and draw the text label of the marker
Parameters: - painter (QPainter) – Painter
- canvasRect (QRectF) – Contents rectangle of the canvas in painter coordinates
- pos (QPointF) – Position of the marker, translated into widget coordinates
See also
-
setLineStyle(style)[source] Set the line style
Parameters: style (int) – Line style Line styles:
- QwtPlotMarker.NoLine: No line
- QwtPlotMarker.HLine: A horizontal line
- QwtPlotMarker.VLine: A vertical line
- QwtPlotMarker.Cross: A crosshair
See also
-
lineStyle()[source] Returns: the line style See also
-
setSymbol(symbol)[source] Assign a symbol
Parameters: symbol (qwt.symbol.QwtSymbol) – New symbol See also
-
symbol()[source] Returns: the symbol See also
-
setLabel(label)[source] Set the label
Parameters: label (qwt.text.QwtText or str) – Label text See also
-
label()[source] Returns: the label See also
-
setLabelAlignment(align)[source] Set the alignment of the label
In case of QwtPlotMarker.HLine the alignment is relative to the y position of the marker, but the horizontal flags correspond to the canvas rectangle. In case of QwtPlotMarker.VLine the alignment is relative to the x position of the marker, but the vertical flags correspond to the canvas rectangle.
In all other styles the alignment is relative to the marker’s position.
Parameters: align (Qt.Alignment) – Alignment See also
-
labelAlignment()[source] Returns: the label alignment See also
-
setLabelOrientation(orientation)[source] Set the orientation of the label
When orientation is Qt.Vertical the label is rotated by 90.0 degrees (from bottom to top).
Parameters: orientation (Qt.Orientation) – Orientation of the label See also
-
labelOrientation()[source] Returns: the label orientation See also
-
setSpacing(spacing)[source] Set the spacing
When the label is not centered on the marker position, the spacing is the distance between the position and the label.
Parameters: spacing (int) – Spacing See also
-
spacing()[source] Returns: the spacing See also
-
setLinePen(*args)[source] Build and/or assigna a line pen, depending on the arguments.
-
setPen(color, width, style) Build and assign a line pen
In Qt5 the default pen width is 1.0 ( 0.0 in Qt4 ) what makes it non cosmetic (see QPen.isCosmetic()). This method signature has been introduced to hide this incompatibility.
Parameters: - color (QColor) – Pen color
- width (float) – Pen width
- style (Qt.PenStyle) – Pen style
-
setPen(pen) Specify a pen for the line.
Parameters: pen (QPen) – New pen
See also
pen(),brush()-
-
linePen()[source] Returns: the line pen See also
-
legendIcon(index, size)[source] Parameters: - index (int) – Index of the legend entry (ignored as there is only one)
- size (QSizeF) – Icon size
Returns: Icon representing the marker on the legend
Additional plot features
QwtLegend
-
class
qwt.legend.QwtLegend(parent=None)[source]¶ The legend widget
The QwtLegend widget is a tabular arrangement of legend items. Legend items might be any type of widget, but in general they will be a QwtLegendLabel.
See also
:py:class`qwt.legend_label.QwtLegendLabel`, :py:class`qwt.plot.QwtPlotItem`, :py:class`qwt.plot.QwtPlot`
-
class
QwtLegend([parent=None])¶ Constructor
Parameters: parent (QWidget) – Parent widget
-
QwtLegend.setMaxColumns(numColumns)[source]¶ Set the maximum number of entries in a row
F.e when the maximum is set to 1 all items are aligned vertically. 0 means unlimited
Parameters: numColumns (int) – Maximum number of entries in a row See also
maxColumns(),QwtDynGridLayout.setMaxColumns()
-
QwtLegend.maxColumns()[source]¶ Returns: Maximum number of entries in a row See also
setMaxColumns(),QwtDynGridLayout.maxColumns()
-
QwtLegend.setDefaultItemMode(mode)[source]¶ Set the default mode for legend labels
Legend labels will be constructed according to the attributes in a QwtLegendData object. When it doesn’t contain a value for the QwtLegendData.ModeRole the label will be initialized with the default mode of the legend.
Parameters: mode (int) – Default item mode See also
itemMode(),QwtLegendData.value(),QwtPlotItem::legendData()... note:
Changing the mode doesn't have any effect on existing labels.
-
QwtLegend.contentsWidget()[source]¶ The contents widget is the only child of the viewport of the internal QScrollArea and the parent widget of all legend items.
Returns: Container widget of the legend items
-
QwtLegend.updateLegend(itemInfo, data)[source]¶ Update the entries for an item
Parameters: - itemInfo (QVariant) – Info for an item
- data (list) – Default item mode
-
QwtLegend.createWidget(data)[source]¶ Create a widget to be inserted into the legend
The default implementation returns a QwtLegendLabel.
Parameters: data (QwtLegendData) – Attributes of the legend entry Returns: Widget representing data on the legend ... note:
updateWidget() will called soon after createWidget()
with the same attributes.
-
QwtLegend.updateWidget(widget, data)[source]¶ Update the widget
Parameters: - widget (QWidget) – Usually a QwtLegendLabel
- data (QwtLegendData) – Attributes to be displayed
See also
... note:
When widget is no QwtLegendLabel updateWidget() does nothing.
-
QwtLegend.heightForWidth(width)[source]¶ Parameters: width (int) – Width Returns: The preferred height, for a width.
-
QwtLegend.eventFilter(object_, event)[source]¶ Handle QEvent.ChildRemoved andQEvent.LayoutRequest events for the contentsWidget().
Parameters: - object (QObject) – Object to be filtered
- event (QEvent) – Event
Returns: Forwarded to QwtAbstractLegend.eventFilter()
-
QwtLegend.renderLegend(painter, rect, fillBackground)[source]¶ Render the legend into a given rectangle.
Parameters: - painter (QPainter) – Painter
- rect (QRectF) – Bounding rectangle
- fillBackground (bool) – When true, fill rect with the widget background
-
QwtLegend.renderItem(painter, widget, rect, fillBackground)[source]¶ Render a legend entry into a given rectangle.
Parameters: - painter (QPainter) – Painter
- widget (QWidget) – Widget representing a legend entry
- rect (QRectF) – Bounding rectangle
- fillBackground (bool) – When true, fill rect with the widget background
-
QwtLegend.legendWidgets(itemInfo)[source]¶ List of widgets associated to a item
Parameters: itemInfo (QVariant) – Info about an item
-
class
-
class
qwt.legend.QwtLegend(parent=None)[source] The legend widget
The QwtLegend widget is a tabular arrangement of legend items. Legend items might be any type of widget, but in general they will be a QwtLegendLabel.
See also
:py:class`qwt.legend_label.QwtLegendLabel`, :py:class`qwt.plot.QwtPlotItem`, :py:class`qwt.plot.QwtPlot`
-
class
QwtLegend([parent=None]) Constructor
Parameters: parent (QWidget) – Parent widget
-
QwtLegend.setMaxColumns(numColumns)[source] Set the maximum number of entries in a row
F.e when the maximum is set to 1 all items are aligned vertically. 0 means unlimited
Parameters: numColumns (int) – Maximum number of entries in a row See also
maxColumns(),QwtDynGridLayout.setMaxColumns()
-
QwtLegend.maxColumns()[source] Returns: Maximum number of entries in a row See also
setMaxColumns(),QwtDynGridLayout.maxColumns()
-
QwtLegend.setDefaultItemMode(mode)[source] Set the default mode for legend labels
Legend labels will be constructed according to the attributes in a QwtLegendData object. When it doesn’t contain a value for the QwtLegendData.ModeRole the label will be initialized with the default mode of the legend.
Parameters: mode (int) – Default item mode See also
itemMode(),QwtLegendData.value(),QwtPlotItem::legendData()... note:
Changing the mode doesn't have any effect on existing labels.
-
QwtLegend.defaultItemMode()[source] Returns: Default item mode See also
-
QwtLegend.contentsWidget()[source] The contents widget is the only child of the viewport of the internal QScrollArea and the parent widget of all legend items.
Returns: Container widget of the legend items
-
QwtLegend.horizontalScrollBar()[source] Returns: Horizontal scrollbar See also
-
QwtLegend.verticalScrollBar()[source] Returns: Vertical scrollbar See also
-
QwtLegend.updateLegend(itemInfo, data)[source] Update the entries for an item
Parameters: - itemInfo (QVariant) – Info for an item
- data (list) – Default item mode
-
QwtLegend.createWidget(data)[source] Create a widget to be inserted into the legend
The default implementation returns a QwtLegendLabel.
Parameters: data (QwtLegendData) – Attributes of the legend entry Returns: Widget representing data on the legend ... note:
updateWidget() will called soon after createWidget()
with the same attributes.
-
QwtLegend.updateWidget(widget, data)[source] Update the widget
Parameters: - widget (QWidget) – Usually a QwtLegendLabel
- data (QwtLegendData) – Attributes to be displayed
See also
... note:
When widget is no QwtLegendLabel updateWidget() does nothing.
-
QwtLegend.sizeHint()[source] Return a size hint
-
QwtLegend.heightForWidth(width)[source] Parameters: width (int) – Width Returns: The preferred height, for a width.
-
QwtLegend.eventFilter(object_, event)[source] Handle QEvent.ChildRemoved andQEvent.LayoutRequest events for the contentsWidget().
Parameters: - object (QObject) – Object to be filtered
- event (QEvent) – Event
Returns: Forwarded to QwtAbstractLegend.eventFilter()
-
QwtLegend.renderLegend(painter, rect, fillBackground)[source] Render the legend into a given rectangle.
Parameters: - painter (QPainter) – Painter
- rect (QRectF) – Bounding rectangle
- fillBackground (bool) – When true, fill rect with the widget background
-
QwtLegend.renderItem(painter, widget, rect, fillBackground)[source] Render a legend entry into a given rectangle.
Parameters: - painter (QPainter) – Painter
- widget (QWidget) – Widget representing a legend entry
- rect (QRectF) – Bounding rectangle
- fillBackground (bool) – When true, fill rect with the widget background
-
QwtLegend.legendWidgets(itemInfo)[source] List of widgets associated to a item
Parameters: itemInfo (QVariant) – Info about an item
-
QwtLegend.legendWidget(itemInfo)[source] First widget in the list of widgets associated to an item
Parameters: itemInfo (QVariant) – Info about an item
-
QwtLegend.itemInfo(widget)[source] Find the item that is associated to a widget
Parameters: widget (QWidget) – Widget on the legend Returns: Associated item info
-
class
Color maps
QwtColorMap
-
class
qwt.color_map.QwtColorMap(format_=None)[source]¶ QwtColorMap is used to map values into colors.
For displaying 3D data on a 2D plane the 3rd dimension is often displayed using colors, like f.e in a spectrogram.
Each color map is optimized to return colors for only one of the following image formats:
- QImage.Format_Indexed8
- QImage.Format_ARGB32
-
class
QwtColorMap(format_)¶ Parameters: format (int) – Preferred format of the color map ( QwtColorMap.RGBorQwtColorMap.Indexed)
See also
qwt.QwtScaleWidget-
QwtColorMap.color(interval, value)[source]¶ Map a value into a color
Parameters: - interval (qwt.interval.QwtInterval) – valid interval for value
- value (float) – value
Returns: the color corresponding to value
Warning
This method is slow for Indexed color maps. If it is necessary to map many values, its better to get the color table once and find the color using colorIndex().
-
QwtColorMap.colorTable(interval)[source]¶ Build and return a color map of 256 colors
Parameters: interval (qwt.interval.QwtInterval) – range for the values Returns: a color table, that can be used for a QImage The color table is needed for rendering indexed images in combination with using colorIndex().
QwtLinearColorMap
-
class
qwt.color_map.QwtLinearColorMap(*args)[source]¶ Build a linear color map with two stops.
-
class
QwtLinearColorMap(format_)¶ Build a color map with two stops at 0.0 and 1.0. The color at 0.0 is Qt.blue, at 1.0 it is Qt.yellow.
Parameters: format (int) – Preferred format of the color map ( QwtColorMap.RGBorQwtColorMap.Indexed)
-
QwtLinearColorMap(color1, color2, [format_=QwtColorMap.RGB]): Build a color map with two stops at 0.0 and 1.0.
Parameters: - color1 (QColor) – color at 0.
- color2 (QColor) – color at 1.
- format (int) – Preferred format of the color map (
QwtColorMap.RGBorQwtColorMap.Indexed)
-
QwtLinearColorMap.setMode(mode)[source]¶ Set the mode of the color map
Parameters: mode (int) – QwtLinearColorMap.FixedColorsorQwtLinearColorMap.ScaledColorsFixedColors means the color is calculated from the next lower color stop. ScaledColors means the color is calculated by interpolating the colors of the adjacent stops.
-
class
QwtAlphaColorMap
-
class
qwt.color_map.QwtAlphaColorMap(color)[source]¶ QwtAlphaColorMap varies the alpha value of a color
-
class
QwtAlphaColorMap(color)¶ Build a color map varying the alpha value of a color.
Parameters: color (QColor) – color of the map
-
QwtAlphaColorMap.setColor(color)[source]¶ Set the color of the map
Parameters: color (QColor) – color of the map
-
class
-
class
qwt.color_map.QwtColorMap(format_=None)[source] QwtColorMap is used to map values into colors.
For displaying 3D data on a 2D plane the 3rd dimension is often displayed using colors, like f.e in a spectrogram.
Each color map is optimized to return colors for only one of the following image formats:
- QImage.Format_Indexed8
- QImage.Format_ARGB32
-
class
QwtColorMap(format_) Parameters: format (int) – Preferred format of the color map ( QwtColorMap.RGBorQwtColorMap.Indexed)
See also
qwt.QwtScaleWidget-
QwtColorMap.color(interval, value)[source] Map a value into a color
Parameters: - interval (qwt.interval.QwtInterval) – valid interval for value
- value (float) – value
Returns: the color corresponding to value
Warning
This method is slow for Indexed color maps. If it is necessary to map many values, its better to get the color table once and find the color using colorIndex().
-
QwtColorMap.colorTable(interval)[source] Build and return a color map of 256 colors
Parameters: interval (qwt.interval.QwtInterval) – range for the values Returns: a color table, that can be used for a QImage The color table is needed for rendering indexed images in combination with using colorIndex().
-
class
qwt.color_map.QwtLinearColorMap(*args)[source] Build a linear color map with two stops.
-
class
QwtLinearColorMap(format_) Build a color map with two stops at 0.0 and 1.0. The color at 0.0 is Qt.blue, at 1.0 it is Qt.yellow.
Parameters: format (int) – Preferred format of the color map ( QwtColorMap.RGBorQwtColorMap.Indexed)
-
QwtLinearColorMap(color1, color2, [format_=QwtColorMap.RGB]): Build a color map with two stops at 0.0 and 1.0.
Parameters: - color1 (QColor) – color at 0.
- color2 (QColor) – color at 1.
- format (int) – Preferred format of the color map (
QwtColorMap.RGBorQwtColorMap.Indexed)
-
QwtLinearColorMap.setMode(mode)[source] Set the mode of the color map
Parameters: mode (int) – QwtLinearColorMap.FixedColorsorQwtLinearColorMap.ScaledColorsFixedColors means the color is calculated from the next lower color stop. ScaledColors means the color is calculated by interpolating the colors of the adjacent stops.
-
QwtLinearColorMap.mode()[source] Returns: the mode of the color map See also
-
class
-
class
qwt.color_map.QwtAlphaColorMap(color)[source] QwtAlphaColorMap varies the alpha value of a color
-
class
QwtAlphaColorMap(color) Build a color map varying the alpha value of a color.
Parameters: color (QColor) – color of the map
-
QwtAlphaColorMap.setColor(color)[source] Set the color of the map
Parameters: color (QColor) – color of the map
-
QwtAlphaColorMap.color()[source] Returns: the color of the map See also
-
class
QwtPlotRenderer
-
class
qwt.plot_renderer.QwtPlotRenderer(parent=None)[source]¶ Renderer for exporting a plot to a document, a printer or anything else, that is supported by QPainter/QPaintDevice
Discard flags:
- QwtPlotRenderer.DiscardNone: Render all components of the plot
- QwtPlotRenderer.DiscardBackground: Don’t render the background of the plot
- QwtPlotRenderer.DiscardTitle: Don’t render the title of the plot
- QwtPlotRenderer.DiscardLegend: Don’t render the legend of the plot
- QwtPlotRenderer.DiscardCanvasBackground: Don’t render the background of the canvas
- QwtPlotRenderer.DiscardFooter: Don’t render the footer of the plot
- QwtPlotRenderer.DiscardCanvasFrame: Don’t render the frame of the canvas
Note
The QwtPlotRenderer.DiscardCanvasFrame flag has no effect when using style sheets, where the frame is part of the background
Layout flags:
- QwtPlotRenderer.DefaultLayout: Use the default layout as on screen
- QwtPlotRenderer.FrameWithScales: Instead of the scales a box is painted around the plot canvas, where the scale ticks are aligned to.
-
setDiscardFlag(flag, on)[source]¶ Change a flag, indicating what to discard from rendering
Parameters: - flag (int) – Flag to change
- on (bool) – On/Off
See also
-
testDiscardFlag(flag)[source]¶ Parameters: flag (int) – Flag to be tested Returns: True, if flag is enabled. See also
-
setDiscardFlags(flags)[source]¶ Set the flags, indicating what to discard from rendering
Parameters: flags (int) – Flags See also
-
setLayoutFlag(flag, on)[source]¶ Change a layout flag
Parameters: flag (int) – Flag to change See also
-
testLayoutFlag(flag)[source]¶ Parameters: flag (int) – Flag to be tested Returns: True, if flag is enabled. See also
-
renderDocument(plot, filename, sizeMM=(300, 200), resolution=85, format_=None)[source]¶ Render a plot to a file
The format of the document will be auto-detected from the suffix of the file name.
Parameters: - plot (qwt.plot.QwtPlot) – Plot widget
- fileName (str) – Path of the file, where the document will be stored
- sizeMM (QSizeF) – Size for the document in millimeters
- resolution (int) – Resolution in dots per Inch (dpi)
-
renderTo(plot, dest)[source]¶ Render a plot to a file
Supported formats are:
- pdf: Portable Document Format PDF
- ps: Postcript
- svg: Scalable Vector Graphics SVG
- all image formats supported by Qt, see QImageWriter.supportedImageFormats()
Scalable vector graphic formats like PDF or SVG are superior to raster graphics formats.
Parameters: - plot (qwt.plot.QwtPlot) – Plot widget
- fileName (str) – Path of the file, where the document will be stored
- format (str) – Format for the document
- sizeMM (QSizeF) – Size for the document in millimeters.
- resolution (int) – Resolution in dots per Inch (dpi)
See also
renderTo(),render(),qwt.painter.QwtPainter.setRoundingAlignment()
-
render(plot, painter, plotRect)[source]¶ Paint the contents of a QwtPlot instance into a given rectangle.
Parameters: - plot (qwt.plot.QwtPlot) – Plot to be rendered
- painter (QPainter) – Painter
- format (str) – Format for the document
- plotRect (QRectF) – Bounding rectangle
See also
renderDocument(),renderTo(),qwt.painter.QwtPainter.setRoundingAlignment()
-
renderTitle(plot, painter, rect)[source]¶ Render the title into a given rectangle.
Parameters: - plot (qwt.plot.QwtPlot) – Plot widget
- painter (QPainter) – Painter
- rect (QRectF) – Bounding rectangle
Render the footer into a given rectangle.
Parameters: - plot (qwt.plot.QwtPlot) – Plot widget
- painter (QPainter) – Painter
- rect (QRectF) – Bounding rectangle
-
renderLegend(plot, painter, rect)[source]¶ Render the legend into a given rectangle.
Parameters: - plot (qwt.plot.QwtPlot) – Plot widget
- painter (QPainter) – Painter
- rect (QRectF) – Bounding rectangle
-
renderScale(plot, painter, axisId, startDist, endDist, baseDist, rect)[source]¶ Paint a scale into a given rectangle. Paint the scale into a given rectangle.
Parameters: - plot (qwt.plot.QwtPlot) – Plot widget
- painter (QPainter) – Painter
- axisId (int) – Axis
- startDist (int) – Start border distance
- endDist (int) – End border distance
- baseDist (int) – Base distance
- rect (QRectF) – Bounding rectangle
-
renderCanvas(plot, painter, canvasRect, maps)[source]¶ Render the canvas into a given rectangle.
Parameters: - plot (qwt.plot.QwtPlot) – Plot widget
- painter (QPainter) – Painter
- maps (qwt.scale_map.QwtScaleMap) – mapping between plot and paint device coordinates
- rect (QRectF) – Bounding rectangle
-
buildCanvasMaps(plot, canvasRect)[source]¶ Calculated the scale maps for rendering the canvas
Parameters: - plot (qwt.plot.QwtPlot) – Plot widget
- canvasRect (QRectF) – Target rectangle
Returns: Calculated scale maps
-
exportTo(plot, documentname, sizeMM=None, resolution=85)[source]¶ Execute a file dialog and render the plot to the selected file
Parameters: - plot (qwt.plot.QwtPlot) – Plot widget
- documentName (str) – Default document name
- sizeMM (QSizeF) – Size for the document in millimeters
- resolution (int) – Resolution in dots per Inch (dpi)
Returns: True, when exporting was successful
See also
-
qwt.plot_renderer.qwtCanvasClip(canvas, canvasRect)[source]¶ The clip region is calculated in integers To avoid too much rounding errors better calculate it in target device resolution
-
class
qwt.plot_renderer.QwtPlotRenderer(parent=None)[source] Renderer for exporting a plot to a document, a printer or anything else, that is supported by QPainter/QPaintDevice
Discard flags:
- QwtPlotRenderer.DiscardNone: Render all components of the plot
- QwtPlotRenderer.DiscardBackground: Don’t render the background of the plot
- QwtPlotRenderer.DiscardTitle: Don’t render the title of the plot
- QwtPlotRenderer.DiscardLegend: Don’t render the legend of the plot
- QwtPlotRenderer.DiscardCanvasBackground: Don’t render the background of the canvas
- QwtPlotRenderer.DiscardFooter: Don’t render the footer of the plot
- QwtPlotRenderer.DiscardCanvasFrame: Don’t render the frame of the canvas
Note
The QwtPlotRenderer.DiscardCanvasFrame flag has no effect when using style sheets, where the frame is part of the background
Layout flags:
- QwtPlotRenderer.DefaultLayout: Use the default layout as on screen
- QwtPlotRenderer.FrameWithScales: Instead of the scales a box is painted around the plot canvas, where the scale ticks are aligned to.
-
setDiscardFlag(flag, on)[source] Change a flag, indicating what to discard from rendering
Parameters: - flag (int) – Flag to change
- on (bool) – On/Off
See also
-
testDiscardFlag(flag)[source] Parameters: flag (int) – Flag to be tested Returns: True, if flag is enabled. See also
-
setDiscardFlags(flags)[source] Set the flags, indicating what to discard from rendering
Parameters: flags (int) – Flags See also
-
discardFlags()[source] Returns: Flags, indicating what to discard from rendering See also
-
setLayoutFlag(flag, on)[source] Change a layout flag
Parameters: flag (int) – Flag to change See also
-
testLayoutFlag(flag)[source] Parameters: flag (int) – Flag to be tested Returns: True, if flag is enabled. See also
-
setLayoutFlags(flags)[source] Set the layout flags
Parameters: flags (int) – Flags See also
-
layoutFlags()[source] Returns: Layout flags See also
-
renderDocument(plot, filename, sizeMM=(300, 200), resolution=85, format_=None)[source] Render a plot to a file
The format of the document will be auto-detected from the suffix of the file name.
Parameters: - plot (qwt.plot.QwtPlot) – Plot widget
- fileName (str) – Path of the file, where the document will be stored
- sizeMM (QSizeF) – Size for the document in millimeters
- resolution (int) – Resolution in dots per Inch (dpi)
-
renderTo(plot, dest)[source] Render a plot to a file
Supported formats are:
- pdf: Portable Document Format PDF
- ps: Postcript
- svg: Scalable Vector Graphics SVG
- all image formats supported by Qt, see QImageWriter.supportedImageFormats()
Scalable vector graphic formats like PDF or SVG are superior to raster graphics formats.
Parameters: - plot (qwt.plot.QwtPlot) – Plot widget
- fileName (str) – Path of the file, where the document will be stored
- format (str) – Format for the document
- sizeMM (QSizeF) – Size for the document in millimeters.
- resolution (int) – Resolution in dots per Inch (dpi)
See also
renderTo(),render(),qwt.painter.QwtPainter.setRoundingAlignment()
-
render(plot, painter, plotRect)[source] Paint the contents of a QwtPlot instance into a given rectangle.
Parameters: - plot (qwt.plot.QwtPlot) – Plot to be rendered
- painter (QPainter) – Painter
- format (str) – Format for the document
- plotRect (QRectF) – Bounding rectangle
See also
renderDocument(),renderTo(),qwt.painter.QwtPainter.setRoundingAlignment()
-
renderTitle(plot, painter, rect)[source] Render the title into a given rectangle.
Parameters: - plot (qwt.plot.QwtPlot) – Plot widget
- painter (QPainter) – Painter
- rect (QRectF) – Bounding rectangle
-
renderFooter(plot, painter, rect)[source] Render the footer into a given rectangle.
Parameters: - plot (qwt.plot.QwtPlot) – Plot widget
- painter (QPainter) – Painter
- rect (QRectF) – Bounding rectangle
-
renderLegend(plot, painter, rect)[source] Render the legend into a given rectangle.
Parameters: - plot (qwt.plot.QwtPlot) – Plot widget
- painter (QPainter) – Painter
- rect (QRectF) – Bounding rectangle
-
renderScale(plot, painter, axisId, startDist, endDist, baseDist, rect)[source] Paint a scale into a given rectangle. Paint the scale into a given rectangle.
Parameters: - plot (qwt.plot.QwtPlot) – Plot widget
- painter (QPainter) – Painter
- axisId (int) – Axis
- startDist (int) – Start border distance
- endDist (int) – End border distance
- baseDist (int) – Base distance
- rect (QRectF) – Bounding rectangle
-
renderCanvas(plot, painter, canvasRect, maps)[source] Render the canvas into a given rectangle.
Parameters: - plot (qwt.plot.QwtPlot) – Plot widget
- painter (QPainter) – Painter
- maps (qwt.scale_map.QwtScaleMap) – mapping between plot and paint device coordinates
- rect (QRectF) – Bounding rectangle
-
buildCanvasMaps(plot, canvasRect)[source] Calculated the scale maps for rendering the canvas
Parameters: - plot (qwt.plot.QwtPlot) – Plot widget
- canvasRect (QRectF) – Target rectangle
Returns: Calculated scale maps
-
exportTo(plot, documentname, sizeMM=None, resolution=85)[source] Execute a file dialog and render the plot to the selected file
Parameters: - plot (qwt.plot.QwtPlot) – Plot widget
- documentName (str) – Default document name
- sizeMM (QSizeF) – Size for the document in millimeters
- resolution (int) – Resolution in dots per Inch (dpi)
Returns: True, when exporting was successful
See also