pyny3d documentation
In this page, a extended explanation of all the methods in all the classes is addressed. Its purpose is be used as sourcebook to figure out how they can be used.
On the other hand, if you prefer a more schematic view of the modules, you should visit the Modules scheme section. Finally, if you want to see most of these funtionalities in action, you probably want to take a look to the Guide section.
geoms module
Polygon
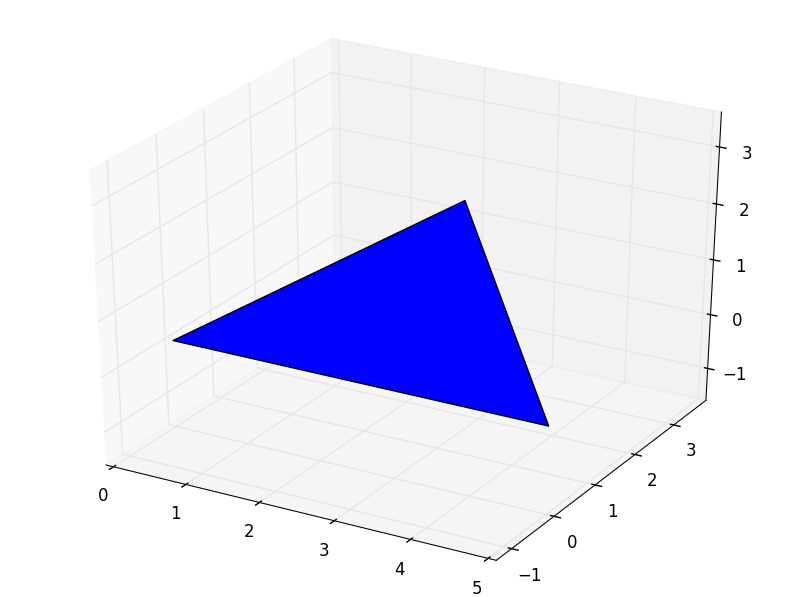
Example of a triangle given by three points: [[0, 0, 0], [5, 0, 0], [2.5, 2.5, 2]]
-
class
pyny3d.geoms.Polygon(points, make_ccw=True, **kwargs)[source]¶ The most basic geometry class. It generates and stores all the information relative to a 3D polygon.
Instances of this class work as iterable object. When indexed, returns the points which conform it.
Parameters: - points (ndarray shape=(N, 2 or 3)) – Sorted points which form the polygon (xyz or xy). Do not repeat the first point at the end.
- check_convexity (bool) – If True, an error will be raised for concave Polygons. It is a requirement of the code that the polygons have to be convex.
Returns: None
Note
This object can be locked (
.lock()method) in order to precompute information for faster further computations.-
contains(points, edge=True)[source]¶ Point-in-Polygon algorithm for multiple points for the z=0 projection of the
pyny.Polygon.Parameters: - points (ndarray with points (xyz or xy) in rows) – Set of points to evaluate.
- edge (bool) – If True, consider the points in the Polygon’s edge as inside the Polygon.
Returns: Whether each point is inside the polygon or not (in z=0 projection).
Return type: ndarray (dtype=bool)
-
get_domain()[source]¶ Returns: opposite vertices of the bounding prism for this object. Return type: ndarray([min], [max])
-
get_height(points, only_in=True, edge=True, full=False)[source]¶ - Given a set of points, it computes the z value for the
- parametric equation of the plane where the polygon belongs.
Only the two first columns of the points will be taken into account as x and y.
By default, the points outside the object will have a NaN value in the z column. If the inputed points has a third column the z values outside the Surface’s domain will remain unchanged, the rest will be replaced.
Parameters: - points (ndarray shape=(N, 2 or 3)) – Coordinates of the points to calculate.
- only_in (bool) – If True, computes only the points which are inside of the Polygon.
- edge (bool) – If True, consider the points in the Polygon’s edge inside the Polygon.
- full (bool) – If true, the return will have three columns (x, y, z) instead of one (z).
Returns: - or (x, y, z)
Return type: ndarray shape=(N, 1 or 3)
-
get_parametric(check=True, tolerance=0.001)[source]¶ Calculates the parametric equation of the plane that contains the polygon. The output has the form np.array([a, b, c, d]) for:
\[a*x + b*y + c*z + d = 0\]Parameters: Note
This method automatically stores the solution in order to do not repeat calculations if the user needs to call it more than once.
-
get_seed()[source]¶ Collects the required information to generate a data estructure that can be used to recreate exactly the same geometry object via **kwargs.
Returns: Object’s sufficient info to initialize it. Return type: dict
-
static
is_convex(points)[source]¶ Static method. Returns True if the polygon is convex regardless of whether its vertices follow a clockwise or a counter-clockwise order. This is a requirement for the rest of the program.
Parameters: points (ndarray with points xyz in rows) – Points intented to form a polygon. Returns: Whether a polygon is convex or not. Return type: bool Note
Despite the code works for ccw polygons, in order to avoid possible bugs it is always recommended to use ccw rather than cw.
Warning
This method do not check the order of the points.
-
lock()[source]¶ Precomputes some parameters to run faster specific methods like Surface.classify.
Stores
self.domainandself.path, both very used in the shadows simulation, in order to avoid later unnecessary calculations and verifications.Returns: None Warning
Unnecessary locks can slowdown your code.
-
static
make_ccw(points)[source]¶ Static method. Returns a counterclock wise ordered sequence of points. If there are any repeated point, the method will raise an error.
Due to the 3D character of the package, the order or the points will be tried following this order:
- z=0 pprojection
- x=0 pprojection
- y=0 pprojection
Parameters: points (ndarray with points (xyz or xy) in rows) – Points to form a polygon (xyz or xy) Returns: ccw version of the points. Return type: ndarray (shape=(N, 2 or 3))
-
matrix(x=(0, 0), y=(0, 0), z=(0, 0))[source]¶ Copy the
pyny.Polygonalong a 3D matrix given by the three tuples x, y, z:Parameters: x (tuple (len=2)) – Number of copies and distance between them in this direction. Returns: list of pyny.Polygons
-
mirror(axes='x')[source]¶ Generates a symmetry of the Polygon respect global axes.
Parameters: axes (str) – ‘x’, ‘y’, ‘z’, ‘xy’, ‘xz’, ‘yz’... Returns: pyny.Polygon
-
move(d_xyz)[source]¶ Translate the Polygons in x, y and z coordinates.
Parameters: d_xyz (tuple (len=2 or 3)) – displacement in x, y(, and z). Returns: pyny.Polygon
-
pip(points, sorted_col=0, radius=0)[source]¶ Point-in-Polygon for the z=0 projection. This function enhances the performance of
Polygon.contains()by verifying only the points which are inside the bounding box of the polygon. To do it fast, it needs the points array to be already sorted by one column.Parameters: Returns: Which points are inside the polygon.
Return type: ndarray (dtpye=bool)
Warning
By default pip considers that the set of points is currently sorted by the first column.
Warning
This method only works if the polygon has been locked (
lock()).
-
plot2d(color='default', alpha=1, ret=True)[source]¶ Generates a 2D plot for the z=0 Polygon projection.
Parameters: Returns: None, axes
Return type: None, matplotlib axes
-
rotate(angle, direction='z', axis=None)[source]¶ Returns a new Polygon which is the same but rotated about a given axis.
If the axis given is
None, the rotation will be computed about the Surface’s centroid.Parameters: Returns: pyny.Polygon
-
seed2pyny(seed)[source]¶ Re-initialize an object with a seed.
Returns: A new pyny.PolygonReturn type: pyny.Polygon
-
to_2d()[source]¶ - Generates the real 2D polygon of the 3D polygon. This method
- performs a change of reference system obtaining the same polygon but with the new z=0 plane containing the polygon.
This library mostly uses the z=0 projection to perform operations with the polygons. For this reason, if real 2D planar operations are required (like calculate real area) the best way is to create a new
pyny.Polygonwith this method.Returns: Planar orthogonal view of the polygon. Return type: pyny.Polygon
Surface
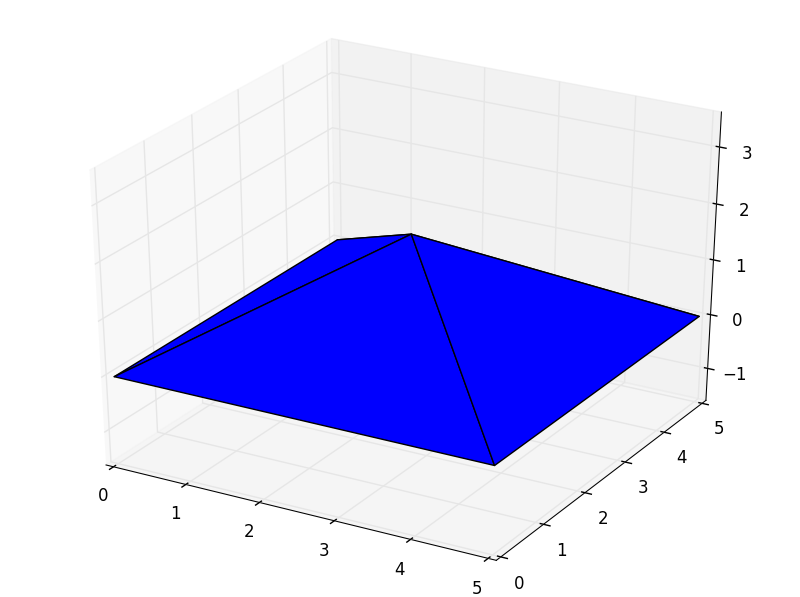
Example of a Surface formed by four triangles.
-
class
pyny3d.geoms.Surface(polygons, holes=[], make_ccw=True, melt=False, check_contiguity=False, **kwargs)[source]¶ This class groups contiguous polygons (coplanars or not). These polygons cannot overlap each other on the z=0 projection*.
This object is a composition of polygons and holes. The polygons can be used to “hold up” other objects (points, other polygons...) and to compute shadows. The holes exist only to prevent the program to place objects on them. The shadows computation do not take care of the holes**, instead, they can be emulated by a collection of polygons.
Instances of this class work as iterable object. When indexed, returns the
pyny.Polygonswhich conform it.Parameters: - polygons (list of ndarray, list of
pyny.Polygon) – Polygons to be set as Surface. This is the only necessary input to create a Surface. - holes (list of ndarray, list of
pyny.Polygon) – Polygons to be set as holes of the Surface. - make_ccw (bool) – If True, points will be sorted ccw for each polygon.
- melt (bool) – If True, the
melt()method will be launched at initialization. - check_contiguity (bool) – If True,
contiguous()will be launched at initialization.
Returns: None
Note
* For models with planes stacked in column, use the Place class to distinct them. For example, a three-storey building structure can be modeled by using one
pyny.Placefor storey where the floor is a Surface and the columns are Polyhedra.Note
** In the future versions of this library it will simulate shadows through the holes.
-
add_holes(holes_list, make_ccw=True)[source]¶ Add holes to the holes list.
Parameters: - holes_list (list or pyny.Polygon) – Polygons that will be treated as holes.
- make_ccw (bool) – If True, points will be sorted ccw.
Returns: None
Note
The holes can be anywhere, not necesarily on the surface.
-
classify(points, edge=True, col=1, already_sorted=False)[source]¶ Calculates the belonging relationship between the polygons in the Surface and a set of points.
- This function enhances the performance of
Polygon.contains() - when used with multiple non-overlapping polygons (stored in a
Surface) by verifying only the points which are inside the z=0
bounding box of each polygon. To do it fast, it sorts the points
and then apply
Polygon.pip()for each Polygon.
Parameters: - points (ndarray (shape=(N, 2 or 3))) – list of (x, y, z) or (x, y) coordinates of the points to check. (The z value will not be taken into account).
- edge (bool) – If True, consider the points in a Polygon’s edge inside a Polygon.
- col (int) – Column to sort or already sorted.
- already_sorted (bool) – If True, the method will consider that the points are already sorted by the column col.
Returns: Index of the Polygon to which each point belongs. -1 if outside the Surface.
Return type: ndarray (dtpye=int)
- This function enhances the performance of
-
static
contiguous(polygons)[source]¶ - Static method. Check whether a set of convex polygons are all
- contiguous. Two polygons are considered contiguous if they share, at least, one side (two vertices).
This is not a complete verification, it is a very simplified one. For a given set of polygons this method will verify that the number of common vertices among them equals or exceeds the minimum number of common vertices possible.
This little algorithm will not declare a contiguous set of polygons as non-contiguous, but it can fail in the reverse for certain geometries where polygons have several common vertices among them.
Parameters: polygons (list of pyny.Polygon) – List of polygons.Returns: Whether tey are contiguous. Return type: bool
-
get_area()[source]¶ Returns: The area of the surface. Warning
The area is computed as the sum of the areas of all the polygons minus the sum of the areas of all the holes.
-
get_domain()[source]¶ Returns: opposite vertices of the bounding prism for this object in the form of ndarray([min], [max]) Note
This method automatically stores the solution in order to do not repeat calculations if the user needs to call it more than once.
-
get_height(points, edge=True)[source]¶ Given a set of points, computes the z value for the parametric equation of the Polygons in the Surface.
This method computes recursively the
Polygon.get_height()method for all the Polygons in the Surface, obtaining the z value for the points according to the local Polygon they belong.The points outside the object will have a NaN value in the z column. If the inputed points has a third column the z values outside the Surface’s domain will remain unchanged, the rest will be replaced.
Parameters: - points (ndarray (shape=(N, 2 or 3))) – list of coordinates of the points to calculate.
- edge (bool) – If True, consider the points in the Polygon’s edge inside the Polygon.
Returns: (x, y, z) arrays
Return type: ndarray (shape=(N, 3))
-
get_plotable3d()[source]¶ Returns: matplotlib Poly3DCollection Return type: list of mpl_toolkits.mplot3d
-
get_seed()[source]¶ Collects the required information to generate a data estructure that can be used to recreate exactly the same geometry object via **kwargs.
Returns: Object’s sufficient info to initialize it. Return type: dict
-
intersect_with(polygon)[source]¶ Calculates the intersection between the polygons in this surface and other polygon, in the z=0 projection.
This method rely on the
shapely.Polygon.intersects()method. The way this method is used is intersecting this polygon recursively with all identified polygons which overlaps with it in the z=0 projection.Parameters: polygon (pyny.Polygon) – Polygon to intersect with the Surface. Returns: Multiple polygons product of the intersections. Return type: dict of ndarrays (keys are the number of the polygon inside the surface)
-
iplot(c_poly='default', c_holes='c', ret=False, ax=None)[source]¶ Improved plot that allows to plot polygons and holes in different colors.
Parameters: - c_poly (matplotlib color, ‘default’ or ‘t’ (transparent)) – Polygons color.
- c_holes (matplotlib color, ‘default’ or ‘t’ (transparent)) – Holes color.
- ret (bool) – If True, returns the figure. It can be used to add more elements to the plot or to modify it.
- ax (mplot3d.Axes3D, None) – If a matplotlib axes given, this method will represent the plot on top of this axes. This is used to represent multiple plots from multiple geometries, overlapping them recursively.
Returns: None, axes
Return type: None, mplot3d.Axes3D
-
lock()[source]¶ - Lock the Polygons in the Surface to run faster specific methods
- like Surface.classify.
Returns: None
-
matrix(x=(0, 0), y=(0, 0), z=(0, 0))[source]¶ Copy the
pyny.Surfacealong a 3D matrix given by the three tuples x, y, z:Parameters: x (tuple (len=2)) – Number of copies and distance between them in this direction. Returns: list of pyny.Surface
-
melt(plot=False)[source]¶ Find and merge groups of polygons in the surface that meet the following criteria:
- Are coplanars.
- Are contiguous.
- The result is convex.
This method is very useful at reducing the number the items and, therefore, the shadowing time computing. Before override this instance, it is saved and can be restored with
.restore()Parameters: plot (bool) – If True, generates the before and after visualizations for the surface. Use it to check the results. Returns: None Warning
This method do not check if the merged polygons are actually convex. The convex hull of the union is directly calculated. For this reason, it is very important to visualy check the solution.
-
mirror(axes='x')[source]¶ Generates a symmetry of the Surface respect global axes.
Parameters: axes (str) – ‘x’, ‘y’, ‘z’, ‘xy’, ‘xz’, ‘yz’... Returns: pyny.Surface
-
move(d_xyz)[source]¶ Translate the Surface in x, y and z coordinates.
Parameters: d_xyz (tuple (len=2 or 3)) – displacement in x, y(, and z). Returns: pyny.Surface
-
plot2d(c_poly='default', alpha=1, cmap='default', ret=False, title=' ', colorbar=False, cbar_label='')[source]¶ Generates a 2D plot for the z=0 Surface projection.
Parameters: - c_poly (matplotlib color) – Polygons color.
- alpha (float) – Opacity.
- cmap (matplotlib.cm) – colormap
- ret (bool) – If True, returns the figure. It can be used to add more elements to the plot or to modify it.
- title (str) – Figure title.
- colorbar (bool) – If True, inserts a colorbar in the figure.
- cbar_label (str) – Colorbar right label.
Returns: None, axes
Return type: None, matplotlib axes
- polygons (list of ndarray, list of
Polyhedron
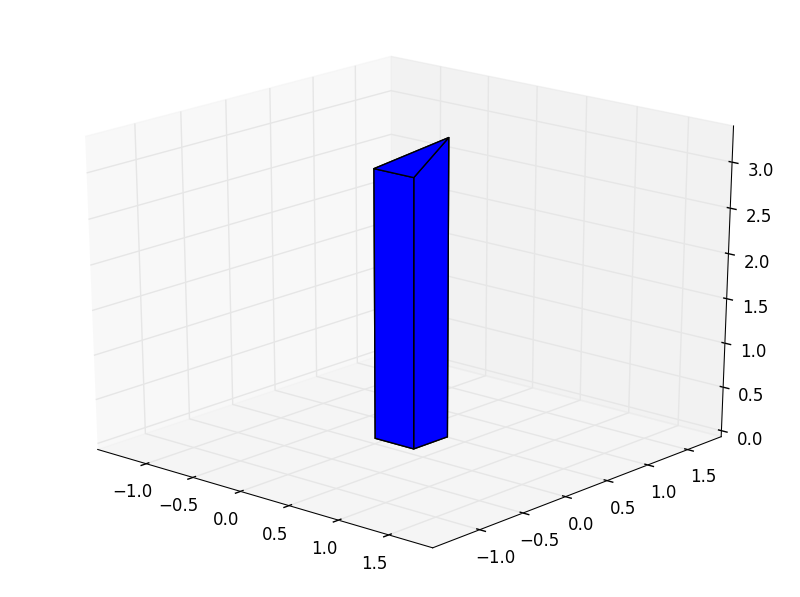
Example of a Polyhedron created extruding a polygon along the z axis from the ground to the Surface
-
class
pyny3d.geoms.Polyhedron(polygons, make_ccw=True, **kwargs)[source]¶ Represents 3D polygon-based convex polyhedra.
Under the hood,
pyny.Polyhedronclass uses thepyny.Surfaceinfrastructure to store and operate with the faces (Polygons). Thispyny.Surfacecan be found inPolyhedron.aux_surface.Instances of this class work as iterable object. When indexed, returns the
pyny.Polygonswhich conform it.Parameters: - polygons (list of ndarray, list of
pyny.Polygon) – Polygons to be set as the Polyhedron. These Polygons have to be contiguous and form a closed polyhedron*. - make_ccw (bool) – If True, points will be sorted ccw for each polygon.
Returns: None
Note
* A concave or open polyhedron will not produce any error and the code will probably work fine but it is important to keep in mind that pyny3d was created to work specifically with convex and closed bodies and you will probably get errors later in other parts of the code.
Warning
This object do NOT check the contiguity of the polygons or whether the polyhedron is closed or not, even it is actually a requirement.
-
static
by_two_polygons(poly1, poly2, make_ccw=True)[source]¶ Static method. Creates a closed
pyny.Polyhedronconnecting two polygons. Both polygons must have the same number of vertices. The faces of the Polyhedron created have to be planar, otherwise, an error will be raised.The Polyhedron will have the poly1 and poly2 as “top” and “bottom” and the rest of its faces will be generated by matching the polygons’ vertices in twos.
Parameters: - poly1 (
pyny.Polygonor ndarray (shape=(N, 3))) – Origin polygon - poly2 (
pyny.Polygonor ndarray (shape=(N, 3))) – Destination polygon - make_ccw (bool) – If True, points will be sorted ccw for each polygon.
Returns: Polyhedron
Return type: pypy.PolyhedronWarning
If an error is raised, probably the Polyhedron have non-planar faces.
Warning
If the Polyhedra are not created with this method or
Place.add_extruded_obstacles(), holes will not be added.- poly1 (
-
get_domain()[source]¶ Returns: opposite vertices of the bounding prism for this object. Return type: ndarray([min], [max]) Note
This method automatically stores the solution in order to do not repeat calculations if the user needs to call it more than once.
-
get_plotable3d()[source]¶ Returns: matplotlib Poly3DCollection Return type: list of mpl_toolkits.mplot3d
-
get_seed()[source]¶ Collects the required information to generate a data estructure that can be used to recreate exactly the same geometry object via **kwargs.
Returns: Object’s sufficient info to initialize it. Return type: dict
-
matrix(x=(0, 0), y=(0, 0), z=(0, 0))[source]¶ Copy the
pyny.Polyhedronalong a 3D matrix given by the three tuples x, y, z:Parameters: x (tuple (len=2)) – Number of copies and distance between them in this direction. Returns: list of pyny.Polyhedron
-
mirror(axes='x')[source]¶ Generates a symmetry of the Polyhedron respect global axes.
Parameters: axes (str) – ‘x’, ‘y’, ‘z’, ‘xy’, ‘xz’, ‘yz’... Returns: pyny.Polyhedron
-
move(d_xyz)[source]¶ Translate the Polyhedron in x, y and z coordinates.
Parameters: d_xyz (tuple (len=2 or 3)) – displacement in x, y(, and z). Returns: pyny.Polyhedron
- polygons (list of ndarray, list of
Place
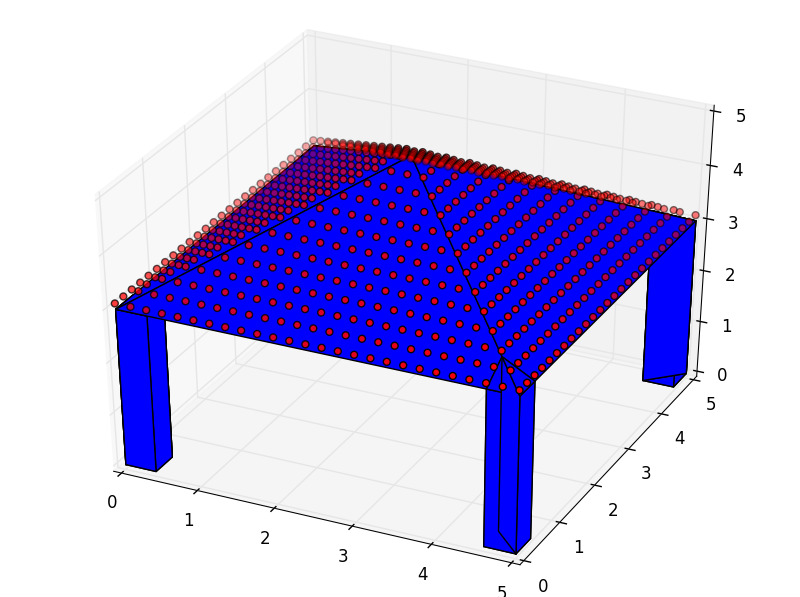
Example of a Place with the three objects it can manage: a Surface, a unlimited number of Polyhedra and a Set of points.
-
class
pyny3d.geoms.Place(surface, polyhedra=[], set_of_points=array([], shape=(0, 3), dtype=float64), make_ccw=True, melt=False, **kwargs)[source]¶ Aggregates one
pyny.Surface, one Set of points and an indefinite number ofpyny.Polyhedra.Represents the union of a surface with an unlimited number of obstacles. All the elements that conform a Place keep their integrity and functionality, what the Place class makes is to give the possibility to perform higher level operations in these groups of objects.
Instances of this class cannot work as iterable object and cannot be indexed.
- The lower level instances will be stored in:
- Place.surface
- Place.polyhedra
- Place.set_of_points
Parameters: - surface (
pyny.Surface, list ofpyny.Polygonor list of ndarray) – This is the only necessary input to create apyny.Place. - polyhedra (list of
pyny.Polyhedra) –pyny.Polyhedrato attach to thepyny.Place. - set_of_points (ndarray (shape=(N, 3))) – Points to attach to the
pyny.Place. - make_ccw (bool) – If True, points will be sorted ccw for each polygon.
Returns: None
Note
This object is implemented to be used dynamically. Once created, it is possible to add elements, with
.add_set_of_points,.add_extruded_obstaclesamong others, without replace it.-
add_extruded_obstacles(top_polys, make_ccw=True)[source]¶ Add polyhedras to the Place by giving their top polygon and applying extrusion along the z axis. The resulting polygon from the intersection will be declared as a hole in the Surface.
Parameters: - top_polys (list of
pyny.Polygon) – Polygons to be extruded to the Surface. - make_ccw (bool) – If True, points will be sorted ccw.
Returns: None
Note
When a top polygon is projected and it instersects multiple Surface’s polygons, a independent polyhedron will be created for each individual intersection*.
Warning
The top polygons have to be over the Surface, that is, their z=0 projection have to be inside of Surface’s z=0 projection.
Warning
If the Polyhedra are not created with this method or
Polyhedron.by_two_polygons(), holes will not be added.- top_polys (list of
-
add_holes(holes_list, make_ccw=True)[source]¶ Add holes to the Place’s
pyny.Surface.Parameters: - holes_list (list or
pyny.Polygon) – Polygons that will be treated as holes. - make_ccw (bool) – If True, points will be sorted ccw.
Returns: None
Note
The holes can be anywhere, not necesarily on the surface.
- holes_list (list or
-
add_set_of_points(points)[source]¶ Add a new set of points to the existing one without removing it.
Parameters: points (ndarray (shape=(N, 3))) – Points to be added. Returns: None
-
get_domain()[source]¶ Returns: opposite vertices of the bounding prism for this object. Return type: ndarray([min], [max])
-
get_height(points, edge=True, attach=False, extra_height=0)[source]¶ Launch
pyny.Surface.get_height(points)for the Place’s Surface.This method gives the possibility to store the computed points along with the Place’s set of points. It also makes possible to add an extra height (z value) to these points.
The points outside the object will have a NaN value in the z column. These point will not be stored but it will be returned.
Parameters: - points (ndarray (shape=(N, 2 or 3))) – list of coordinates of the points to calculate.
- edge (bool) – If True, consider the points in the Polygon’s edge inside the Polygon.
- attach (bool) – If True, stores the computed points along with the Place’s set of points.
- extra_height (float) – Adds an extra height (z value) to the resulting points.
Returns: (x, y, z)
Return type: ndarray
-
get_plotable3d()[source]¶ Returns: matplotlib Poly3DCollection Return type: list of mpl_toolkits.mplot3d
-
get_seed()[source]¶ Collects the required information to generate a data estructure that can be used to recreate exactly the same geometry object via **kwargs.
Returns: Object’s sufficient info to initialize it. Return type: dict
-
iplot(c_poly='default', c_holes='default', c_sop='r', s_sop=25, extra_height=0, ret=False, ax=None)[source]¶ Improved plot that allows to plot polygons and holes in different colors and to change the size and the color of the set of points.
The points can be plotted accordingly to a ndarray colormap.
Parameters: - c_poly (matplotlib color, ‘default’ or ‘t’ (transparent)) – Polygons color.
- c_holes (matplotlib color, ‘default’ or ‘t’ (transparent)) – Holes color.
- c_sop (matplotlib color or colormap) – Set of points color.
- s_sop (float or ndarray) – Set of points size.
- extra_height (float) – Elevates the points in the visualization.
- ret (bool) – If True, returns the figure. It can be used to add more elements to the plot or to modify it.
- ax (mplot3d.Axes3D, None) – If a matplotlib axes given, this method will represent the plot on top of this axes. This is used to represent multiple plots from multiple geometries, overlapping them recursively.
Returns: None, axes
Return type: None, mplot3d.Axes3D
-
matrix(x=(0, 0), y=(0, 0), z=(0, 0))[source]¶ Copy the
pyny.Placealong a 3D matrix given by the three tuples x, y, z:Parameters: x (tuple (len=2)) – Number of copies and distance between them in this direction. Returns: list of pyny.Place
-
mesh(mesh_size=1, extra_height=0.1, edge=True, attach=True)[source]¶ - Generates a set of points distributed in a mesh that covers the
- whole Place and computes their height.
Generates a xy mesh with a given mesh_size in the Place.surface’s domain and computes the Surface’s height for the nodes. This mesh is alligned with the main directions x and y.
Parameters: Returns: (x, y, z)
Return type: ndarray
-
mirror(axes='x')[source]¶ Generates a symmetry of the Place respect global axes.
Parameters: axes (str) – ‘x’, ‘y’, ‘z’, ‘xy’, ‘xz’, ‘yz’... Returns: pyny.Place
-
move(d_xyz)[source]¶ Translate the Place in x, y and z coordinates.
Parameters: d_xyz (tuple (len=2 or 3)) – displacement in x, y(, and z). Returns: pyny.Place
Space
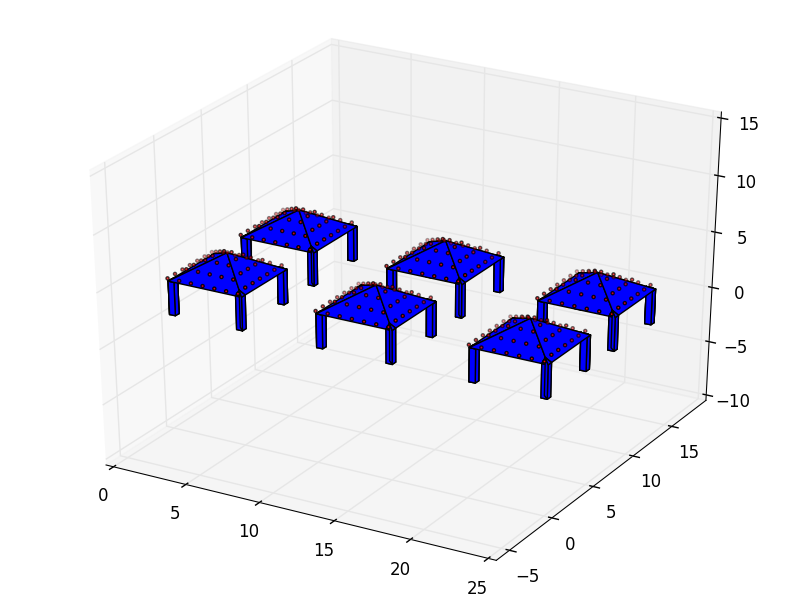
Example of a Space with six individual Places.
-
class
pyny3d.geoms.Space(places=[], **kwargs)[source]¶ the highest level geometry class. It Aggregates
pyny.Placesto group computations. It can be initialized empty.- The lower level instances will be stored in:
- Space.places
Parameters: places (list of pyny.Place) – Places or empty list.Returns: None Instances of this class work as iterable object. When indexed, returns the
pyny.Placeswhich conform it.Note
This class is implemented to be used dynamically. Once created, it is possible to add elements, with
.add_places,.add_spacesamong others, without replace it.Warning
Although it is a dynamic class, it is recommended to use the methods to manipulate it. Editing the internal attributes or methods directly can result in a bad behavior.
-
add_places(places, ret=False)[source]¶ Add
pyny.Placesto the current space.Parameters: - places (list of pyny.Place) – Places to add.
- ret (bool) – If True, returns the whole updated Space.
Returns: None,
pyny.SpaceWarning
This method acts inplace.
-
add_spaces(spaces, ret=False)[source]¶ - Add
pyny.Spacesto the current space. In other words, it - merges multiple
pyny.Spacesin this instance.
Parameters: - places (list of pyny.Spaces) –
pyny.Spacesto add. - ret (bool) – If True, returns the whole updated Space.
Returns: None,
pyny.SpaceWarning
This method acts inplace.
- Add
-
explode()[source]¶ Collects all the polygons, holes and points in the Space packaged in a list. The returned geometries are not in pyny3d form, instead the will be represented as ndarrays.
Returns: The polygons, the holes and the points. Return type: list
-
explode_map(map_)[source]¶ Much faster version of
pyny.Space.explode()method for previously lockedpyny.Space.Parameters: map (ndarray (shape=(N, 3))) – the points, and the same order, that appear at pyny.Space.get_map(). There is no need for the index if locked.Returns: The polygons, the holes and the points. Return type: list See also
-
get_domain()[source]¶ Returns: opposite vertices of the bounding prism for this object. Return type: ndarray([min], [max])
-
get_height(points, edge=True, attach=False, extra_height=0)[source]¶ Launch
pyny.Place.get_height(points)recursively for all thepyny.Place.The points outside the object will have a NaN value in the z column. These point will not be stored but it will be returned.
Parameters: - points (ndarray (shape=(N, 2 or 3))) – list of coordinates of the points to calculate.
- edge (bool) – If True, consider the points in the Polygon’s edge inside the Polygon.
- attach (bool) – If True, stores the computed points along with the Place’s set of points.
- extra_height (float) – Adds an extra height (z value) to the resulting points.
Returns: (x, y, z)
Return type: ndarray
-
get_map()[source]¶ Collects all the points coordinates from this
pyny.Spaceinstance.In order to keep the reference, it returns an index with the following key:
The first column is the Place.
- The second column is the body (-1: points, 0: surface,
n: polyhedron)
The third column is the polygon (-n: holes)
The fourth column is the point.
Returns: [index, points] Return type: list of ndarray Note
This method automatically stores the solution in order to do not repeat calculations if the user needs to call it more than once.
See also
-
get_plotable3d()[source]¶ Returns: matplotlib Poly3DCollection Return type: list of mpl_toolkits.mplot3d
-
get_polygons()[source]¶ Collects all polygons for the Places in the Space.
Returns: The polygons which form the whole pyny.Space.Return type: list of pyny.Polygon
-
get_seed()[source]¶ Collects the required information to generate a data estructure that can be used to recreate exactly the same geometry object via **kwargs.
Returns: Object’s sufficient info to initialize it. Return type: dict See also
-
get_sets_index()[source]¶ Returns a one dimension array with the Place where the points belong.
Returns: The pyny.Placewhere the points belong.Return type: list of int
-
get_sets_of_points()[source]¶ - Collects all the sets of points for the Places contained in the
- Space.
Returns: An array with the points of all pyny.Placeswhich form thispyny.Space.Return type: ndarray (shape=(N, 3))
-
iplot(places=-1, c_poly='default', c_holes='default', c_sop='r', s_sop=25, extra_height=0, ret=False, ax=None)[source]¶ Improved plot that allows to visualize the Places in the Space selectively. It also allows to plot polygons and holes in different colors and to change the size and the color of the set of points.
The points can be plotted accordingly to a ndarray colormap.
Parameters: - places (int, list or ndarray) – Indexes of the Places to visualize.
- c_poly (matplotlib color, ‘default’ or ‘t’ (transparent)) – Polygons color.
- c_holes (matplotlib color, ‘default’ or ‘t’ (transparent)) – Holes color.
- c_sop (matplotlib color or colormap) – Set of points color.
- s_sop (float or ndarray) – Set of points size.
- ret (bool) – If True, returns the figure. It can be used to add more elements to the plot or to modify it.
- ax (mplot3d.Axes3D, None) – If a matplotlib axes given, this method will represent the plot on top of this axes. This is used to represent multiple plots from multiple geometries, overlapping them recursively.
Returns: None, axes
Return type: None, mplot3d.Axes3D
-
lock()[source]¶ Precomputes some parameters to run faster specific methods like Surface.classify. This method is automatically launched before shadows computation.
Returns: None
-
map2pyny(map_)[source]¶ - Returns a different version of this
pyny.Spaceusing an - altered map.
Parameters: map (ndarray (shape=(N, 3))) – the points, and the same order, that appear at pyny.Space.get_map().Returns: pyny.SpaceSee also
- Returns a different version of this
-
map2seed(map_)[source]¶ Returns a seed from an altered map. The map needs to have the structure of this
pyny.Space, that is, the same asself.get_map().Parameters: map (ndarray (shape=(N, 3))) – the points, and the same order, that appear at pyny.Space.get_map().Returns: pyny.Spaceseed.Return type: dict See also
-
matrix(x=(0, 0), y=(0, 0), z=(0, 0), inplace=True)[source]¶ Copy the
pyny.Spacealong a 3D matrix given by the three tuples x, y, z:Parameters: - x (tuple (len=2)) – Number of copies and distance between them in this direction.
- inplace (bool) – If True, the moved
pyny.Spaceis copied and added to the currentpyny.Space. If False, it returns the newpyny.Space.
Returns: None,
pyny.Space
-
mesh(mesh_size=1, extra_height=0.1, edge=True, attach=True)[source]¶ Launch pyny.Place.mesh(points) recursively for all the
pyny.Placeindividually.Parameters: Returns: (x, y, z)
Return type: ndarray
-
mirror(axes='x', inplace=False)[source]¶ Generates a symmetry of the Space respect global axes.
Parameters: Returns: None,
pyny.Space
-
move(d_xyz, inplace=False)[source]¶ Translate the whole Space in x, y and z coordinates.
Parameters: - d_xyz (tuple (len=2 or 3)) – displacement in x, y(, and z).
- inplace (bool) – If True, the moved
pyny.Spaceis copied and added to the currentpyny.Space. If False, it returns the newpyny.Space.
Returns: None,
pyny.Space
-
photo(azimuth_zenit, plot=False)[source]¶ Computes a change of the reference system for the whole
pyny.Spaceto align the y axis with a given direction. Returns its elements (polygons, holes, points) extracted in a list.In its conception, this method was created as a tool for the shadows computation to calculate “what is in front and what is behind to the look of the Sun”. For this reason, the direction is given in spherical coordinates by two angles: the azimth and the zenit.
- The azimuth is zero when pointing to the South, -pi/4 to the East, pi/4 to the West and pi/2 to the North.
- The zenit is zero at the ground level and pi/4 “pointing completely orthogonal to the sky”.
In short, this methods answer “How would the
pyny.Spacelook in a photograph taken from an arbitrary direction in cylindrical perpective?”The photograph has a new reference system: x, y, depth. The sign of the new depth coordinate has to be checked before assuming what is closer and what is further inasmuch as it changes depending on the direction of the photo.
Parameters: Returns: Exploded
pyny.SpaceReturn type: Note
Before assume that this method do exactly what it is supposed to do, it is highly recommended to visualy verify throught the plot=True argument. It is easy to introduce the angles in a different sign criteria, among other frequent mistakes.
-
rotate(angle, direction='z', axis=None)[source]¶ Returns a new Space which is the same but rotated about a given axis.
If the axis given is
None, the rotation will be computed about the Space’s centroid.Parameters: Returns: pyny.Space
-
seed2pyny(seed)[source]¶ Re-initialize an object with a seed.
Returns: A new pyny.SpaceReturn type: pyny.SpaceSee also
-
shadows(data=None, t=None, dt=None, latitude=None, init='empty', resolution='mid')[source]¶ Initializes a ShadowManager object for this
pyny.Spaceinstance.The ‘empty’ initialization accepts
dataandtanddtbut the ShadowsManager will not start the calculations. It will wait the user to manually insert the rest of the parameters. CallShadowsManager.run()to start the shadowing computations.The ‘auto’ initialization pre-sets all the required parameters to run the computations*. The available resolutions are:
- ‘low’
- ‘mid’
- ‘high’
The ‘auto’ mode will use all the arguments different than
Noneand theset_of_pointsof thispyny.Spaceif any.Parameters: - data (ndarray (shape=N), None) – Data timeseries to project on the 3D model (radiation, for example).
- t (ndarray or list, None) – Time vector in absolute minutes or datetime objects
- dt (int, None) – Interval time to generate t vector.
- latitude (float (radians)) – Local latitude.
- init (str) – Initialization mode
- init – Resolution for the time vector generation (if
None), for setting the sensible points and for the Voronoi diagram.
Returns: ShadowsManagerobject
*root
-
class
pyny3d.geoms.root[source]¶ Lowest geometry class in hierarchy. Actually do nothig but store two general methods for the real classes:
Other Global methods (but individually defined in each class) are:
- get_seed
- seed2pyny
- get_domain
-
center_plot(ax)[source]¶ Centers and keep the aspect ratio in a 3D representation.
Created to help higher classes to manage cascade representation of multiple lower objects.
Parameters: ax (mplot3d.Axes3D) – Axes to apply the method. Returns: None
-
get_centroid()[source]¶ The centroid is considered the center point of the circunscribed paralellepiped, not the mass center.
Returns: (x, y, z) coordinates of the centroid of the object. Return type: ndarray
-
plot(color='default', ret=False, ax=None)[source]¶ Generates a basic 3D visualization.
Parameters: - color (matplotlib color, ‘default’ or ‘t’ (transparent)) – Polygons color.
- ret (bool) – If True, returns the figure. It can be used to add more elements to the plot or to modify it.
- ax (mplot3d.Axes3D, None) – If a matplotlib axes given, this method will represent the plot on top of this axes. This is used to represent multiple plots from multiple geometries, overlapping them recursively.
Returns: None, axes
Return type: mplot3d.Axes3D, bool
shadows module
ShadowsManager
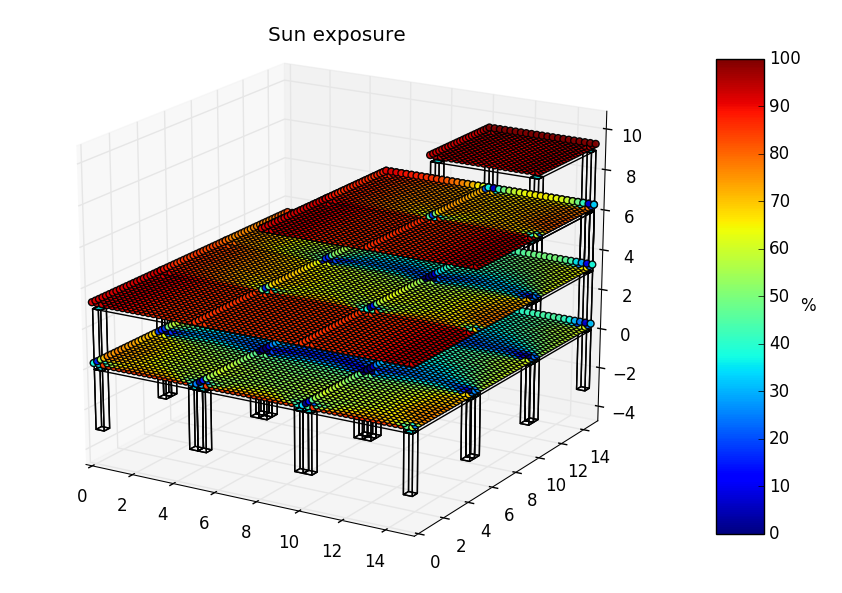
Example of a shading computation for a four-storey simple structure.
-
class
pyny3d.shadows.ShadowsManager(space, data=None, t=None, dt=None, latitude=None)[source]¶ Class in charge of the management for the shadows simulations.
It can be initialize as standalone object or associated to a
pyny.Spacethrough the.shadowmethod.The only argument needed for the simulator to run is
tordtand thelatitude. If the ShadowsManager is initialized frompyny.Space.shadowsit is possible to run the execution in auto mode without inputing anything.Some explanaions about how it works:
The shadows are computed discretely using a set of distributed sensible points through the model. These points can be set with the
.get_height(attach=True)or the.mesh()methods.At the same time, the sun positions are also discretized. The simulator needs a finite number of positions, given by their azimuth and zenit. Anyway, it is more convenient to give it a time vector and the latitude and let the program calculate the sun positions for you.
For convenience, the time is managed in “absolute minutes” within the range of a year in the computations, that is, the first possible interval [0] is the Jan 1 00:00 and the last [525599] is Dec 31 23:59. February 29 is not taken into account. It is possible to automatically create an equally spaced t vector by giving a fixed interval, althought the inputed vectors an be irregular.
In view of the fact that there are, potentially, more than 8000 sunnys half-hour intervals in an year, the program precomputes a discretization for the Solar Horizont (azimuth, zenit pairs) and classify the t and data vectors. The goal is to approximate these 8000 interval simulations to a less than 340 with an maximum error of 3 deg (0.05rads).
This discretization is manually* adjustable to be able to fastly compute large datasets at low resolution before the serious computations start.
For now, the Solar Horizont discretization can only be automatically computed by a mesh. In the future more complex and convenient discretizations will be available. Anyway, it is possible to input a custom discretization by manually introducing the atributtes described in
Voronoi_SH().Finally,
the atributes which can be safely manipulated to tune up the simulator before the computations are all which start with arg_ (= default values):
.arg_data
.arg_t
.arg_dt
.arg_latitude = None
.arg_run_true_time = False
.arg_longitude = None (only for
true_time).arg_UTC = None (only for
true_time)- .arg_zenitmin = 0.1 (minimum zenit, avoid irrelevant errors
from trigonometric approximations)
.arg_vor_size = 0.15 (mesh_size of the Voronoi diagram)
Parameters: - space (
pyny.Space) – 3D model to run the simulation. - data (ndarray (shape=N), None) – Data timeseries to project on the 3D model (radiation, for example).
- t (ndarray or list, None) – Time vector in absolute minutes or datetime objects
- dt (int, None) – Interval time to generate t vector.
- latitude (float (radians)) – Local latitude.
Returns: None
Note
* In the future, the discretizations will be automated based on error adjustment.
Warning
The shadows computation do not take care of the holes*, instead, they can be emulated by a collection of polygons.
-
Vonoroi_SH(mesh_size=0.1)[source]¶ Generates a equally spaced mesh on the Solar Horizont (SH).
Computes the Voronoi diagram from a set of points given by pairs of (azimuth, zenit) values. This discretization completely covers all the Sun positions.
The smaller mesh size, the better resolution obtained. It is important to note that this heavily affects the performance.
- The generated information is stored in:
- .t2vor_map (ndarray): Mapping between time vector and the Voronoi diagram.
- .vor_freq (ndarray): Number of times a Sun position is inside each polygon in the Voronoi diagram.
- .vor_surf (``pyny.Surface``): Voronoi diagram.
- .vor_centers (ndarray`): Mass center of the
pyny.Polygonsthat form the Voronoi diagram.
Parameters: - mesh_size (float (in radians)) – Mesh size for the square discretization of the Solar Horizont.
- plot (bool) – If True, generates a visualization of the Voronoi diagram.
Returns: None
Note
In future versions this discretization will be improved substantially. For now, it is quite rigid and only admits square discretization.
-
compute_shadows()[source]¶ Computes the shadoing for the
pyny.Spacestored in.spacefor the time intervals and Sun positions stored in.arg_tand.sun_pos, respectively.- The generated information is stored in:
- .light_vor (ndarray (dtype=bool)): Array with the
points in
pyny.Spaceas columns and the discretized Sun positions as rows. Indicates whether the points are illuminated in each Sun position. - .light (ndarray (dtype=bool)): The same as
.light_vorbut with the time intervals in.arg_tas rows instead of the Sun positions.
- .light_vor (ndarray (dtype=bool)): Array with the
points in
Returns: None
-
get_sunpos(t, true_time=False)[source]¶ Computes the Sun positions for the t time vector.
t have to be in absolute minutes (0 at 00:00 01 Jan). The and in Sun positions calculated are in solar time, that is, maximun solar zenit exactly at midday.
- The generated information is stored in:
- .azimuth_zenit (ndarray)
- .true_time (datetime): local time
Parameters: - t (ndarray (dtype=int)) – Absolute minutes vector.
- true_time (bool) – If True, a datetime vector with the true local
time will be stored at
.true_time
Returns: Equivalent times in absolute minutes in year.
Return type: ndarray (dtype=int)
Returns: None
See also
to_minutes()to easily genetare valid input t.
-
project_data()[source]¶ Assign the sum of
.integral* to each sensible point in thepyny.Spacefor the intervals that the points are visible to the Sun.- The generated information is stored in:
- .proj_vor (ndarray):
.integralprojected to the Voronoi diagram.
- .proj_vor (ndarray):
- .proj_points (ndarray):
.integralprojected to the sensible points in the
pyny.Space.
- .proj_points (ndarray):
Returns: None Note
* Trapezoidal data (
.arg_data) integration over time (.arg_t).
-
run()[source]¶ Run the shadowing computation with the values stored in
self.arg_. Precomputed information is stored in:- .diff_t (ndarray):
np.diff(t) - .integral (ndarray): Trapezoidal data integration over time.
The steps are:
Retruns: None - .diff_t (ndarray):
-
static
to_minutes(time_obj=None, dt=None)[source]¶ Converts
datetimeobjects lists into absolute minutes vectors. It also can be used to generate absolute minutes vector from a time interval (in minutes).Parameters: - time_obj (list of
datetimeobjects) –datetimeobjects to convert into absolute minutes. - dt (int) – Constant interval time to generate a time vector for a whole year.
Returns: Equivalent times in absolute minutes in year.
Return type: ndarray (dtype=int)
Note
If the time_obj has times higher than 23:59 31 Dec, they will be removed.
Note
If a leap-year is introduced, the method will remove the last year (31 Dec) in order to keep the series continuous.
- time_obj (list of
Viz
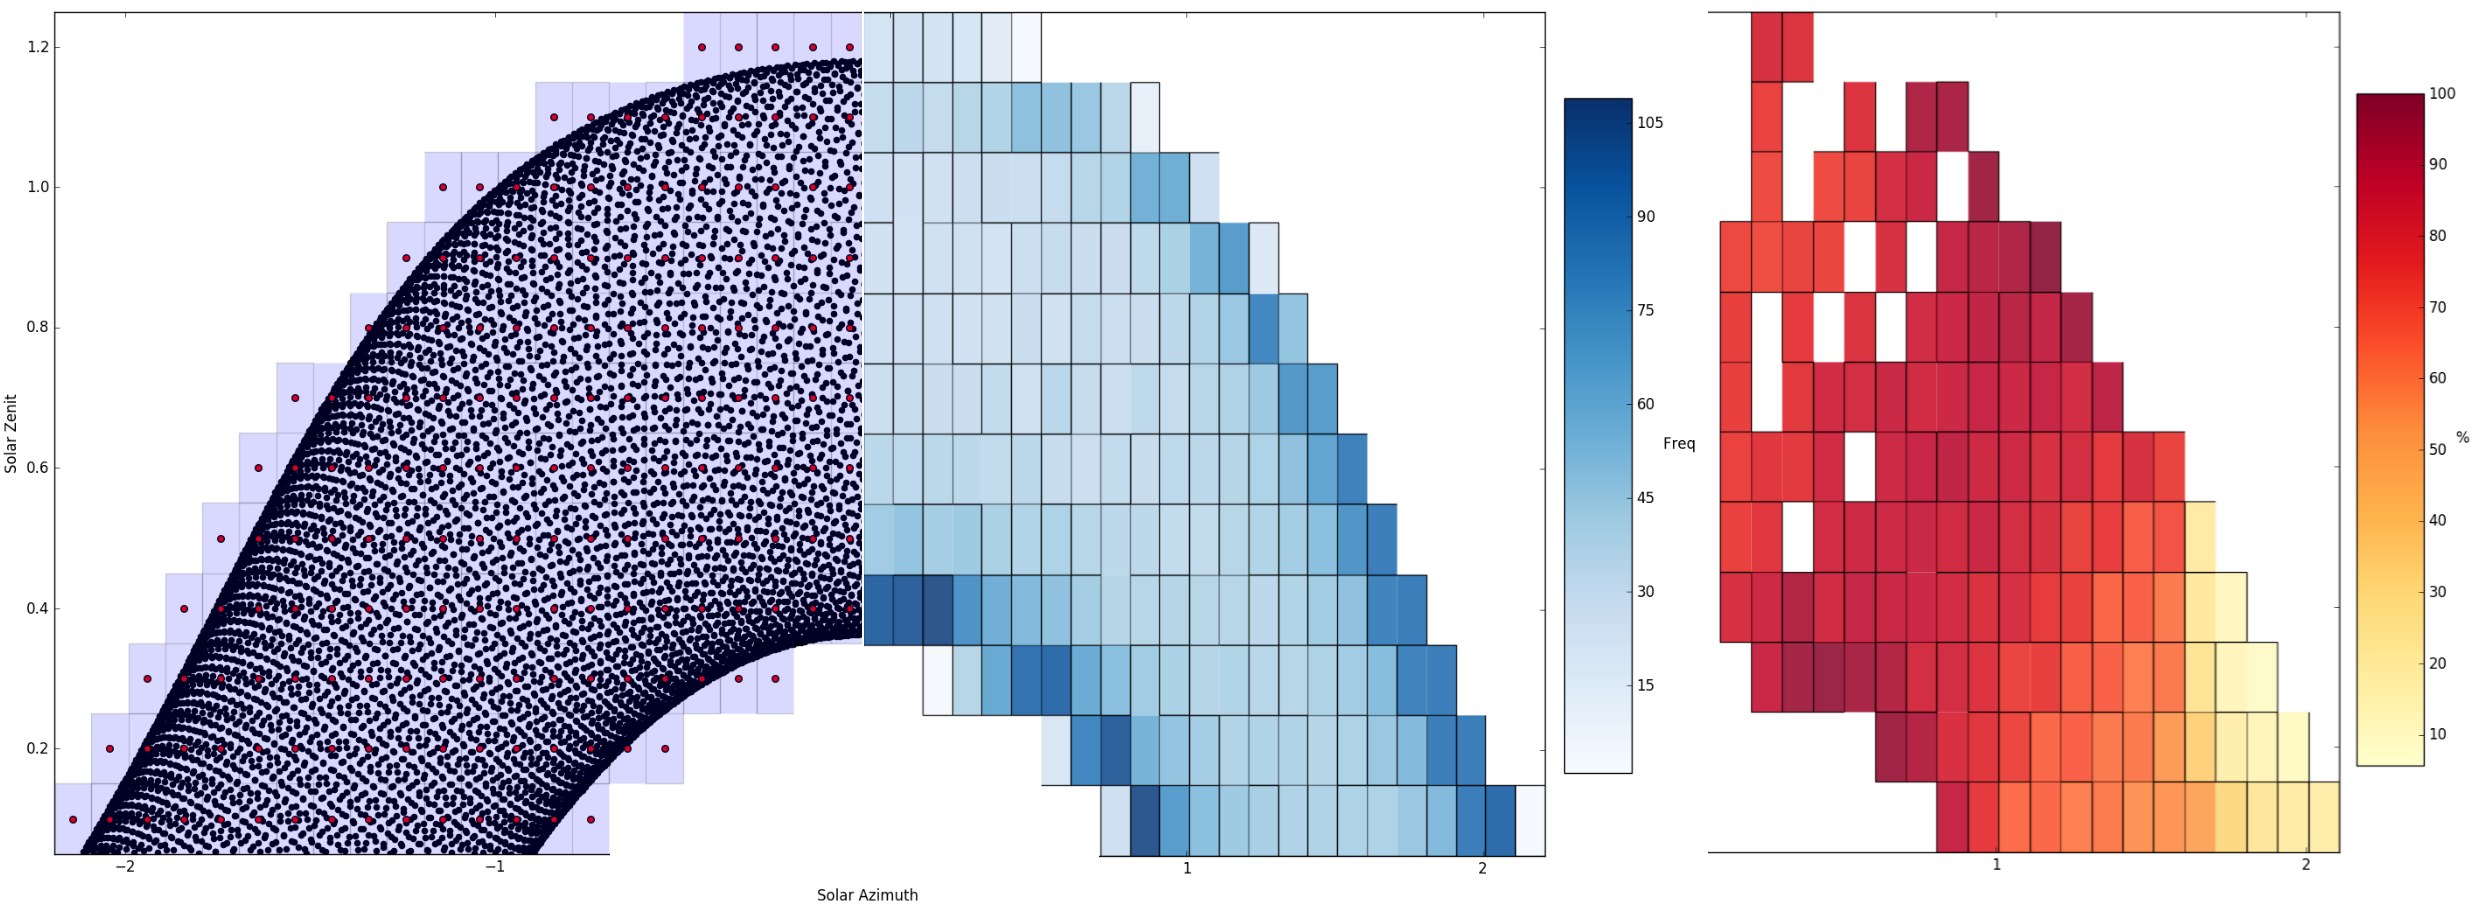
Examples of visualizations. Left to right: Voronoi diagram of the Solar Horizont, Frequency of Sun positions in the diagram and timeseries data projected to the diagram.
-
class
pyny3d.shadows.Viz(ShadowsMaganer)[source]¶ This class stores the visualization methods. It is linked with the ShadowsManager class by its attribute
.viz.Parameters: ShadowsMaganer – ShadowsMaganer instance to compute the visualizations. Returns: None -
exposure_plot(places=-1, c_poly='default', c_holes='default', s_sop=25, extra_height=0.1)[source]¶ Plots the exposure of the sensible points in a space to the data and the Sun positions. It is required to previously compute the shadowing.
If the computation has been made with a data timeseries, the plot will have a colorbar. Units are accumulated kilounits*hour (for the series), that is, if the input data is in Watts (irradiation) for a whole year, the output will be kWh received in an entire year.
If there is no data inputed, the plot will show only the number of times each point “has been seen by the Sun” along the series.
Parameters: - places (int or list) – Indexes of the places to plot. If -1, plots all.
- c_poly (matplotlib color, ‘default’ or ‘t’ (transparent)) – Polygons color.
- c_holes (matplotlib color, ‘default’ or ‘t’ (transparent)) – Holes color.
- s_sop (float or ndarray) – Set of points size.
- extra_height (float) – Extra elevation for the points in the plot.
Returns: None
-
vor_plot(which='vor')[source]¶ Voronoi diagram visualizations. There are three types:
vor: Voronoi diagram of the Solar Horizont.
- freq: Frequency of Sun positions in t in the Voronoi
diagram of the Solar Horizont.
- data: Accumulated time integral of the data projected
in the Voronoi diagram of the Solar Horizont.
Parameters: which (str) – Type of visualization. Returns: None
-
utils auxiliar module
-
pyny3d.utils.arange_col(n, dtype=<class 'int'>)[source]¶ Returns
np.arangein a column form.Parameters: Returns: np.arangein a column form.Return type: ndarray
-
pyny3d.utils.bool2index(bool_)[source]¶ Returns a numpy array with the indices where bool_ is True.
Parameters: bool (ndarray (type=bool)) – bool array to extract Trues positions. Returns: Array with the indices where bool_ is True. Return type: ndarray See also
-
pyny3d.utils.index2bool(index, length=None)[source]¶ Returns a numpy boolean array with Trues in the input index positions.
Parameters: - index (ndarray (type=int)) – index array with the Trues positions.
- length (int or None) – Length of the returned array.
Returns: array with Trues in the input index positions.
Return type: ndarray
See also