1. colormap module
matplotlib colormap builder from R colormaps
| author: | Thomas Cokelaer <cokelaer@ebi.ac.uk> |
|---|---|
| copyright: | Copyright (c) 2012. GPL |
- class RColorMap(name, inverse=True)[source]
Build a colormap from a R colormap that is compatible with matplotlib
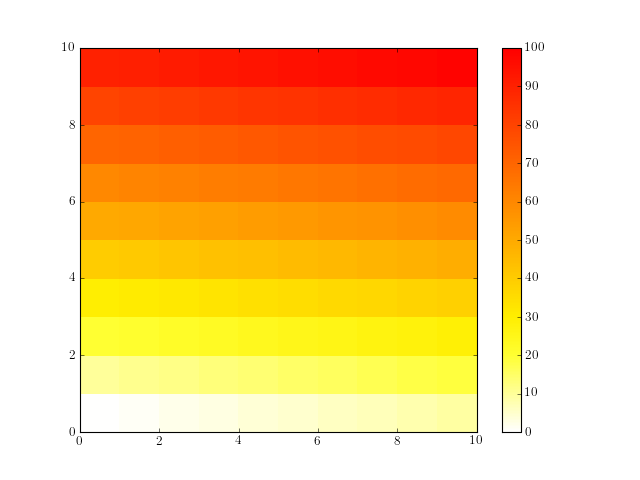
# first build the colormap
from rtools import RColorMap
rmap = RColorMap("heat")
cmap = rmap.colormap()

# use it within matplotlib
try:
    import numpy as np
    import pylab as plt
    A = np.array(range(100))
    A.shape = (10,10)
    plt.pcolor(A,cmap=cmap, vmin=0, vmax=100)
    plt.colorbar()
except:
    pass
(Source code, png, hires.png, pdf)
constructor
Parameters: - name (str) – valid R colormap (e.g., heat)
- inverse (bool) – inverse the colormap colors
Note
Internally, the number of color used in the R colorbar is 1000, which may be changed with the rN attribute. The number of color used by matplotlib to perform the linear interpolation is set to 11 with the attribute n. There is no need t change these 2 attributes in most cases.
- b
return the blue componennt in hexadecimal
- colormap(N=256)[source]
Return the colormap with N values.
Parameters: N (int) – number of colors in the final colormap (default is 256)
- g
return the green componennt in hexadecimal
- name
- r
return the red componennt in hexadecimal
- rgb
return the RGB color in hexadecimal
- xvalues
return the indices of the colors.
2. error module
Module that provides easy access to error and warning messages returned by R
| author: | Thomas Cokelaer <cokelaer@ebi.ac.uk> |
|---|---|
| copyright: | Copyright (c) 2012. GPL |
3. package module
Utilities for cnolab.wrapper
| author: | Thomas Cokelaer <cokelaer@ebi.ac.uk> |
|---|---|
| license: | Copyright (c) 2012. GPL |
- class RPackage(name, require='0.0', install=False, verbose=False)[source]
simple class to import a R package as an object
from rtools.package import RPackage
r = RPackage("CellNOptR")
r.version
r.package
# no error returned but only info and error based on logging module.
Constructor
Parameters: - name (str) – name of a R package installed on your system
- require (str) – the minimal version required. Use valid string format such as “1.0.0” or “1.0”
The required package is loaded in the constructor. If not found in your system, and if install is set to True, it will try to install it from bioconductor web site. If not found, nothing happens but the package is None. If you want to install a package from source, use the install_packages function.
- version
- biocLite(package=None, suppressUpdates=True)[source]
Install a bioconductor package
This function does not work like the R function. Only a few options are implmented so far. However, you can use rcode function directly if needed.
Parameters: - package (str) – name of the bioconductor package to install. If None, no package is installed but installed packages are updated.
- suppressUpdates (bool) – updates the dependencies if needed (default is False)
Returns: True if update is required or the required package is installed and could be imported. False otherwise.
>>> from rcode import biocLite
>>> biocLite("CellNOptR")
- install_packages(query, dependencies=False, verbose=True, repos=None)[source]
Install a R package
Parameters: - query (str) – It can be a valid URL to a R package (tar ball), a CRAN package, a path to a R package (tar ball), or simply the directory containing a R package source.
- dependencies (bool) –
- repos – if provided, install_packages automatically select the provided repositories otherwise a popup window will ask you to select a repo
>>> rtools.install_packages("path_to_a_valid_Rpackage.tar.gz")
>>> rtools.install_packages("http://URL_to_a_valid_Rpackage.tar.gz")
>>> rtools.install_packages("hash") # a CRAN package
>>> rtools.install_packages("path to a valid R package directory")
- class RPackageManager[source]
Implements a R package manager from Python
So far you can install a package (from source, or CRAN, or biocLite)
pm = PackageManager()
[(x, pm.installed[x][2]) for x in pm.installed.keys()]
- available
- biocLite(packageName=None, suppressUpdates=True)[source]
Installs one or more biocLite packages
Parameters: packageName – a package name (string) that will be installed from BioConductor. Several package names can be provided as a list. If packageName is set to None, all packages already installed will be updated.
- cran_repos = 'http://cran.univ-lyon1.fr/'
- install(pkg, require=None)[source]
install a package automatically scanning CRAN and biocLite repos
- install_packages(packageName, dependencies=True, repos=None, type=None)[source]
Installs one or more CRAN packages
- installed
- packageStatus(repos=None, verbose=True)[source]
Returns the output of packageStatus R function call
Parameters: repos (str) – a character vector of URLs describing the location of R package repositories on the Internet or on the local machine. Returns: an R object res[0] and ares[1] gives exhaustive information about the installed.packages
- packages
- require(pkg, version)
Check if a package with given version is available
4. tools module
Utilities for cnolab.wrapper
| author: | Thomas Cokelaer <cokelaer@ebi.ac.uk> |
|---|---|
| licence: | copyright (2012). GPL |
- Rnames2attributes(f)[source]
Decorator used to create attributes for each variable in a R structure
The RPY2 package allows to call R function in Python. For instance in the case of the base package, you can compute the mean of a vector.
>>> from rtools import RPackage, convertor
>>> base = RPackage("base").package
>>> m =  float(base.mean(convertor([1,2,3])))
2.0
In more complex example, list are returned. For instance in CellNOptR package, the function readMIDAS returns a list. The names attribute is useful to access the output of CNOR.readMIDAS function:
>>> m.names
<StrVector - Python:0x339c680 / R:0x34113a8>
['dataMatrix', 'TRcol', 'DAcol', 'DVcol']
Then, knowing the name of a variable, you can access any field using this command:
>>> m.rx2('DAcol')
<FloatVector - Python:0x339c128 / R:0x7fab5c721518>
[5.000000, 6.000000, 7.000000, ..., 9.000000, 10.000000, 11.000000]
This is not very convenient. This decorator wraps a R function so that the variables in names can be accessible directly as READ ONLY attributes:
>>> @Rnames2attributes
>>> def readMIDAS(file):
...     return CNOR.readMIDAS(file)
>>> m = readMIDAS(file)
>>> m.DAcol
<FloatVector - Python:0x339c128 / R:0x7fab5c721518>
[5.000000, 6.000000, 7.000000, ..., 9.000000, 10.000000, 11.000000]
Warning
this is not recursive. So only the first level is accessible with attributes.
- buildDocString(base, name)[source]
scan manual from a R function and transform it into a docstring.
See also
rtools.rools.RManualToDocString
- class RManualToDocString(package, funcname)[source]
Reads R manual and convert to Sphinx doc string.
>>> d = RManualToDocString("base", "abbreviate")
>>> d.get_docstring()
- process(section)[source]
Convert R section into proper Sphinx section
>>> sections = d.sections
>>> d.process(sections[0])
>>> # equivalent to
>>> d.process("title")
This is where most of the processing of the Rdoc to sphinx docstring is done.
- registered_sections = ['title', 'name', 'alias', 'description', 'usage', 'arguments', 'details', 'value', 'author', 'note', 'references', 'seealso', 'examples', 'keyword']
List of valid known arguments from Rdoc
- sections
property containing all sections found in the Rdoc
- class RConvertor[source]
The RConverter ease the conversion of python objects into R objects.
r = Convertor() r.convert(None) r.convert([1,2,3])
See convert() for details
- convert(data, forcetype=None)[source]
convert simple python object to R object
Parameters: - data – the data to convert
- forcetype – if data is a list, by default, the conversion is made according to the type of the first element of the list. You can force the type to be different with this argument (e.g., forcetype=str)
if data is None, return a R object NULL
- if data is a list or a tuple:
- if type of first element is integer, returns a IntVector
- if type of first element is float, returns a FloatVector
- if type of first element is str, returns a StrVector
- if type of first element is complex, returns a ComplexVector
- if type of first element is bool, returns a BoolVector
else return the data itself (assume it is already a R object)
- convertor = <bound method RConvertor.convert of <rtools.tools.RConvertor object at 0x58baf10>>
alias to the method convert of RConvertor class
6. plots module
- class Rplot(show=True, output=None, **kargs)[source]
Plots and/or save a R plot into a file.
This class allows to easily call a plotting function directly from R and/or to save the results into a file by opening and closing the requested device.
from rtools import *
rp = Rplot(show=True, output="test.png")
rp.rcode("plot(c(1,2))")

# The function python_func_example calls the R plot function as above
# but embedded within a python function.
rp = Rplot(show=True, output="test2.png")
rp.pythoncode("python_func_example()")
Todo
cleanup and make more robust.
Parameters: - show (bool) – show the plot or not (default is True)
- output (str) – filename with valid extension (png, pdf, jpg, jpeg, tiff, bmp)
- kargs – all valid optional parameters (e.g., width, height, quality). See R documentation for exact list of arguments