Metaseq

Briefly, the goal of metaseq is to tie together lots of existing software into a framework for exploring genomic data. It focuses on flexibility and interactive exploration and plotting of disparate genomic data sets.
The main documentation for metaseq can be found at http://packages.python.org/metaseq/.
If you use metaseq in your work, please cite the following publication:
Dale, R. K., Matzat, L. H. & Lei, E. P. metaseq: a Python package for integrative genome-wide analysis reveals relationships between chromatin insulators and associated nuclear mRNA. Nucleic Acids Res. 42, 9158–9170 (2014). http://www.ncbi.nlm.nih.gov/pubmed/25063299
Example 1: Average ChIP-seq signal over promoters
Example 1 walks you through the creation of the following heatmap and line-plot figure:
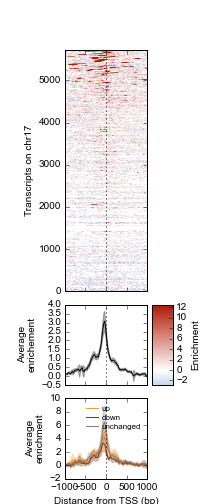
Top: Heatmap of ATF3 ChIP-seq signal over transcription start sites (TSS) on chr17 in human K562 cells. Middle: average ChIP enrichment over all TSSs +/- 1kb, with 95% CI band. Bottom: Integration with ATF3 knockdown RNA-seq results, showing differential enrichment over transcripts that went up, down, or were unchanged upon ATF3 knockdown.
Example 2: Differential expression scatterplots
Example 2 walks you through the creation of the following scatterplot and marginal histogram figure:
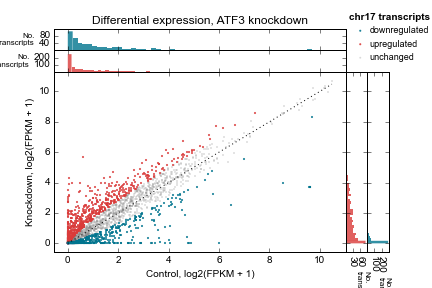
Control vs knockdown expression (log2(FPKM + 1)) for an ATF3 knockdown experiment. Each point represents one transcript on chromosome 17. Marginal distributions are shown on top and side. 1:1 line shown as a dotted line. Up- and downregulated genes determined by a simple 2-fold cutoff.
Other features
In addition, metaseq offers:
- A format-agnostic API for accessing “genomic signal” that allows you to work with BAM, BED, VCF, GTF, GFF, bigBed, and bigWig using the same API.
- Parallel data access from the file formats mentioned above
- “Mini-browsers”, zoomable and pannable Python-only figures that show genomic signal and gene models and are spawned by clicking on features of interest
- A wrapper around pandas.DataFrames to simplify the manipulation and plotting of tabular results data that contain gene information (like DESeq results tables)
- Integrates data keyed by genomic interval (think BAM or BED files) with data keyed by gene ID (e.g., Cufflinks or DESeq results tables)
Check out the full documentation for more.
Some use-cases for metaseq:
- Create NumPy arrays (which can be plotted as heatmaps) where each row represents a feature (say, TSS +/- 1kb) at fairly high speed. The actual speed is highly dependent on your data, but a rule of thumb is that it takes about 10s for every 10,000 2-kb features. Once you have the heatmap, you can sort, cluster, zoom, and pan to explore interesting groups. See the CTCF example for more on this as well as the metaseq.genomic_signal module.
- “Mini-browsers”. Instead of tweaking something, then laboriously converting to bedGraph, then bigWig, uploading your tracks to the genome browser, then searching for the region of interest, you can can just connect a mini-browser to your raw data and spawn figures locally. See the example_session for more on this as well as the metaseq.minibrowser API docs.
- Cluster genes based on the spatial distribution of ChIP-seq peaks around their TSSs.
- Scatter plot of DESeq results (basemeana vs basemeanb) where points are colored according to the number of ChIP peaks in the gene. This, too, can be attached to mini-browsers, enabling you to click on a point to see the genomic signal. See the metaseq.results_table module for more on this.
- Pie charts of where peaks fall within annotated genes – TSS, poly-A site, intron, exon, etc. See the metaseq.integration module for more on this.
Where possible, the inputs are standard formats – BED, GFF, GTF, BAM, SAM, DESeq results as saved from R, or even arbitrary tab-delimited data files that have a header. If you take the time to convert to bigWig or bigBed, performance will be improved.
Contents: