Package winappdbg :: Module textio :: Class CrashDump
[hide private]
[frames] | no frames]

Class CrashDump

source code


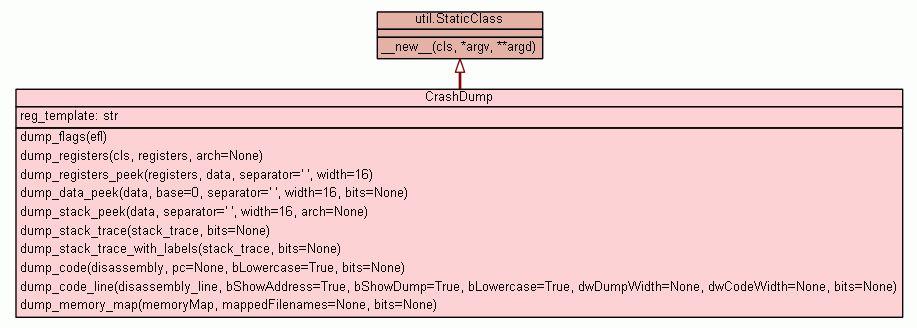
Static functions for crash dumps.

Instance Methods [hide private]

Inherited from object: __delattr__, __format__, __getattribute__, __hash__, __init__, __reduce__, __reduce_ex__, __repr__, __setattr__, __sizeof__, __str__, __subclasshook__

Class Methods [hide private]
str
dump_registers(cls, registers, arch=None)
Dump the x86/x64 processor register values.
source code
Static Methods [hide private]
str
dump_flags(efl)
Dump the x86 processor flags.
source code
str
dump_registers_peek(registers, data, separator=' ', width=16)
Dump data pointed to by the given registers, if any.
source code
str
dump_data_peek(data, base=0, separator=' ', width=16, bits=None)
Dump data from pointers guessed within the given binary data.
source code
str
dump_stack_peek(data, separator=' ', width=16, arch=None)
Dump data from pointers guessed within the given stack dump.
source code
str
dump_stack_trace(stack_trace, bits=None)
Dump a stack trace, as returned by Thread.get_stack_trace with the bUseLabels parameter set to False.
source code
str
dump_stack_trace_with_labels(stack_trace, bits=None)
Dump a stack trace, as returned by Thread.get_stack_trace_with_labels.
source code
str
dump_code(disassembly, pc=None, bLowercase=True, bits=None)
Dump a disassembly.
source code
str
dump_code_line(disassembly_line, bShowAddress=True, bShowDump=True, bLowercase=True, dwDumpWidth=None, dwCodeWidth=None, bits=None)
Dump a single line of code.
source code
str
dump_memory_map(memoryMap, mappedFilenames=None, bits=None)
Dump the memory map of a process.
source code
a new object with type S, a subtype of T
__new__(cls, *argv, **argd)
Don't try to instance this class, just use the static methods. (Inherited from winappdbg.util.StaticClass)
Class Variables [hide private]
str reg_template = {'amd64': 'rax=%(Rax).16x rbx=%(Rbx).16x rcx=%(...
Template for the dump_registers method.
Properties [hide private]

Inherited from object: __class__

Method Details [hide private]

dump_flags(efl)
Static Method

source code 

Dump the x86 processor flags. The output mimics that of the WinDBG debugger. Used by dump_registers.

Parameters:
  • efl (int) - Value of the eFlags register.
Returns: str
Text suitable for logging.

dump_registers(cls, registers, arch=None)
Class Method

source code 

Dump the x86/x64 processor register values. The output mimics that of the WinDBG debugger.

Parameters:
  • registers (dict( str → int )) - Dictionary mapping register names to their values.
  • arch (str) - Architecture of the machine whose registers were dumped. Defaults to the current architecture. Currently only the following architectures are supported:
Returns: str
Text suitable for logging.

dump_registers_peek(registers, data, separator=' ', width=16)
Static Method

source code 

Dump data pointed to by the given registers, if any.

Parameters:
  • registers (dict( str → int )) - Dictionary mapping register names to their values. This value is returned by Thread.get_context.
  • data (dict( str → str )) - Dictionary mapping register names to the data they point to. This value is returned by Thread.peek_pointers_in_registers.
Returns: str
Text suitable for logging.

dump_data_peek(data, base=0, separator=' ', width=16, bits=None)
Static Method

source code 

Dump data from pointers guessed within the given binary data.

Parameters:
  • data (str) - Dictionary mapping offsets to the data they point to.
  • base (int) - Base offset.
  • bits (int) - (Optional) Number of bits of the target architecture. The default is platform dependent. See: HexDump.address_size
Returns: str
Text suitable for logging.

dump_stack_peek(data, separator=' ', width=16, arch=None)
Static Method

source code 

Dump data from pointers guessed within the given stack dump.

Parameters:
  • data (str) - Dictionary mapping stack offsets to the data they point to.
  • separator (str) - Separator between the hexadecimal representation of each character.
  • width (int) - (Optional) Maximum number of characters to convert per text line. This value is also used for padding.
  • arch (str) - Architecture of the machine whose registers were dumped. Defaults to the current architecture.
Returns: str
Text suitable for logging.

dump_stack_trace(stack_trace, bits=None)
Static Method

source code 

Dump a stack trace, as returned by Thread.get_stack_trace with the bUseLabels parameter set to False.

Parameters:
  • stack_trace (list( int, int, str )) - Stack trace as a list of tuples of ( return address, frame pointer, module filename )
  • bits (int) - (Optional) Number of bits of the target architecture. The default is platform dependent. See: HexDump.address_size
Returns: str
Text suitable for logging.

dump_stack_trace_with_labels(stack_trace, bits=None)
Static Method

source code 

Dump a stack trace, as returned by Thread.get_stack_trace_with_labels.

Parameters:
  • stack_trace (list( int, int, str )) - Stack trace as a list of tuples of ( return address, frame pointer, module filename )
  • bits (int) - (Optional) Number of bits of the target architecture. The default is platform dependent. See: HexDump.address_size
Returns: str
Text suitable for logging.

dump_code(disassembly, pc=None, bLowercase=True, bits=None)
Static Method

source code 

Dump a disassembly. Optionally mark where the program counter is.

Parameters:
  • disassembly (list of tuple( int, int, str, str )) - Disassembly dump as returned by Process.disassemble or Thread.disassemble_around_pc.
  • pc (int) - (Optional) Program counter.
  • bLowercase (bool) - (Optional) If True convert the code to lowercase.
  • bits (int) - (Optional) Number of bits of the target architecture. The default is platform dependent. See: HexDump.address_size
Returns: str
Text suitable for logging.

dump_code_line(disassembly_line, bShowAddress=True, bShowDump=True, bLowercase=True, dwDumpWidth=None, dwCodeWidth=None, bits=None)
Static Method

source code 

Dump a single line of code. To dump a block of code use dump_code.

Parameters:
  • disassembly_line (tuple( int, int, str, str )) - Single item of the list returned by Process.disassemble or Thread.disassemble_around_pc.
  • bShowAddress (bool) - (Optional) If True show the memory address.
  • bShowDump (bool) - (Optional) If True show the hexadecimal dump.
  • bLowercase (bool) - (Optional) If True convert the code to lowercase.
  • dwDumpWidth (int or None) - (Optional) Width in characters of the hex dump.
  • dwCodeWidth (int or None) - (Optional) Width in characters of the code.
  • bits (int) - (Optional) Number of bits of the target architecture. The default is platform dependent. See: HexDump.address_size
Returns: str
Text suitable for logging.

dump_memory_map(memoryMap, mappedFilenames=None, bits=None)
Static Method

source code 

Dump the memory map of a process. Optionally show the filenames for memory mapped files as well.

Parameters:
Returns: str
Text suitable for logging.

Class Variable Details [hide private]

reg_template

Template for the dump_registers method.
Type:
str
Value:
{'amd64': '''rax=%(Rax).16x rbx=%(Rbx).16x rcx=%(Rcx).16x
rdx=%(Rdx).16x rsi=%(Rsi).16x rdi=%(Rdi).16x
rip=%(Rip).16x rsp=%(Rsp).16x rbp=%(Rbp).16x
 r8=%(R8).16x  r9=%(R9).16x r10=%(R10).16x
r11=%(R11).16x r12=%(R12).16x r13=%(R13).16x
r14=%(R14).16x r15=%(R15).16x
%(efl_dump)s
cs=%(SegCs).4x  ss=%(SegSs).4x  ds=%(SegDs).4x  es=%(SegEs).4x  fs=%(S\
...