import random
import sys
import time
import numpy as np
from qwt.qt.QtGui import QApplication, QPen, QBrush, QMainWindow, QToolBar
from qwt.qt.QtCore import QSize
from qwt.qt.QtCore import Qt
from qwt import QwtPlot, QwtSymbol, QwtPlotCurve
def standard_map(x, y, kappa):
"""provide one interate of the inital conditions (x, y)
for the standard map with parameter kappa."""
y_new = y-kappa*np.sin(2.0*np.pi*x)
x_new = x+y_new
# bring back to [0,1.0]^2
if( (x_new>1.0) or (x_new<0.0) ):
x_new = x_new - np.floor(x_new)
if( (y_new>1.0) or (y_new<0.0) ):
y_new = y_new - np.floor(y_new)
return x_new, y_new
class MapDemo(QMainWindow):
def __init__(self, *args):
QMainWindow.__init__(self, *args)
self.plot = QwtPlot(self)
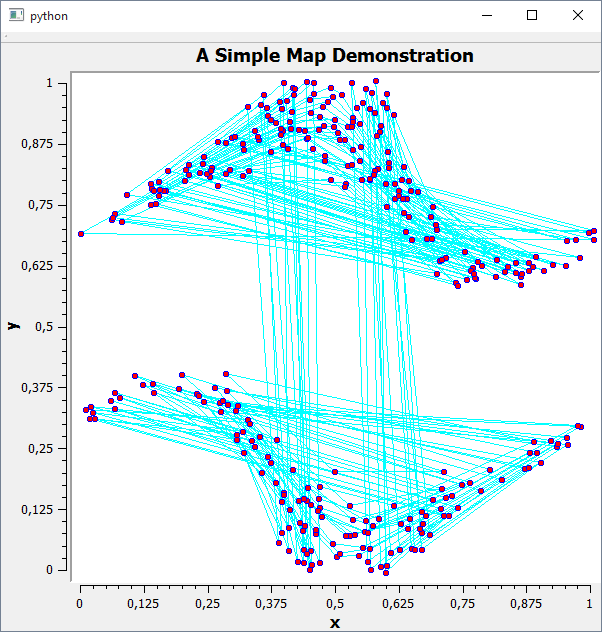
self.plot.setTitle("A Simple Map Demonstration")
self.plot.setCanvasBackground(Qt.white)
self.plot.setAxisTitle(QwtPlot.xBottom, "x")
self.plot.setAxisTitle(QwtPlot.yLeft, "y")
self.plot.setAxisScale(QwtPlot.xBottom, 0.0, 1.0)
self.plot.setAxisScale(QwtPlot.yLeft, 0.0, 1.0)
self.setCentralWidget(self.plot)
# Initialize map data
self.count = self.i = 1000
self.xs = np.zeros(self.count, np.float)
self.ys = np.zeros(self.count, np.float)
self.kappa = 0.2
self.curve = QwtPlotCurve("Map")
self.curve.attach(self.plot)
self.curve.setSymbol(QwtSymbol(QwtSymbol.Ellipse,
QBrush(Qt.red),
QPen(Qt.blue),
QSize(5, 5)))
self.curve.setPen(QPen(Qt.cyan))
toolBar = QToolBar(self)
self.addToolBar(toolBar)
# 1 tick = 1 ms, 10 ticks = 10 ms (Linux clock is 100 Hz)
self.ticks = 10
self.tid = self.startTimer(self.ticks)
self.timer_tic = None
self.user_tic = None
self.system_tic = None
self.plot.replot()
def setTicks(self, ticks):
self.i = self.count
self.ticks = int(ticks)
self.killTimer(self.tid)
self.tid = self.startTimer(ticks)
def resizeEvent(self, event):
self.plot.resize(event.size())
self.plot.move(0, 0)
def moreData(self):
if self.i == self.count:
self.i = 0
self.x = random.random()
self.y = random.random()
self.xs[self.i] = self.x
self.ys[self.i] = self.y
self.i += 1
chunks = []
self.timer_toc = time.time()
if self.timer_tic:
chunks.append("wall: %s s." % (self.timer_toc-self.timer_tic))
print(' '.join(chunks))
self.timer_tic = self.timer_toc
else:
self.x, self.y = standard_map(self.x, self.y, self.kappa)
self.xs[self.i] = self.x
self.ys[self.i] = self.y
self.i += 1
def timerEvent(self, e):
self.moreData()
self.curve.setData(self.xs[:self.i], self.ys[:self.i])
self.plot.replot()
def make():
demo = MapDemo()
demo.resize(600, 600)
demo.show()
return demo
if __name__ == '__main__':
app = QApplication(sys.argv)
demo = make()
sys.exit(app.exec_())