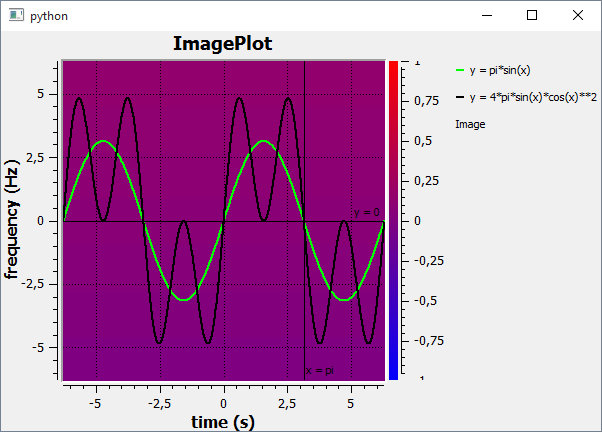
import sys
import numpy as np

from qwt.qt.QtGui import QApplication, QPen, qRgb
from qwt.qt.QtCore import Qt
from qwt import (QwtPlot, QwtPlotMarker, QwtLegend, QwtPlotGrid, QwtPlotCurve,
                 QwtPlotItem, QwtText, QwtLegendData, QwtLinearColorMap,
                 QwtInterval, QwtScaleMap, toQImage)

def bytescale(data, cmin=None, cmax=None, high=255, low=0):
    if ((hasattr(data, 'dtype') and data.dtype.char == np.uint8)
        or (hasattr(data, 'typecode') and data.typecode == np.uint8)
        ):
        return data
    high = high - low
    if cmin is None:
        cmin = min(np.ravel(data))
    if cmax is None:
        cmax = max(np.ravel(data))
    scale = high * 1.0 / (cmax-cmin or 1)
    bytedata = ((data*1.0-cmin)*scale + 0.4999).astype(np.uint8)
    return bytedata + np.asarray(low).astype(np.uint8)

def linearX(nx, ny):
    return np.repeat(np.arange(nx, typecode = np.float32)[:, np.newaxis], ny, -1)

def linearY(nx, ny):
    return np.repeat(np.arange(ny, typecode = np.float32)[np.newaxis, :], nx, 0)

def square(n, min, max):
    t = np.arange(min, max, float(max-min)/(n-1))
    #return outer(cos(t), sin(t))
    return np.cos(t)*np.sin(t)[:,np.newaxis]


class PlotImage(QwtPlotItem):
    def __init__(self, title = QwtText()):
        QwtPlotItem.__init__(self)
        self.setTitle(title)
        self.setItemAttribute(QwtPlotItem.Legend);
        self.xyzs = None

    def setData(self, xyzs, xRange = None, yRange = None):
        self.xyzs = xyzs
        shape = xyzs.shape
        if not xRange:
            xRange = (0, shape[0])
        if not yRange:
            yRange = (0, shape[1])

        self.xMap = QwtScaleMap(0, xyzs.shape[0], *xRange)
        self.plot().setAxisScale(QwtPlot.xBottom, *xRange)
        self.yMap = QwtScaleMap(0, xyzs.shape[1], *yRange)
        self.plot().setAxisScale(QwtPlot.yLeft, *yRange)

        self.image = toQImage(bytescale(self.xyzs)).mirrored(False, True)
        for i in range(0, 256):
            self.image.setColor(i, qRgb(i, 0, 255-i))

    def updateLegend(self, legend):
        QwtPlotItem.updateLegend(self, legend)
        legend.find(self).setText(self.title())

    def draw(self, painter, xMap, yMap, rect):
        """Paint image zoomed to xMap, yMap

        Calculate (x1, y1, x2, y2) so that it contains at least 1 pixel,
        and copy the visible region to scale it to the canvas.
        """
        assert(isinstance(self.plot(), QwtPlot))

        # calculate y1, y2
        # the scanline order (index y) is inverted with respect to the y-axis
        y1 = y2 = self.image.height()
        y1 *= (self.yMap.s2() - yMap.s2())
        y1 /= (self.yMap.s2() - self.yMap.s1())
        y1 = max(0, int(y1-0.5))
        y2 *= (self.yMap.s2() - yMap.s1())
        y2 /= (self.yMap.s2() - self.yMap.s1())
        y2 = min(self.image.height(), int(y2+0.5))
        # calculate x1, x2 -- the pixel order (index x) is normal
        x1 = x2 = self.image.width()
        x1 *= (xMap.s1() - self.xMap.s1())
        x1 /= (self.xMap.s2() - self.xMap.s1())
        x1 = max(0, int(x1-0.5))
        x2 *= (xMap.s2() - self.xMap.s1())
        x2 /= (self.xMap.s2() - self.xMap.s1())
        x2 = min(self.image.width(), int(x2+0.5))
        # copy
        image = self.image.copy(x1, y1, x2-x1, y2-y1)
        # zoom
        image = image.scaled(xMap.p2()-xMap.p1()+1, yMap.p1()-yMap.p2()+1)
        # draw
        painter.drawImage(xMap.p1(), yMap.p2(), image)


class ImagePlot(QwtPlot):
    def __init__(self, *args):
        QwtPlot.__init__(self, *args)
        # set plot title
        self.setTitle('ImagePlot')
        # set plot layout
        self.plotLayout().setCanvasMargin(0)
        self.plotLayout().setAlignCanvasToScales(True)
        # set legend
        legend = QwtLegend()
        legend.setDefaultItemMode(QwtLegendData.Clickable)
        self.insertLegend(legend, QwtPlot.RightLegend)
        # set axis titles
        self.setAxisTitle(QwtPlot.xBottom, 'time (s)')
        self.setAxisTitle(QwtPlot.yLeft, 'frequency (Hz)')

        colorMap = QwtLinearColorMap(Qt.blue, Qt.red)
        interval = QwtInterval(-1, 1)
        self.enableAxis(QwtPlot.yRight)
        self.setAxisScale(QwtPlot.yRight, -1, 1)
        self.axisWidget(QwtPlot.yRight).setColorBarEnabled(True)
        self.axisWidget(QwtPlot.yRight).setColorMap(interval, colorMap)

        # calculate 3 NumPy arrays
        x = np.arange(-2*np.pi, 2*np.pi, 0.01)
        y = np.pi*np.sin(x)
        z = 4*np.pi*np.cos(x)*np.cos(x)*np.sin(x)
        # attach a curve
        curve = QwtPlotCurve('y = pi*sin(x)')
        curve.attach(self)
        curve.setPen(QPen(Qt.green, 2))
        curve.setData(x, y)
        # attach another curve
        curve = QwtPlotCurve('y = 4*pi*sin(x)*cos(x)**2')
        curve.attach(self)
        curve.setPen(QPen(Qt.black, 2))
        curve.setData(x, z)
        # attach a grid
        grid = QwtPlotGrid()
        grid.attach(self)
        grid.setPen(QPen(Qt.black, 0, Qt.DotLine))
        # attach a horizontal marker at y = 0
        marker = QwtPlotMarker()
        marker.attach(self)
        marker.setValue(0.0, 0.0)
        marker.setLineStyle(QwtPlotMarker.HLine)
        marker.setLabelAlignment(Qt.AlignRight | Qt.AlignTop)
        marker.setLabel(QwtText('y = 0'))
        # attach a vertical marker at x = pi
        marker = QwtPlotMarker()
        marker.attach(self)
        marker.setValue(np.pi, 0.0)
        marker.setLineStyle(QwtPlotMarker.VLine)
        marker.setLabelAlignment(Qt.AlignRight | Qt.AlignBottom)
        marker.setLabel(QwtText('x = pi'))
        # attach a plot image
        plotImage = PlotImage('Image')
        plotImage.attach(self)
        plotImage.setData(square(512, -2*np.pi, 2*np.pi),
                          (-2*np.pi, 2*np.pi), (-2*np.pi, 2*np.pi))

        legend.SIG_CLICKED.connect(self.toggleVisibility)

        # replot
        self.replot()

    def toggleVisibility(self, plotItem, idx):
        """Toggle the visibility of a plot item
        """
        plotItem.setVisible(not plotItem.isVisible())
        self.replot()


def make():
    demo = ImagePlot()
    demo.resize(600, 400)
    demo.show()
    return demo


if __name__ == '__main__':
    app = QApplication(sys.argv)
    demo = make()
    sys.exit(app.exec_())
