import sys
import numpy as np
from qwt.qt.QtGui import QApplication, QPen
from qwt.qt.QtCore import Qt
from qwt import QwtPlot, QwtPlotMarker, QwtLegend, QwtPlotCurve, QwtText
class SimplePlot(QwtPlot):
def __init__(self, *args):
QwtPlot.__init__(self, *args)
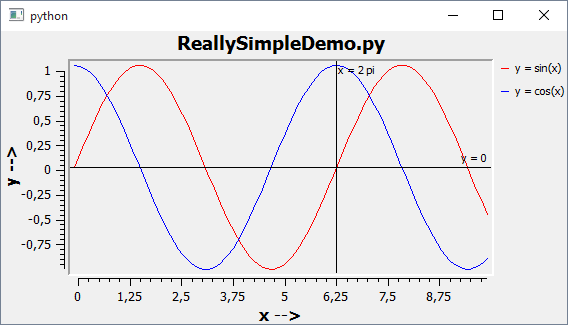
self.setTitle('ReallySimpleDemo.py')
self.insertLegend(QwtLegend(), QwtPlot.RightLegend)
self.setAxisTitle(QwtPlot.xBottom, 'x -->')
self.setAxisTitle(QwtPlot.yLeft, 'y -->')
self.enableAxis(self.xBottom)
# insert a few curves
cSin = QwtPlotCurve('y = sin(x)')
cSin.setPen(QPen(Qt.red))
cSin.attach(self)
cCos = QwtPlotCurve('y = cos(x)')
cCos.setPen(QPen(Qt.blue))
cCos.attach(self)
# make a Numeric array for the horizontal data
x = np.arange(0.0, 10.0, 0.1)
# initialize the data
cSin.setData(x, np.sin(x))
cCos.setData(x, np.cos(x))
# insert a horizontal marker at y = 0
mY = QwtPlotMarker()
mY.setLabel(QwtText('y = 0'))
mY.setLabelAlignment(Qt.AlignRight | Qt.AlignTop)
mY.setLineStyle(QwtPlotMarker.HLine)
mY.setYValue(0.0)
mY.attach(self)
# insert a vertical marker at x = 2 pi
mX = QwtPlotMarker()
mX.setLabel(QwtText('x = 2 pi'))
mX.setLabelAlignment(Qt.AlignRight | Qt.AlignTop)
mX.setLineStyle(QwtPlotMarker.VLine)
mX.setXValue(2*np.pi)
mX.attach(self)
# replot
self.replot()
def make():
demo = SimplePlot()
demo.resize(800, 500)
demo.show()
return demo
if __name__ == '__main__':
app = QApplication(sys.argv)
demo = make()
demo.exportTo("demo.png", size=(1600, 900), resolution=200)
sys.exit(app.exec_())