Effect of measurement noise on accuracy of fit
Experimental noise often corrupts concentration profiles. When the diffusion matrix is determined from noisy concentration profiles, the accuracy of the estimation decreases when the intensity of the noise increases. Furthermore, minor eigenvectors and eigenvalues are more affected by the noise than the dominant eigenvector.
import numpy as np
import matplotlib.pyplot as plt
from multidiff import compute_diffusion_matrix, create_diffusion_profiles
- Our diffusion system has three components (e.g. three oxides). The diffusion
- matrix has two eigenvalues with quite different magnitudes. Exchange vectors correspond to the exchange of the three possible pairs of components (meaning that each endmember is enriched in one component and poorer in another, compared to the other endmember).
diags = np.array([0.5, 5.])
P = np.matrix([[1, 1], [-1, 0]])
xpoints_exp1 = np.linspace(-10, 10, 100)
x_points = [xpoints_exp1] * 3


exchange_vectors = np.array([[0, 1, 1],
                             [1, -1, 0],
                             [-1, 0, -1]])


# Initialization for the diffusion matrix
diags_init = np.array([1, 2])
P_init = np.matrix([[1.5, 0.9], [-1, -0.7]])
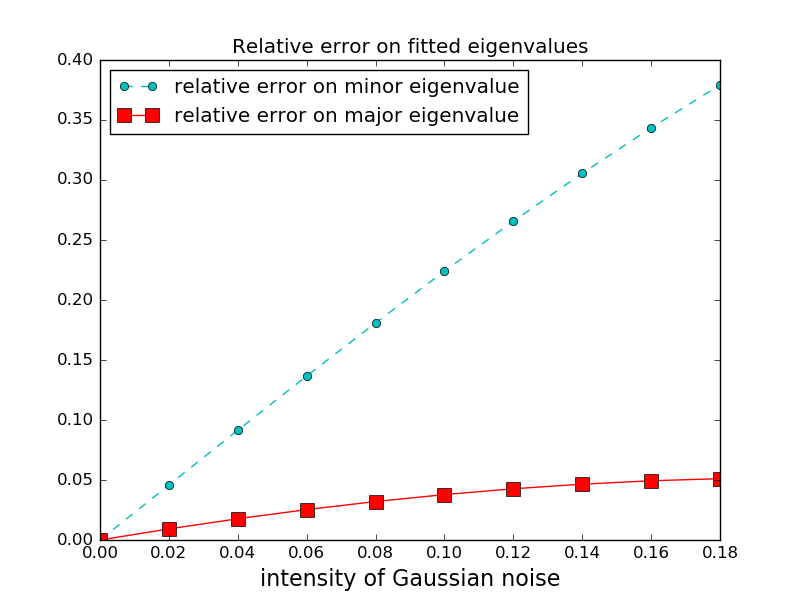
We now iterate over increasing values of measurement Gaussian noise. For each value of the noise, synthetic diffusion profiles are created, and the diffusion matrix is computed from the profiles. We plot the relative error on the eigenvalues, defined as abs((lambda_computed - lambda_real)/lambda_real). The relative error is consistently larger for the smaller eigenvalue, since errors on the larger (dominant) eigenvalue and eigenvectors result in errors of comparable magnitude on the smaller eigenvalue(s) and eigenvector(s).
Note that for the dominant eigenvalue, the relative error is smaller than the intensity of the noise. Indeed, we have enough experiments to overconstrain the system, plus a large number of measurement points.
noises = np.arange(0, 0.2, 0.02)
errors = np.empty((len(noises), 2))

for i, noise in enumerate(noises):
    concentration_profiles = create_diffusion_profiles((diags, P), x_points,
                                    exchange_vectors, noise_level=noise)
    diags_res, eigvecs, _, _, _ = (
            compute_diffusion_matrix((diags_init, P_init), x_points,
                                        concentration_profiles, plot=False))
    errors[i, :] = np.abs(np.sort(diags_res) - diags) / diags


plt.figure()
plt.plot(noises, errors[:, 0], 'co--',
        label='relative error on minor eigenvalue')
plt.plot(noises, errors[:, 1], 'rs-', ms=10,
         label='relative error on major eigenvalue')
plt.xlabel('intensity of Gaussian noise', fontsize=16)
plt.title('Relative error on fitted eigenvalues')
plt.legend(loc='best')

plt.show()
Total running time of the script: ( 0 minutes 1.760 seconds)