Contents
4. CORE
4.1. Base for all pipelines
- class CNOBase(pknmodel, data, tag=None, verbose=False, use_cnodata=False, config=None)[source]
Abstract Base Class common class to all formalisms
- cnograph
- data
get the data (MIDAS)
- debugLevel
Read/Write access to the debug level. Must be one of INFO, DEBUG, WARNING, CRITICAL, ERROR
- level
alias to debugLevel (Read-only access)
- midas
get the data (MIDAS)
- pknmodel
get the prior knowledge network
- plot_midas(xkcd=False)[source]
Plot the MIDAS data
See also
full documentation about MIDAS in cellnopt.core.midas.plot()
- plot_pknmodel()[source]
Plot the original PKN model
See also
full documentation about MIDAS in cellnopt.core.cnograph
- preprocessing(expansion=True, compression=True, cutnonc=True, maxInputsPerGate=2)[source]
Apply preprocessing on the PKN model
- report_directory
4.2. Models
- class BooleanModels(data, reacID=None, index_col=None)[source]
Class to read and plot models as exported by CASPO or CellNOptR
Models contains dataframe with reactions as columns and models as rows. For each reaction, we can then obtain the average paramters for a reaction. In a boolean case, a Model stores a value made of 0/1
scores may be available. No sizes are stored. Sizes could be extracted easily as sum over rows.
>>> from cno.core.models import Models
>>> m = Models()
>>> m.plot() # average model, whcih can be obtained with  m.get_average_model()
>>> m.plot(model_number=0)  # indices are m.df.index
>>> m.plot(model_number=0)  # indices are m.df.index
Note
One difficulty is the way ANDs are coded in different software. In CASPO, the AND gate is coded as “A+B=C”. Note that internally we use ^ especially in CNOGraph. Then, an AND edge is splitted in sub edges. so, A+B=C is made of 3 edges A -> A+B=C , B -> A+B=C and A+B=C -> C. This explains the wierd code in cno.io.cnograph.plot().
- plots average models with edges on/off
- plot of errobars on edges sorted by average presence
- plots heatmap of the models
if you have a first column, whihc is not a reaction, set index_col to 0
Todo
values are 0/1 since we have bit strings but could be anything in other formalisms (e.g., ODE) how to handle those cases ?
Parameters: dta – a filename with columns as the reacitons and rowss as parameters for each reactions. Each row is therefore a model. - compute_average(model_number=None, tolerance=None)[source]
Compute the average and update the cnograph accordingly
Parameters: model_number (int) – model_number as shown by df.index if not provided, the average is taken
- drop_scores_above(tolerance=None)
- errorbar(tolerance=100000000.0, errorbar=True)[source]
Plot the average presence of reactions over all models
- get_average_model(max_score=None)
Returns the average model (on each reaction)
- plot(model_number=None, cmap='gist_heat_r', colorbar=True, tolerance=None, filename=None, **kargs)[source]
Plot the average model
- sizes
- to_csv(filename, index=False)
Exports the dataframe to a CSV file
- to_sif(filename=None)
Exports 2 SIF using the “and” convention
can read the results with CellNOptR for instance:
library(CellNOptR)
plotModel(readSIF("test.sif"))
- class CompareTwoModels(m1, m2)[source]
Parameters: - m1 – first model as a Pandas time series e.g. row of BooleanModels
- m2 – first model as a Pandas time series e.g. row of BooleanModels
Returns: from a models, m1 = pd.TimeSeries(models.df.ix[0], dtype=int) m2 = pd.TimeSeries(models.df.ix[1], dtype=int)
- class DTModels(data, reacID=None, index_col=None)[source]
- compute_average(model_number=None, tolerance=None)
Compute the average and update the cnograph accordingly
Parameters: model_number (int) – model_number as shown by df.index if not provided, the average is taken
- drop_duplicates()
- drop_scores_above(tolerance=None)
- errorbar(tolerance=100000000.0, errorbar=True)
Plot the average presence of reactions over all models
- get_average_model(max_score=None)
Returns the average model (on each reaction)
- get_consensus_model(threshold=0.5)
- get_cv_model()
Returns the average coefficient of variation on each reaction
- get_jaccard(progress=True)
- get_main_reactions(threshold=0.5)
- heatmap(num=1, transpose=False, cmap='gist_heat_r', heatmap_attr={})
- plot(model_number=None, cmap='gist_heat_r', colorbar=True, tolerance=None, filename=None, **kargs)
Plot the average model
- sizes
- to_csv(filename, index=False)
Exports the dataframe to a CSV file
- to_sif(filename=None)
Exports 2 SIF using the “and” convention
can read the results with CellNOptR for instance:
library(CellNOptR)
plotModel(readSIF("test.sif"))
- class FuzzyModels(data, reacID=None, index_col=None)[source]
-
- drop_scores_above(tolerance=None)
- get_average_model(max_score=None)
Returns the average model (on each reaction)
- to_csv(filename, index=False)
Exports the dataframe to a CSV file
- to_sif(filename=None)
Exports 2 SIF using the “and” convention
can read the results with CellNOptR for instance:
library(CellNOptR)
plotModel(readSIF("test.sif"))
- class Models(data, reacID=None, index_col=None, verbose=True)[source]
Data structure to store models.
Models are stored in dataframes. Columns will hold the reactions.
constructor
Parameters: - data – could be a string to read a file (CSV). The CSV header should contain the reaction name. First column is not expected to be found. Note, however that :param:`index_col` may be used. The input can also be a dataframe (column names being the reactions) set to 0/1. The input can also be an instance of Models.
- reacID (list) – if provided, columns are renamed using this list
- index_col –
- verbose (bool) –
Reaction names may contain a symbol indicating the logical ANDs. This should be “^” character.
4.3. Parameters for the pipelines
| members: | |
|---|---|
| undoc-members: | |
| inherited-members: | |
| synopsis: | |
4.4. Reports
- class Report(formalism='base', directory='report', tag=None, filename='index.html', overwrite=True, verbose=True, dependencies=True)[source]
-
- debugLevel
Read/Write access to the debug level. Must be one of INFO, DEBUG, WARNING, CRITICAL, ERROR
- get_table_dependencies()[source]
Returns dependencies of the pipeline into a HTML/XML table
dependencies are the python dependencies as returned by pkg_resource. additionally, r dependencies added in dependencies are also added.
- level
alias to debugLevel (Read-only access)
- class ReportBool[source]
- add_section(content, title, references=, []position=None)
- close_body()
- close_html()
- debugLevel
Read/Write access to the debug level. Must be one of INFO, DEBUG, WARNING, CRITICAL, ERROR
- get_header()
a possible common header ?
- get_html_reproduce()
- get_table_dependencies()
Returns dependencies of the pipeline into a HTML/XML table
dependencies are the python dependencies as returned by pkg_resource. additionally, r dependencies added in dependencies are also added.
- get_time_now()
- get_toc()
- level
alias to debugLevel (Read-only access)
- plot_fitness(show=True, save=False, loglog=True)
- report(browse=True)
- savefig(filename)
- show()
- write(filename)
- class ReportODE[source]
- add_section(content, title, references=, []position=None)
- close_body()
- close_html()
- debugLevel
Read/Write access to the debug level. Must be one of INFO, DEBUG, WARNING, CRITICAL, ERROR
- get_header()
a possible common header ?
- get_html_reproduce()
- get_table_dependencies()
Returns dependencies of the pipeline into a HTML/XML table
dependencies are the python dependencies as returned by pkg_resource. additionally, r dependencies added in dependencies are also added.
- get_time_now()
- get_toc()
- level
alias to debugLevel (Read-only access)
- plot_fitness(show=True, save=False, loglog=True)
- report(browse=True)
- savefig(filename)
- show()
- write(filename)
- class ReportFuzzy[source]
- add_section(content, title, references=, []position=None)
- close_body()
- close_html()
- debugLevel
Read/Write access to the debug level. Must be one of INFO, DEBUG, WARNING, CRITICAL, ERROR
- get_header()
a possible common header ?
- get_html_reproduce()
- get_table_dependencies()
Returns dependencies of the pipeline into a HTML/XML table
dependencies are the python dependencies as returned by pkg_resource. additionally, r dependencies added in dependencies are also added.
- get_time_now()
- get_toc()
- level
alias to debugLevel (Read-only access)
- plot_fitness(show=True, save=False, loglog=True)
- report(browse=True)
- savefig(filename)
- show()
- write(filename)
- class ReportDT[source]
- add_section(content, title, references=, []position=None)
- close_body()
- close_html()
- debugLevel
Read/Write access to the debug level. Must be one of INFO, DEBUG, WARNING, CRITICAL, ERROR
- get_header()
a possible common header ?
- get_html_reproduce()
- get_table_dependencies()
Returns dependencies of the pipeline into a HTML/XML table
dependencies are the python dependencies as returned by pkg_resource. additionally, r dependencies added in dependencies are also added.
- get_time_now()
- get_toc()
- level
alias to debugLevel (Read-only access)
- plot_fitness(show=True, save=False, loglog=True)
- report(browse=True)
- savefig(filename)
- show()
- write(filename)
4.5. Data structure to store results
- class BooleanResults[source]
- best_score
- hist2d_scores_vs_model_size(bins=None, cmap='gist_heat_r', fontsize=16, contour=False, Nlevels=10)[source]
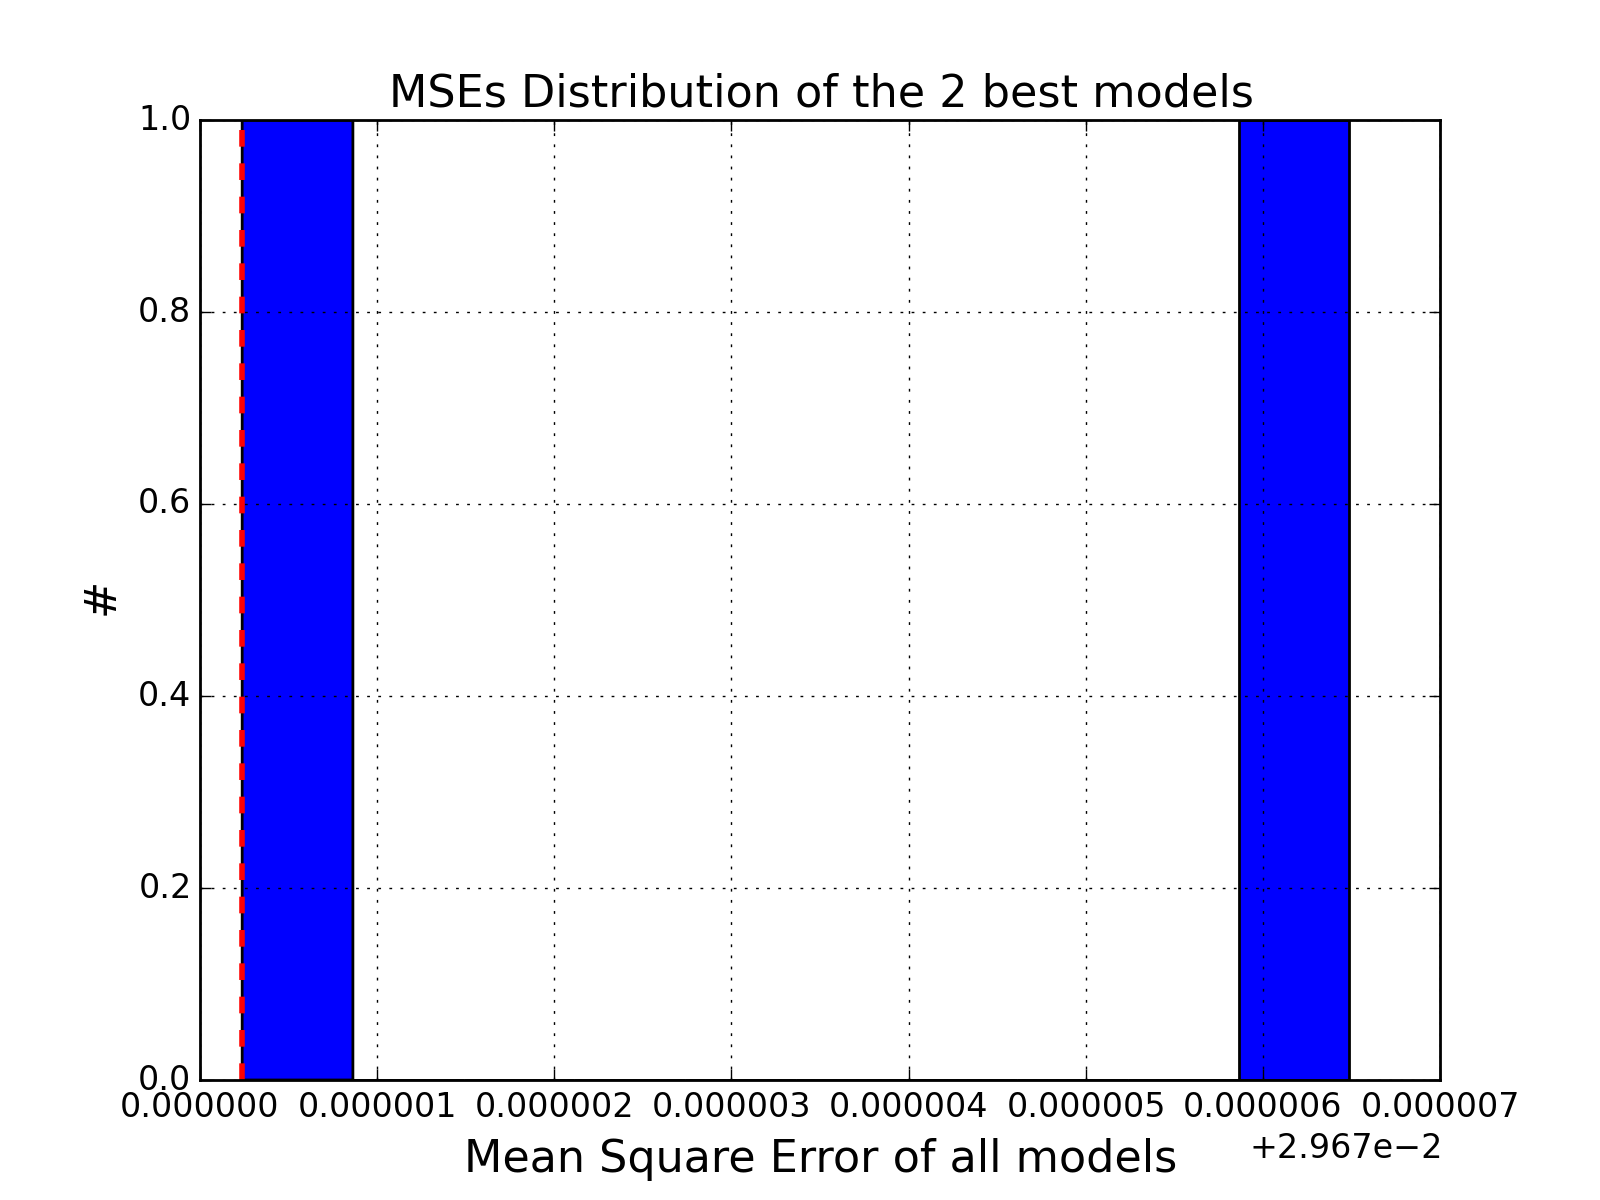
- hist_scores(fontsize=16, **kargs)[source]
Plot histogram of the MSEs
>>> from cno.boolean.cnorbool import CNORbool
>>> from cno import cnodata
>>> a = CNORbool(cnodata("PKN-ToyMMB.sif"), cnodata("MD-ToyMMB.csv"))
>>> a.optimise()
>>> a.results.hist_scores()
(Source code, png, hires.png, pdf)

- models
- results
- scores
- sizes
- class DTResults[source]
- best_score
- hist2d_scores_vs_model_size(bins=None, cmap='gist_heat_r', fontsize=16, contour=False, Nlevels=10)
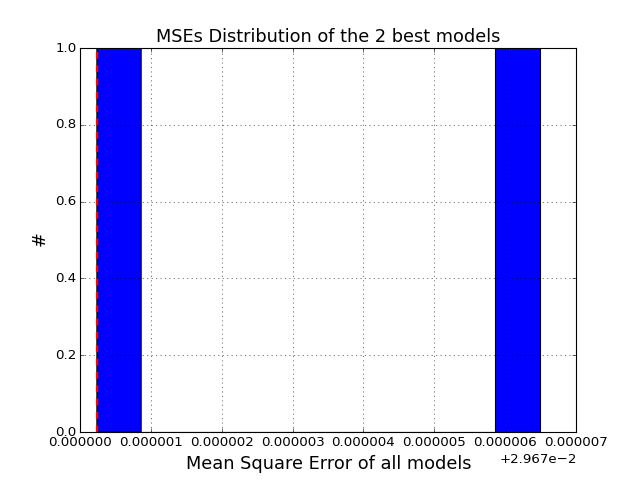
- hist_scores(fontsize=16, **kargs)
Plot histogram of the MSEs
>>> from cno.boolean.cnorbool import CNORbool
>>> from cno import cnodata
>>> a = CNORbool(cnodata("PKN-ToyMMB.sif"), cnodata("MD-ToyMMB.csv"))
>>> a.optimise()
>>> a.results.hist_scores()
(Source code, png, hires.png, pdf)
- models
- plot_fit()
- plot_mse_grouped_by_size()
- results
- scatter_scores_vs_model_size()
Scatter plot of the model size and scores
- scores
- sizes
4.6. Tools to install r packages
Module to install the R packages required by CellNOptR and other related packages
- install_dependencies_cellnoptr(verbose='INFO')
Install the CellNOptr dependencies
- install_dependencies_ode()
Install the dependencies for the ODE package
4.7. GTT
- class GTTBool(simulator)[source]
API could be simplified.
# here there are duplicate, should be called automatically ?
s = steady.Steady(cnodata("PKN-ToyMMB.sif"), cnodata("MD-ToyMMB.csv"))
s.preprocessing()
s.optimise()
s.results.models.drop_duplicates()


g = gtt.GTTBool(s)
g.analyse()
# here indices are same s in models, which may not be contiguous
g.truth_tables[189]