Quality Control

Computes and plots distances between experiments or replicates.
Description
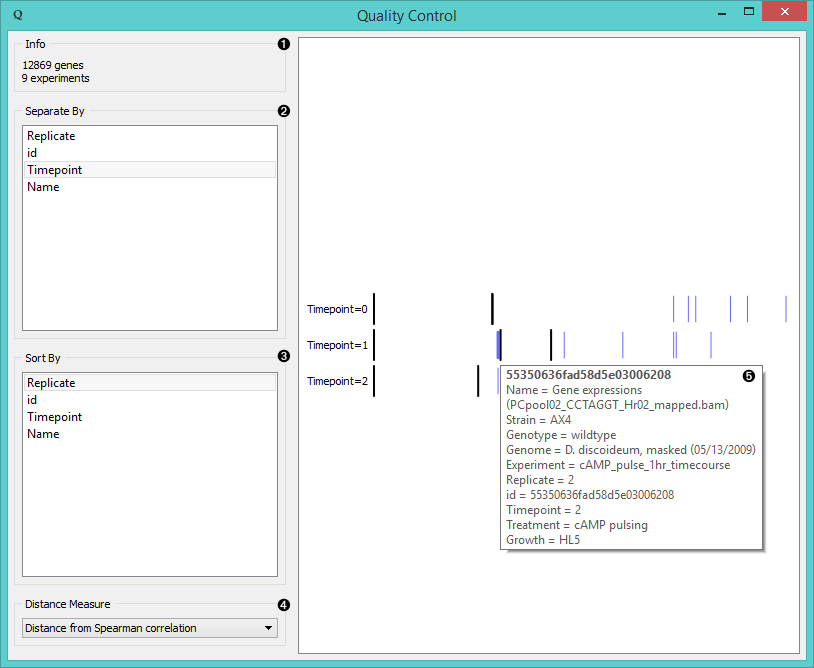
Quality Control measures distances between experiments (usually replicates) for a selected label. The widget visualizes distances by selected label. Experiments that lie the farthest from the initial black line should be inspected for anomalies.
- Information on the input.
- Separate experiments by label.
- Sort experiments by label.
- Compute distances by:
- Hover over the vertical line to display the information on a chosen instance. Click on the black line to change the reference to that instance.
Example
Quality Control widget gives us feedback on the quality of our data and can be connected to any widget with data output. In the example above (see the image under Description) we fed 9 experiments of Cyclic AMP pulsing of Dictyostelium discoideum from GenExpress widget into Quality Control and separated them by timepoint label. We found replicate 2 from tp 2 among the tp 1 data, meaning we should inspect these data further.