PIPAx

Gives access to PIPA databases.
Signals
Inputs:
- (None)
Outputs:
Data
Selected experiments. Each annotated column contains results of a single experiment or, if the corresponding option is chosen, the average of multiple replicates.
Description
PIPAx is a widget for a direct access to PIPA database. It is very similar to the GenExpress and GEO Data Sets widgets as it allows you to download the data from selected experiments.
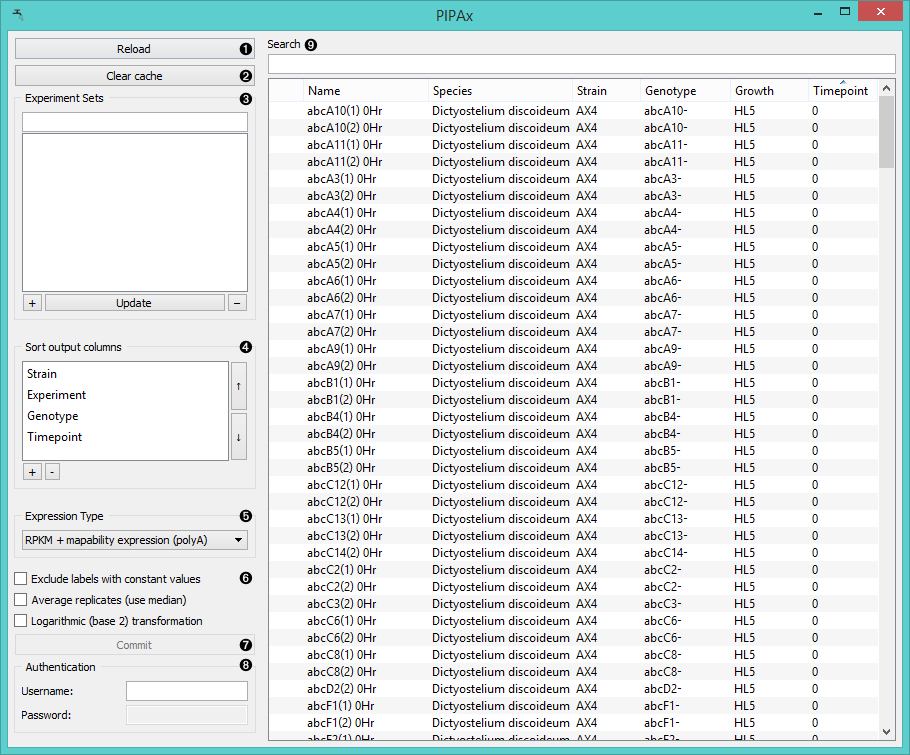
- Reloads the experiment data.
- The widget will save (cache) downloaded data, which makes them also available offline. To reset the widget click Clear cache.
- Use Experiment Sets to save a selection:
select the experiments, click the “+” button and name the
set. To add experiments to the set, click on its name, select
additional experiments and click Update.
To remove the set click “-”. - In Sort output columns set the attributes by which the output columns are sorted. Add attributes with a “+” button and remove them with “-”. Switch the sorting order with arrows on the right.
- Set the expression type for your output data.
- Raw expression outputs raw experiment data
- RPKM expression outputs data in reads per kilobase of transcript per million mapped reads
- RPKM expression + mapability expression uses similar normalization, but divides with gene
mapability instead of exon lengths.
The polyA variants use only polyA (mRNA) mapped hits.
- Exclude labels with constant values removes attribute labels that are the same for all selected
experiments from the output data.
Average replicates (use median) averages identical experiments by using medians as values.
Logarithmic (base 2) transformation computes the log2(value+1) for each value. - Click Commit to output selected experiments.
- Log in to access private data.
- Experiments can be filtered with the Search box. To select which attributes to display right-click on the header. To select multiple experiments click them while holding the Control/Command key.
Example
In the schema below we connected PIPAx to Data Table, Set Enrichment, and Distance Map (through Distances) widgets.
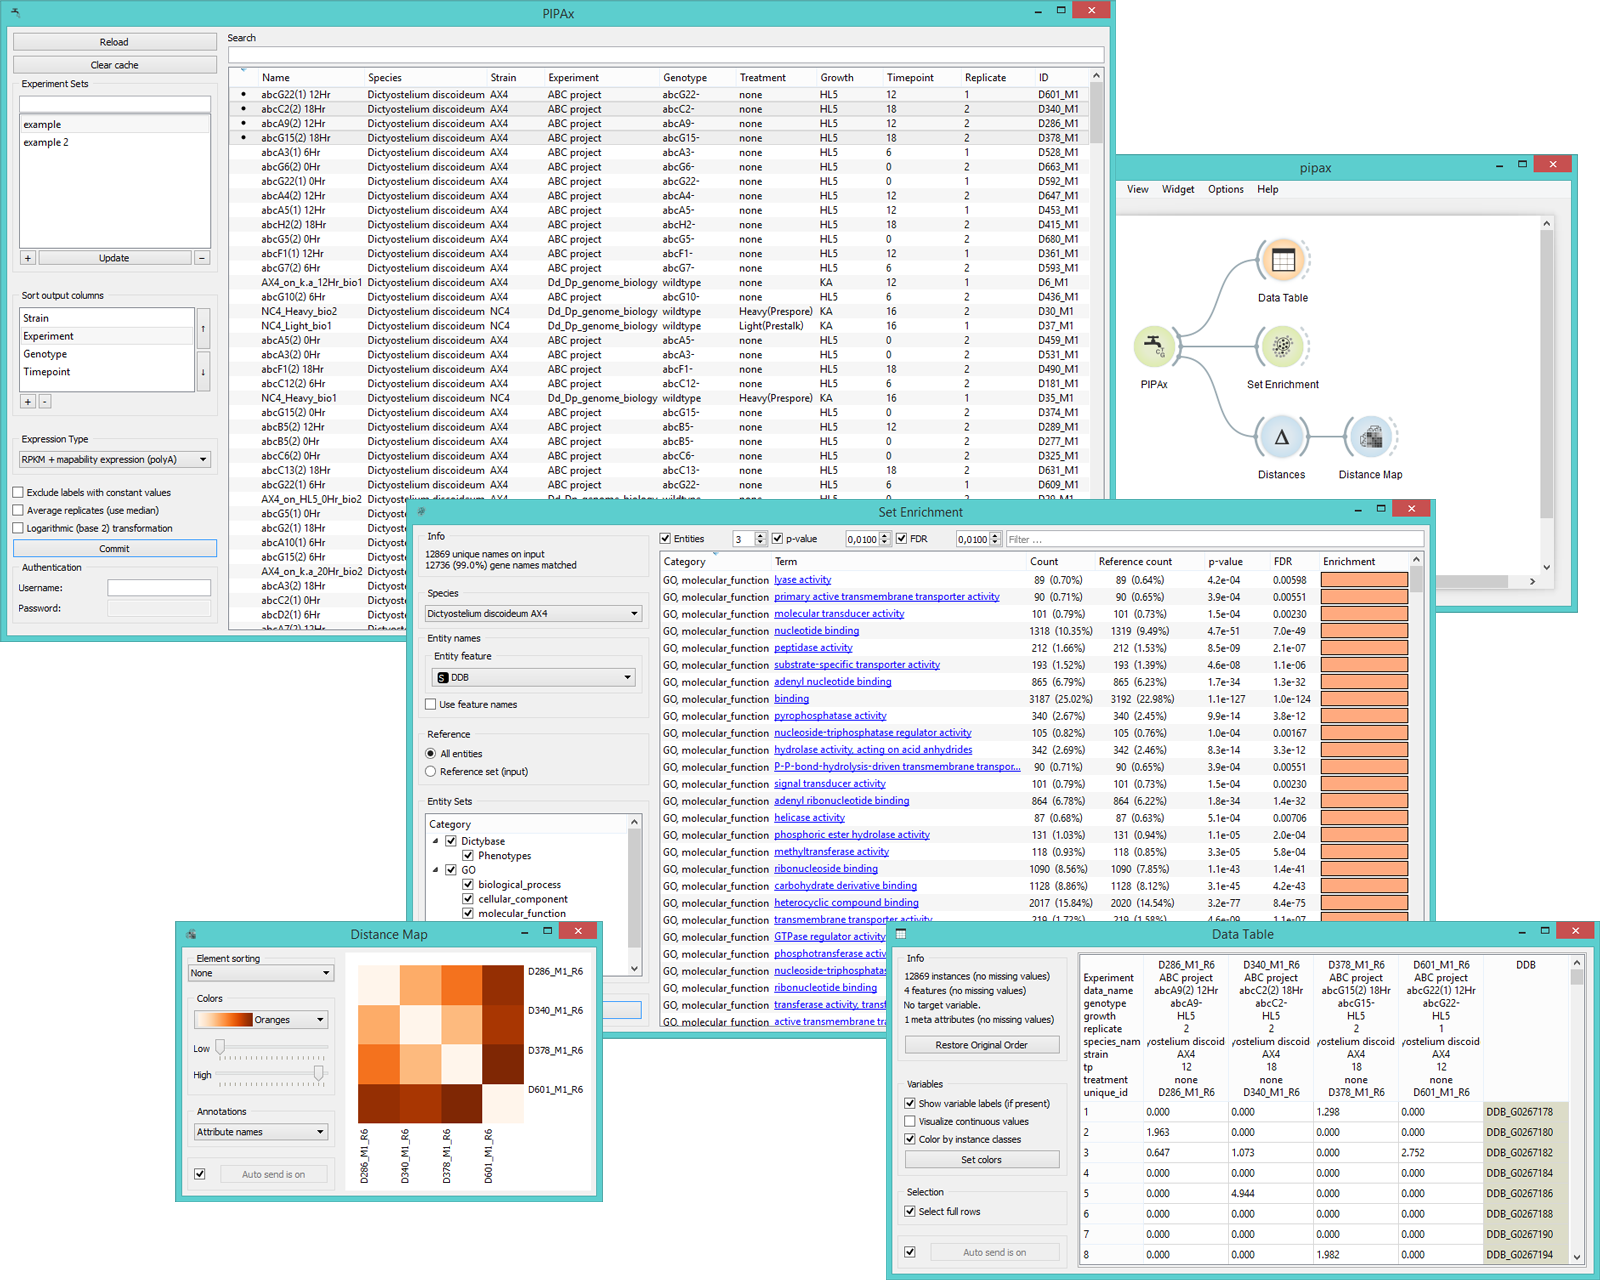
The Data Table widget above contains the output from the PIPAx widget. Each column contains gene expressions of a single experiment. The labels are shown in the table header. The Distance Map widget shows distances between experiments. The distances are measured with Distance widget, which was set to compute Euclidean distances.