plottools.zoom_axes
-
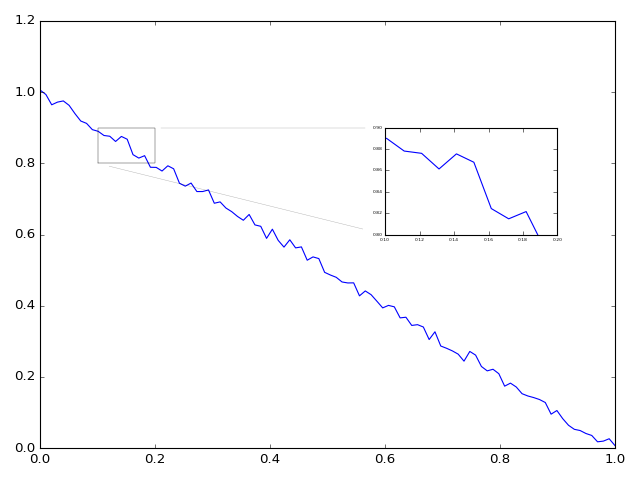
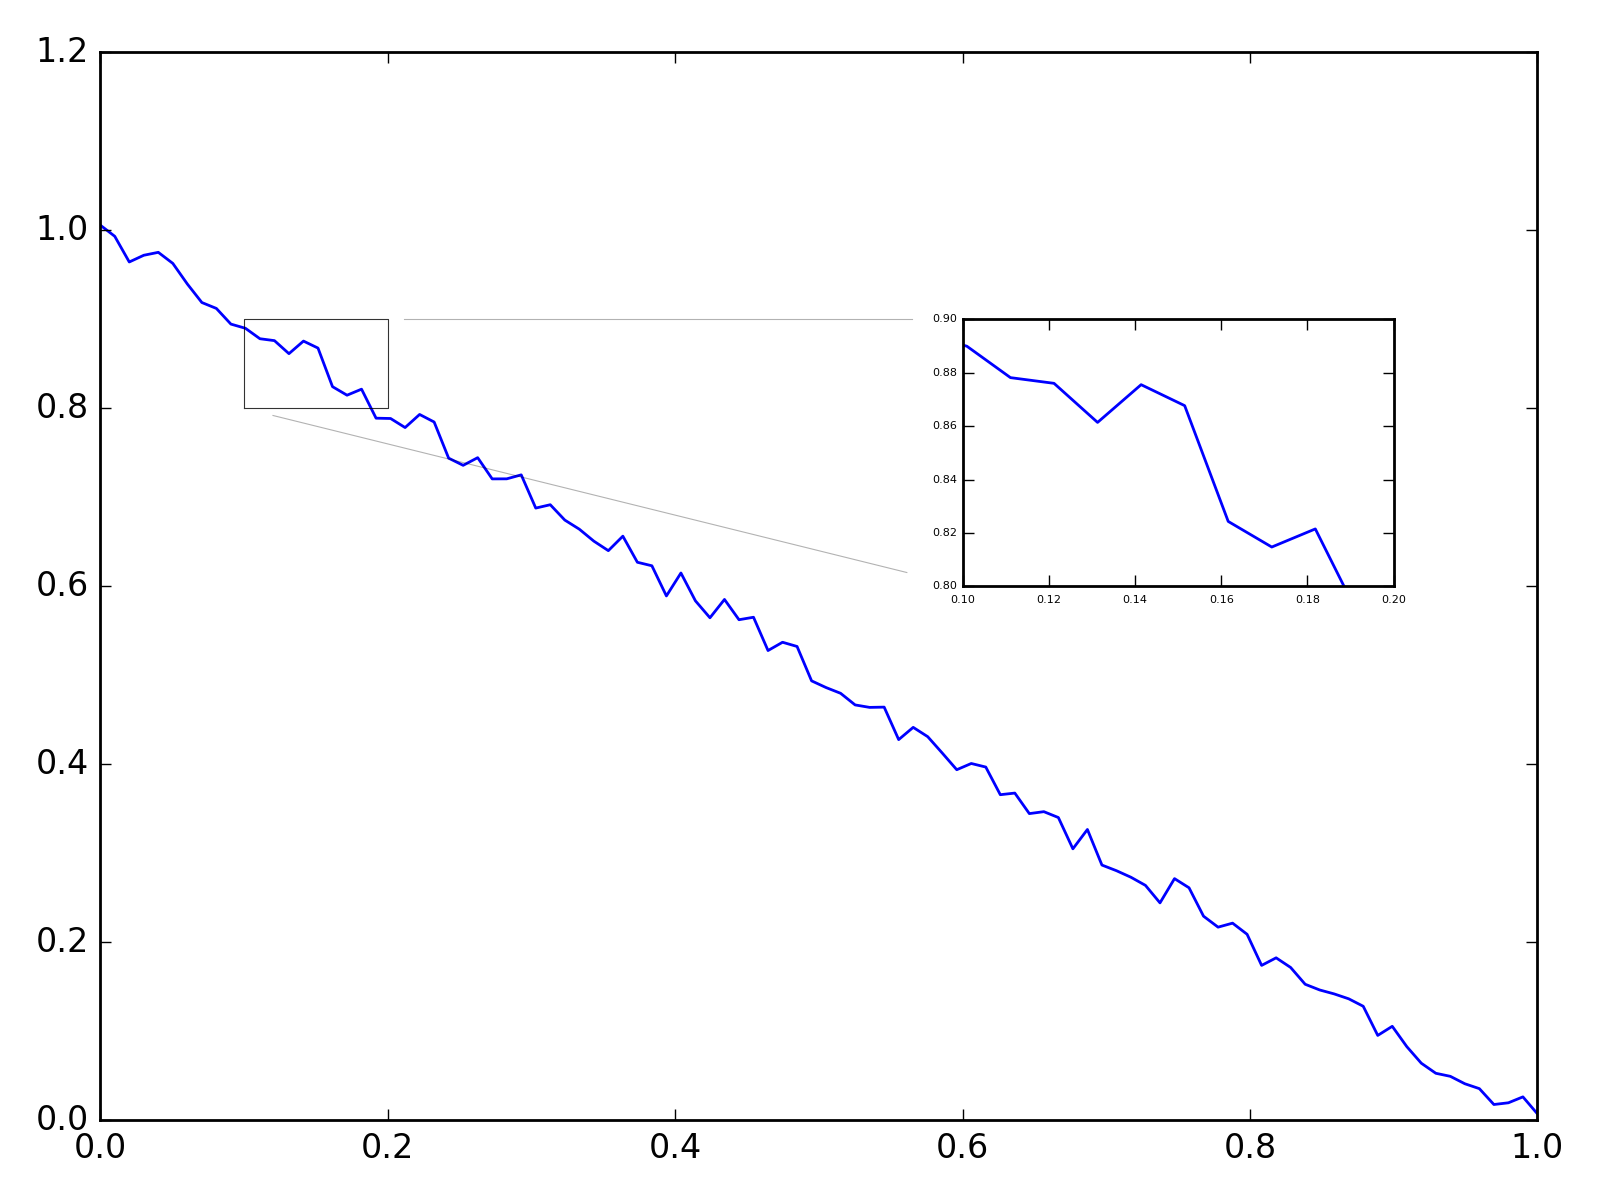
plottools.zoom_axes(fig, ax, zoom_x, zoom_y, axes_x, axes_y, box=True, box_color='k', box_alpha=0.8, connect=True, connect_color='k', connect_alpha=0.3, spacing=4, tick_width=20, tick_height=12)[source]¶ Creates a new axes which zooms in on a part of a given axes.
A box is drawn around the area to be zoomed specified in data coordinates. A new empty axes is created at the specified location, supplied in data coordinates. The new axis limits are set so that they match the zoom box.
The zoom box and axis can be connected with two lines, connecting the outer most corner points while leaving space for the axis ticks.
Parameters: fig : matplotlib figure
the figure in which to create a zoom axis
ax : matplotlib axes
the axis in which to create a zoom axis
zoom_x : list
[min, max] specifying the zooming horizontal area in data coordinates
zoom_y : list
[min, max] specifying the zooming vertical area in data coordinates
axes_x : list
[min, max] specifying the new axes horizontal location in data coordinates
axes_y : list
[min, max] specifying the new axes vertical location in data coordinates
box : bool, optional
specifies whether a box is drawn
box_color : color string or tuple,optional
specifies the box color
box_alpha : number
between 0 and 1, specifies the box alpha
connect : bool, optional
specifies whether the connecting lines are drawn
connect_color : color string or tuple,optional
specifies the connecting lines color
connect_alpha : number
between 0 and 1, specifies the connecting lines alpha
spacing : number
specifies the spacing between the box, axis and the connecting lines in points
tick_width : number
specifies the width of the tick labels in points to avoid drawing connecting lines through the tick labels
tick_height : number
specifies the height of the tick labels in points to avoid drawing connecting lines through the tick labels
Returns: ax_zoom : matplotlib axes
the new axes
Notes
- Axes limits should not be changed after a zoom axes has been added
zoom_axesdoes not give the expected results when used on a subfigure
Examples
>>> import matplotlib.pyplot as plt
>>> import numpy as np
>>> import plottools
>>>
>>> fig,ax = plt.subplots()
>>> x = np.linspace(0,1,100)
>>> y = 1-x + 0.02*(2*np.random.random(len(x))-1)
>>> ax.plot(x,y)
>>> ax_zoom = plottools.zoom_axes(fig,ax,[0.1,0.2],[0.8,0.9],[0.6,0.9],[0.6,0.9])
>>> ax_zoom.plot(x,y)
>>> plt.show()
(Source code, png, hires.png, pdf)
