Quickstart
Tools
Colorscheme
Plottools offers a colorscheme class which can be used to define a set of colors
and an order of appearance. The colorscheme object can then be used to cycle
through colors using a convinient next method or by indexing using a short
or longname.
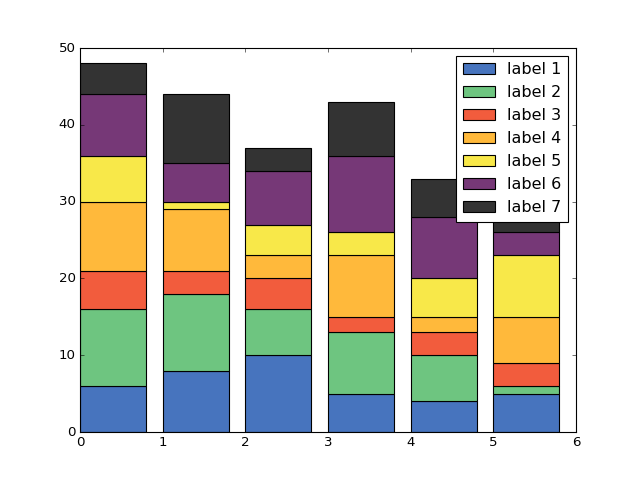
When a colorscheme is defined in the beginning of a script and referenced in the subsequent plot commands, it allows easy changes of colorscheme if required.
import numpy as np
import matplotlib.pyplot as plt
import plottools as pt

colorscheme = pt.color

plt.figure()
x = np.arange(6)
labels = ['label {}'.format(i+1) for i in range(len(colorscheme.keys()))]

bars = []
y_tot = np.zeros_like(x)
for l in labels:
    y = np.random.random_integers(1,high=10,size=x.shape)
    b = plt.bar(x, y, 0.8, bottom=y_tot , color=colorscheme.next())
    bars.append(b[0])
    y_tot += y

plt.legend(bars,labels)
plt.show()
(Source code, png, hires.png, pdf)
Plottools comes with a default colorscheme plottools.color which
includes 6 colors and a shade of grey which looks better than the default colors
and have good contrast when printed in greyscale.
import matplotlib.pyplot as plt
import numpy as np

import plottools as pt
from plottools.color.util import plot_colors, to_greyscale

fig = plt.figure()
ax1 = fig.add_subplot(211)
plot_colors(ax1,pt.color.colors,['k','p','b','r','g','o','y'])

ax2 = fig.add_subplot(212)
plot_colors(ax2,{key: to_greyscale(val) for key,val in pt.color.items()} ,['k','p','b','r','g','o','y'])
plt.show()
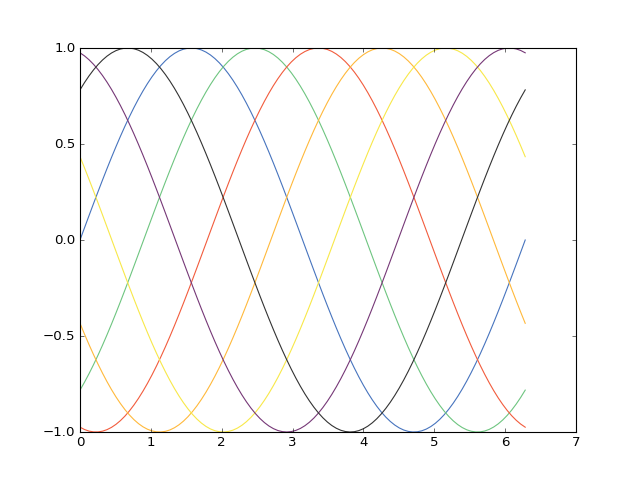
A colorscheme can also be used as the default color cycler by calling the method
set_as_default().
import numpy as np
import matplotlib.pyplot as plt
import plottools as pt

plt.figure()
x = np.linspace(0,2*np.pi,100)

pt.color.set_as_default()

for i,key in enumerate( pt.color.keys() ):
    plt.plot(x,np.sin(x-i*2*2*np.pi/14))

plt.show()
(Source code, png, hires.png, pdf)
When a colorscheme is defined, a lighter and darker variation are automatically
created. These can be accessed as a color scheme object by the light and
dark attributes respectively.
import numpy as np
import matplotlib.pyplot as plt
import plottools as pt

plt.figure()
x = np.linspace(0,2*np.pi,100)
for i,key in enumerate( pt.color.default.keys() ):
    plt.plot(x,np.sin(x-i*2*2*np.pi/14),color=pt.color[key],label=key)
    plt.plot(x,np.sin(x-i*2*2*np.pi/14)-0.1,color=pt.color.light[key])
    plt.plot(x,np.sin(x-i*2*2*np.pi/14)+0.1,color=pt.color.dark[key])

plt.legend()
plt.show()