plottools.categorized_xticklabels
-
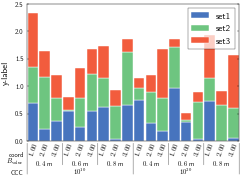
plottools.categorized_xticklabels(xticks, xticklabels, xticklabelnames=None, fmt=None, size=None, rotation=None, spacing=1.4)[source]¶ Creates categorized ticks on the x-axis
Parameters: xticks : array-like
The x-locations of the data points
xticklabels : list of array-likes
A list of lists or arrays of which each must have the same length as xticks. These are all used as x-tick labels, the first array is displayed highest, the next arrays are printed below the previous one. Results are the most appealing if the 1st array has the highest variation and the last array the lowest.
xticklabelnames: list of strings, optional
A list of names for the labels. It must have the same length as the xticklabels list.
fmt: list of fromat strings, optional
A list of fromatting strings as used by
formatfor the tick labels. It must have the same length as the xticklabels list.size: list of numbers, optional
A list of numbers specifying the size of the ticklabels in points. It must have the same length as the xticklabels list.
rotation: list of numbers, optional
A list of numbers specifying the rotation of the ticklabels in degrees. It must have the same length as the xticklabels list.
spacing: number, optional
Controls the vertical spacing between the differnt ticklabels
Examples
>>> import matplotlib.pyplot as plt
>>> import numpy as np
>>> import plottools
>>>
>>> plottools.set_publication_rc()
>>>
>>> # generate data
>>> C,B,A = np.meshgrid([10,20],[0.4,0.6,0.8],[1,2,3],indexing='ij')
>>> xticklabels = [ A.reshape((-1,)), B.reshape((-1,)), C.reshape((-1,)) ]
>>> values = [np.random.random(len(t)) for t in xticklabels]
>>> xticks = np.arange(len(values[0]))
>>>
>>> xticklabelnames = ['coord','$B_\mathrm{value}$','CCC']
>>> labels = ['set1','set2','set3']
>>> fmt = ['${:.2f}$','${}$ m','$10^{{{:.0f}}}$']
>>> rotation = [70,0,0]
>>>
>>> # create the figure
>>> plt.figure()
>>> bottom = np.zeros_like(values[0])
>>> for val,lab in zip(values,labels):
...     plt.bar(xticks+0.05,val,0.9,bottom=bottom,label=lab,color=plottools.color.default.next())
...     bottom += val
...
>>>
>>> plt.legend(framealpha=0.7,loc='upper right')
>>> plt.ylabel('y-label')
>>>
>>> # add categories on the x-axis
>>> plottools.categorized_xticklabels(xticks+0.5,xticklabels,xticklabelnames=xticklabelnames,fmt=fmt,rotation=rotation)
>>> plt.show()
(Source code, png, hires.png, pdf)