Tutorial (easy)
Once you have downloaded the patch clamp data as previously described, you may run scripts to estimate models from this data. The following script will show you the easy way to use fit_neuron to fit a model to the data and then make voltage trace predictions. The script loads data, fits the model, makes predictions, and then plots the predictions against the recorded data.
For more information on the model object used, see: fit_neuron.models.gLIF.gLIF_model. For more information on loading data, see fit_neuron.data.data_loader.load_neuron_data().
'''
This script demonstrates the simplest way to estimate a model from data,
predict new voltage traces, and compare the predicted voltage traces
with the true voltage traces.

X_list: list of current injection traces (each element in list is a numpy array)
Y_list: list of voltage traces (each element in list is a numpy array)
dt: time step between consecutive values in each current injection / voltage trace
'''

import numpy as np
import pylab
from fit_neuron.data import load_neuron_data
from fit_neuron.models import gLIF_model

def easy_test():

    # instanciate model
    model = gLIF_model()

    # load data
    (file_id_list,X_list,Y_list,dt) = load_neuron_data(neuron_num=1,input_type="noise_only",max_file_ct=4)

    # fit model
    model.fit(X_list, Y_list, dt)

    # predict voltage traces via model
    Y_pred_list = model.predict(X_list)

    # plot predicted data vs actual data for the first voltage trace in X_list
    t_arr = dt * np.arange(len(Y_pred_list[0]))
    pylab.plot(t_arr,Y_list[0],color='blue',label='True voltage')
    pylab.plot(t_arr,Y_pred_list[0],color='green',label='Predicted voltage')
    pylab.legend()
    pylab.xlabel("Time (s)")
    pylab.ylabel("Voltage (mV)")
    pylab.title("Response to Input Current")
    pylab.show()

if __name__ == '__main__':
    easy_test()
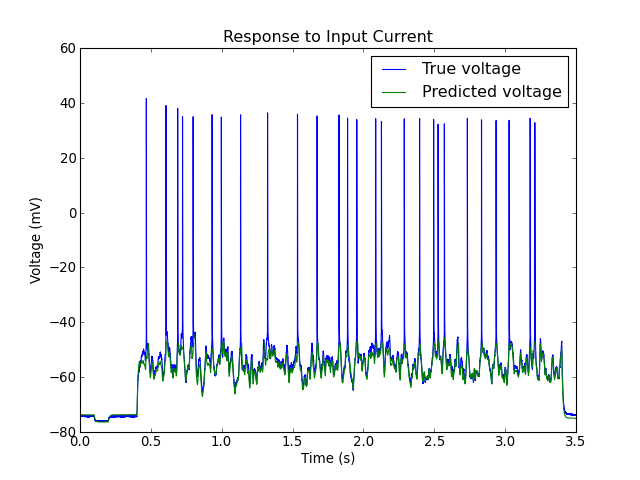
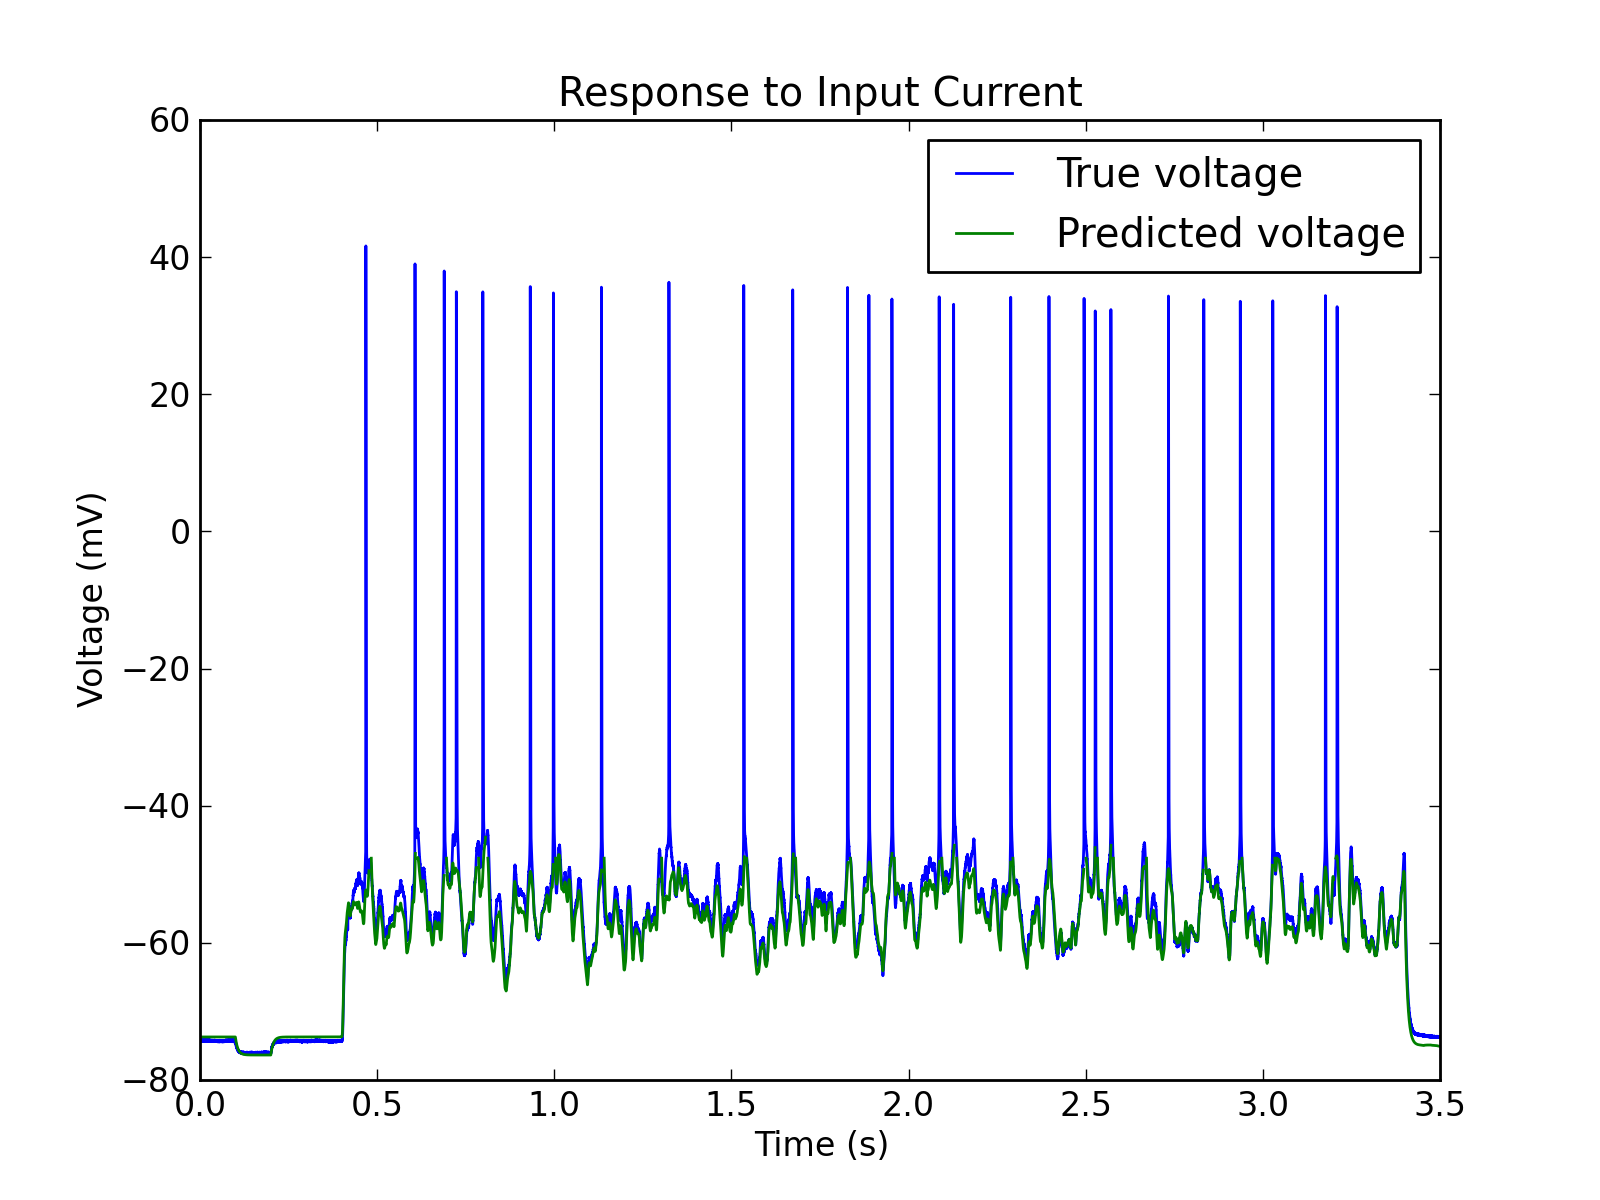
Running this script will generate the following figure.
(Source code, png, hires.png, pdf)

Note
The methods here do not simulate the upward rise in voltage when the neuron spikes.
The convention used is that the model returns a numpy typed value of  whenever the neuron is spiking. For this reason, the holes in the predicted voltage traces seen
above correspond to predictions that the neuron is spiking at those times.
whenever the neuron is spiking. For this reason, the holes in the predicted voltage traces seen
above correspond to predictions that the neuron is spiking at those times.