Surface Analysis
This example continues with the Python shell session from the previous topic Flattening Images with Surface Contaminations. You learn how to locate minima and maxima in the layer of interest in the image and how to mark them. The maxima marks the features (atoms) in the layer and properties of these features will be measured. For locating minima and maxima the following functions are available:
Masking functions:
Measuring functions:
Locating Minima and Maxima
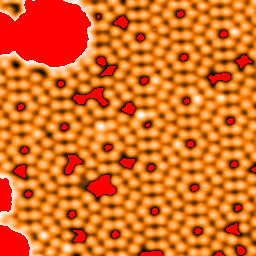
The final image im_final is created with the variable mask. To find the mask of the final image you have to use one of the masking functions mask_by_troughs_and_peaks() or mask_by_mean() and additionally clean up the mask with mask_tidy(). Mask the final image and make it tidy:
>>> final_mask, _ = spiepy.mask_by_troughs_and_peaks(im_final)
>>> final_mask = spiepy.mask_tidy(final_mask)
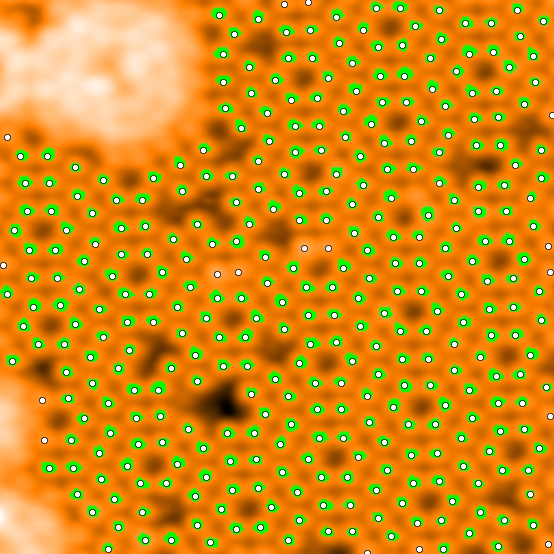
With the function locate_troughs_and_peaks() you can locate the minima and maxima in the image. This will create the variable p which is a list of vectors for troughs and peaks of all of the x and y coordinates, p[0] are the vectors for troughs, p[1] are the vectors for peaks. The troughs and peaks that are in the masked area can be removed with the function locate_masked_points_and_remove(). Locate the troughs and peaks, remove the located points in the masked areas, display the image with the mask and mark the atoms:
>>> p = spiepy.locate_troughs_and_peaks(im_final)
>>> p = spiepy.locate_masked_points_and_remove(p, final_mask)
>>> plot_image = np.ma.array(im_final, mask = final_mask)
>>> fig, ax = plt.subplots()
>>> ax.imshow(plot_image, cmap = palette, origin = 'lower')
<matplotlib.image.AxesImage object at 0x03E6FB10>
>>> ax.plot(p[1][1], p[1][0], 'o', mfc = '#ffffff', ms = 5)
[<matplotlib.lines.Line2D object at 0x03E6FD10>]
>>> ax.axis((0, im_final.shape[1] - 1, 0, im_final.shape[0] - 1))
(0, 255, 0, 255)
>>> plt.tight_layout()
>>> plt.show()
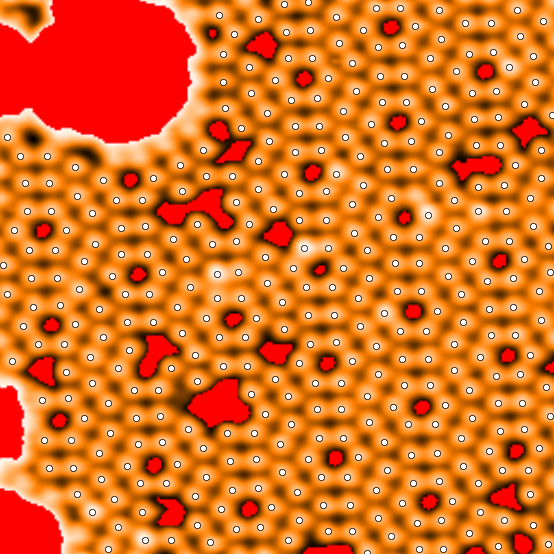
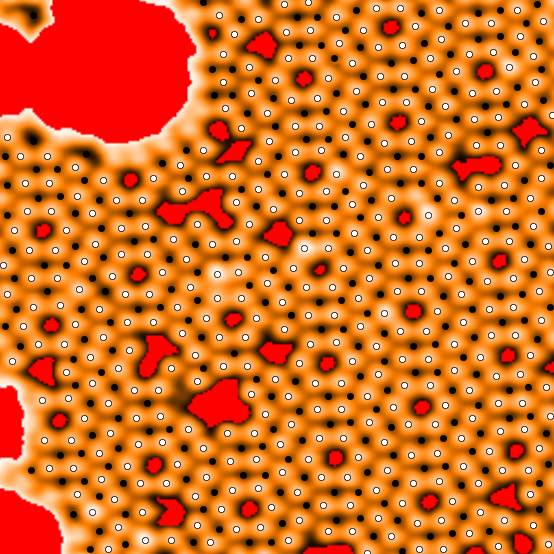
The next image will also show the marked troughs (peaks white, troughs black).
Measuring Features
The maxima (peaks) marks the features (atoms) that you are going to measure. The function measure_feature_properties() will try to measure the marked features. The measured properties are eccentricity (0 is circular, < 1 is elliptic) and area. Measure the marked features and print the results:
>>> prop = spiepy.measure_feature_properties(plot_image, p)
>>> print 'Average eccentricity:', prop['eccentricity']
Average eccentricity: 0.567148251027
>>> print 'Average area:', prop['area']
Average area: 23.8263473054
>>> print 'Number of features:', prop['count_good']
Number of features: 334
>>>