Quickstart (Command-line)
Use the following sequence of commands to generate a dynamic co-authorship network using data from the ISI Web of Science database. The examples below are from the Mac terminal, but should work on the Windows command-prompt as well.
For detailed documentation of command-line options, see Command-line Options.
Tethne is invoked using python ./tethne, where ./tethne is the path to the Tethne
Tethne can parse data from the Web of Science, JSTOR Data-for-Research, and a few other sources.
$ python ./tethne -I example_data -O ./ --read-file \
> -P /Users/erickpeirson/Desktop/savedrecs (101).txt -F WOS

----------------------------------------
        Workflow step: Read
----------------------------------------
Reading WOS data from file /Users/erickpeirson/Desktop/savedrecs.txt...done.
Read 500 papers in 1.42379593849 seconds. Accession: 90a0e7fe-c081-4749-9e7c-43534d9b9558.
Generating a new DataCollection...done.
Saving DataCollection to /tmp/example_data_DataCollection.pickle...done.
-I example_data tells Tethne to use the ID example_data for this dataset. This should be used for each workflow step. -O ./ tells Tethne to save output (e.g. statistics and networks) to the current working directory.
-F WOS tells Tethne that the data is in Web of Science field-tagged format.
The slice step tells Tethne how to partition your dataset for analysis.
If you are studying network evolution over time, your first slice axis will almost always be date. In the example below, -S date,jtitle tells Tethne to slice first by date, then by jtitle.
$ python ./tethne -I example_data -O ./ --slice -S date,jtitle -M time_period \
> --slice-window-size=2 --cumulative

----------------------------------------
        Workflow step: Slice
----------------------------------------
Loading DataCollection from /tmp/example_data_DataCollection.pickle...done.
Slicing DataCollection by date...done.
Slicing DataCollection by jtitle...done.
Saving slice distribution to .//example_data_sliceDistribution.csv...done.
Saving sliced DataCollection to /tmp/example_data_DataCollection_sliced.pickle...done.
-M time_period --slice-window-size=2 tells Tethne to divide the dataset up into two-year time-periods. --cumulative means that each time-period will include data from all of the earlier time-periods.
The graph step generates networks from your data (one network per slice).
$ python ./tethne -I example_data -O ./ --graph -N author -T coauthors \
> --edge-attr=date,jtitle,ayjid

----------------------------------------
        Workflow step: Graph
----------------------------------------
Loading DataCollection with slices from /tmp/example_data_DataCollection_sliced.pickle...done.
Using first slice in DataCollection: date.
Building author graph using coauthors method...done in 1.90734863281e-05 seconds.
Saving GraphCollection to /tmp/example_data_GraphCollection.pickle...done.
Writing graph summaries to .//example_data_graphs.csv...done.
-N author -T coauthors tells Tethne to generate a coauthorship network, where nodes are authors. --edge-attr=date,jtitle tells Tethne to add the publication date and journal to each coauthorship edge.
Adding --merged would tell Tethne to ignore slicing and create a single network from the whole dataset.
The analyze step is optional. This uses methods from NetworkX and the tethne.analyze module to analyze your networks.
$ python ./tethne -I example_data -O ./ --analyze -A betweenness_centrality

----------------------------------------
        Workflow step: Analyze
----------------------------------------
Loading GraphCollection from /tmp/example_data_GraphCollection.pickle...done.
Analyzing GraphCollection with betweenness_centrality...done.
Writing graph analysis results to .//example_data_betweenness_centrality_analysis.csv...done.
Saving GraphCollection to /tmp/example_data_GraphCollection.pickle...done.
-A betweenness_centrality tells Tethne to calculate the betweenness centrality of each node in each network, and save those values as node attributes.
Tethne can write networks to a few different formats for visualization in Cytoscape or Gephi.
$ python ./tethne -I example_data -O ./ --write -W xgmml

----------------------------------------
        Workflow step: Write
----------------------------------------
Loading GraphCollection from /tmp/example_data_GraphCollection.pickle...done.
Writing graphs to ./ with format xgmml...done.
-W xgmml tells Tethne to generate a dynamic network in XGMML format.
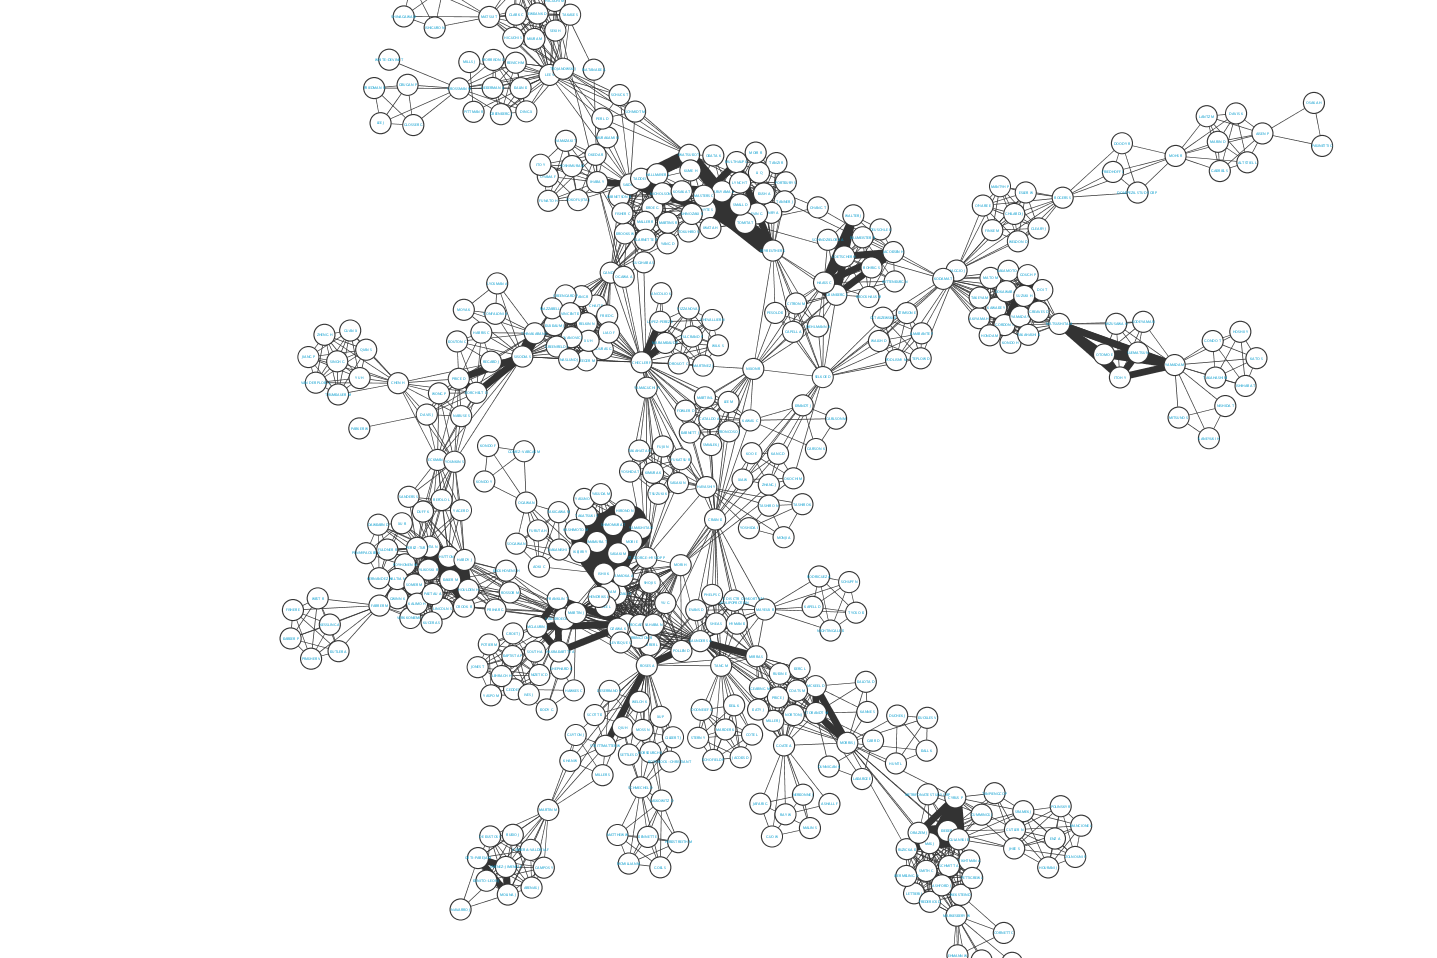
The resulting graph might look something like (edge width <- N coauthored papers):
For detailed descriptions of each workflow step, see `Step-By-Step Guide (Command-line)`_.