Command-line Options
Invoke Tethne with python [TETHNE_PATH]. To find the [TETHNE PATH], start the Python interpreter in Terminal, and import Tethne. Then call tethne.__file__. In the example below, the path that we’re looking for is /anaconda/lib/python2.7/site-packages/tethne:
$ python
Python 2.7.5 |Anaconda 1.6.1 (x86_64)| (default, Jun 28 2013, 22:20:13)
[GCC 4.0.1 (Apple Inc. build 5493)] on darwin
Type "help", "copyright", "credits" or "license" for more information.
>>> import tethne
>>> tethne.__file__
'//anaconda/lib/python2.7/site-packages/tethne/__init__.pyc'
>>>
If you are using a Mac, we recommend creating an Alias. You can then call Tethne with:
$ tethne --help
Universal arguments
The following arguments should be included each time you run Tethne. Tethne uses --dataset-id to track your dataset through the workflow, so it should remain the same in each workflow step.
| Argument | Alternative | Description |
|---|---|---|
| -I DATASET_ID | --dataset-id=DATASET_ID | Unique ID (required). |
| -t TEMP_DIR | --temp-dir=TEMP_DIR | Directory for storing temporary files (optional; default is /tmp). |
| -O OUTPATH | --outpath=OUTPATH | Path to save workflow output. Some workflow steps will generate summary statistics or other output. |
A base pattern for calling Tethne might look like:
$ python ~/Downloads/tethne-python/tethne -I fundata01 -O ~/results
This will cause all output to be saved in the results folder inside your home directory.
Workflow steps
There are 5 steps in the workflow, each with a distinct set of arguments. These should be called sequentially (only the --analyze step can be skipped).
Read
Parses bibliographic data. There are two ways to do this:
| Argument | Description |
|---|---|
| --read-file | Read from a single data file. Requires --data-path and --data-format. |
| --read-dir | Read from a directory containing multiple data files. Requires --data-path and --data-format. |
The following arguments are also required:
| Argument | Alternative | Description |
|---|---|---|
| -P DATAPATH | --data-path=DATAPATH | Full path to dataset. |
| -F DATAFORMAT | --data-format=DATAFORMAT | Format of input dataset (WOS, DFR). |
For example:
$ python ~/Downloads/tethne-python/tethne -I fundata01 -O ~/results --read-file \
> -P /path/to/your\ data/download.txt -F WOS
Resulting in something like:
----------------------------------------
        Workflow step: Read
----------------------------------------
Reading WOS data from file /path/to/your data/download.txt...done.
Read 500 papers in 1.69956803 seconds. Accession: 19825ab7-6176-4742-8cf2-0093d751b5f3.
Generating a new DataCollection...done.
Saving DataCollection to /tmp/fundata01_DataCollection.pickle...done.
WOS: Web of Science field-tagged format; DFR: JSTOR Data-for-Research dataset in XML format.
Slice
Slicing divides your dataset up along one or more axes (a key in the Paper class) for analysis. This prepared your dataset for comparative analysis in later steps. You might wish to, for example, analyze your dataset diachronically by slicing by date, or you might wish to compare data from different journals by slicing by jtitle. Use accession if you wish to compare data from different data files.
As of v.0.3, slicing is limited to date, jtitle, and accession.
| Argument | Description |
|---|---|
| --slice |
|
The following arguments are required:
| Argument | Alternative | Description |
|---|---|---|
| -S SLICE_AXIS | --slice-axis=AXIS | Key along which to slice the dataset. This can be any of the fields listed in Paper. |
| -M SLICE_METHOD | --slice-method=METHOD | Method used to slice DataCollection. Available methods: time_window, time_period. For details, see DataCollection.slice(). Default is time_period. |
The following arguments are optional:
| Argument | Description |
|---|---|
| --slice-window-size=SIZE | Size of slice time-window or period, in years. Default: 1. |
| --slice-step-size=SIZE | Amount to advance time-window in each step (ignored for time-period). |
| --cumulative | If True, the data from each successive slice includes the data from all preceding slices. |
For example:
$ python ~/Downloads/tethne-python/tethne -I fundata01 -O ~/results --slice \
>  -S date,jtitle -M time_window --slice-window-size=4 --slice-step-size=1 --cumulative
Resulting in something like:
----------------------------------------
    Workflow step: Slice
----------------------------------------
Loading DataCollection from /tmp/fundata01_DataCollection.pickle...done.
Slicing DataCollection by date...done.
Slicing DataCollection by jtitle...done.
Saving slice distribution to ~/results/fundata01_sliceDistribution.csv...done.
Saving sliced DataCollection to /tmp/fundata01_DataCollection_sliced.pickle...done.
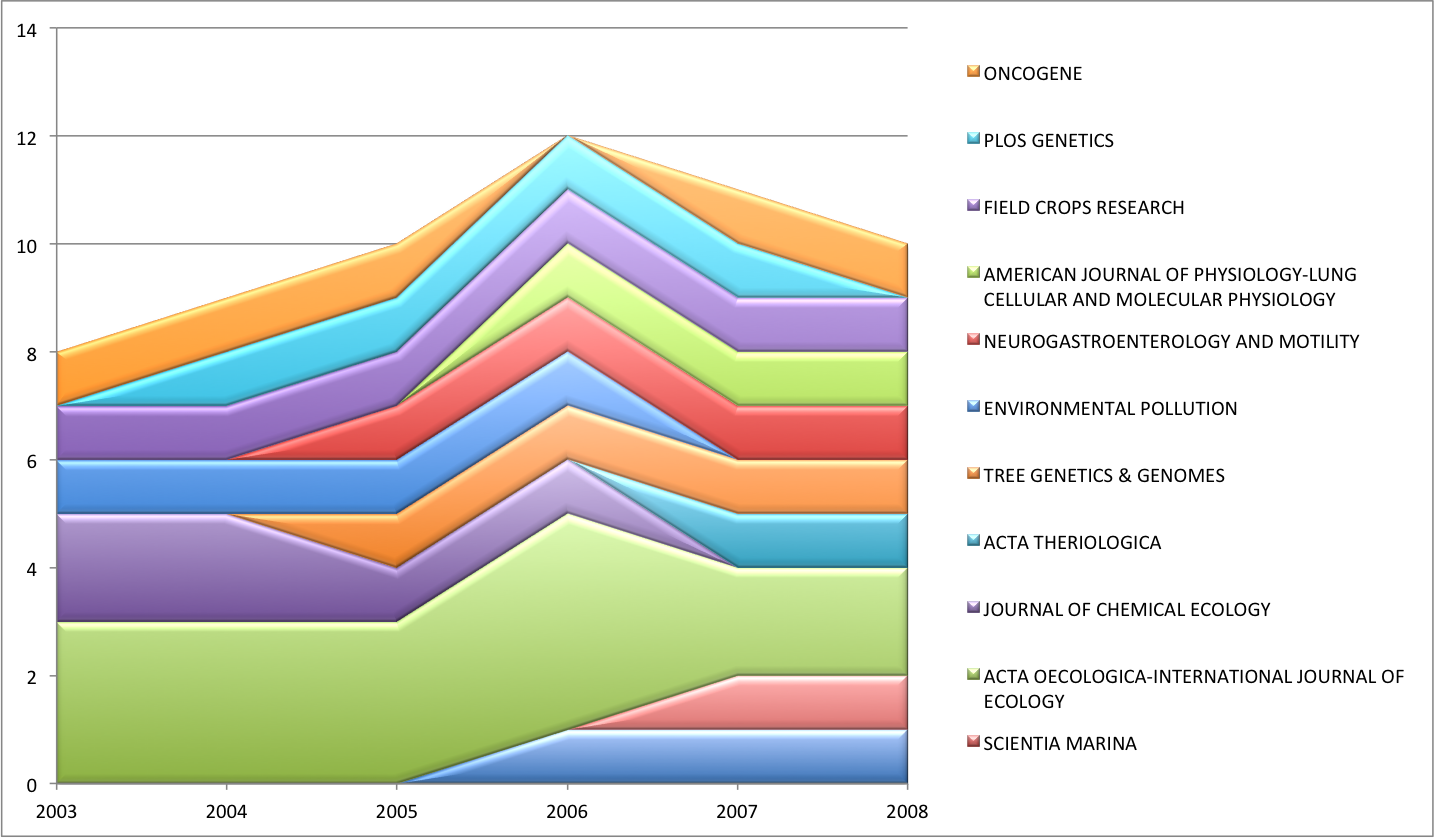
~/results/fundata01_sliceDistribution.csv contains a comma-separated table with the distribution of papers across date and jtitle. For example:
| 2003 | 2004 | 2005 | 2006 | 2007 | 2008 | |
| ENVIRONMENTAL BIOLOGY OF FISHES | 0.0 | 0.0 | 0.0 | 1.0 | 1.0 | 1.0 |
| SCIENTIA MARINA | 0.0 | 0.0 | 0.0 | 0.0 | 1.0 | 1.0 |
| ACTA OECOLOGICA-INTERNATIONAL JOURNAL OF ECOLOGY | 3.0 | 3.0 | 3.0 | 4.0 | 2.0 | 2.0 |
| JOURNAL OF CHEMICAL ECOLOGY | 2.0 | 2.0 | 1.0 | 1.0 | 0.0 | 0.0 |
| ACTA THERIOLOGICA | 0.0 | 0.0 | 0.0 | 0.0 | 1.0 | 1.0 |
| TREE GENETICS & GENOMES | 0.0 | 0.0 | 1.0 | 1.0 | 1.0 | 1.0 |
| ENVIRONMENTAL POLLUTION | 1.0 | 1.0 | 1.0 | 1.0 | 0.0 | 0.0 |
| NEUROGASTROENTEROLOGY AND MOTILITY | 0.0 | 0.0 | 1.0 | 1.0 | 1.0 | 1.0 |
| FIELD CROPS RESEARCH | 1.0 | 1.0 | 1.0 | 1.0 | 1.0 | 1.0 |
| PLOS GENETICS | 0.0 | 1.0 | 1.0 | 1.0 | 1.0 | 0.0 |
| ONCOGENE | 1.0 | 1.0 | 1.0 | 0.0 | 1.0 | 1.0 |
You can easily visualize these data using your favorite spreadsheet software.
Graph
| Argument | Description |
|---|---|
| --graph | Generate a graph (or collection of graphs). If --outpath is set, produces a table with the number of nodes and edges per graph in [OUTPATH]/[DATASET_ID]_graphs.csv. |
The following arguments should be used:
| Argument | Alternative | Description |
|---|---|---|
| -N NODE_TYPE | --node-type=TYPE | Must be one of: author, paper. |
| -T GRAPH_TYPE | --graph-type=TYPE | Name of a network-builing method. Can be one of any of the methods listed in networks. e.g. if -n is author, -t could be coauthors. |
Available network-building methods (as of v0.3.0-alpha)
| Node Type | Graph Type | Method |
|---|---|---|
| paper | author_coupling | tethne.networks.papers.author_coupling() |
| paper | bibliographic_coupling | tethne.networks.papers.bibliographic_coupling() |
| paper | cocitation | tethne.networks.papers.cocitation() |
| paper | direct_citation | tethne.networks.papers.direct_citation() |
| author | author_cocitation | tethne.networks.authors.author_cocitation() |
| author | author_coinstitution | tethne.networks.authors.author_coinstitution() |
| author | author_papers | tethne.networks.authors.author_papers() |
| author | coauthors | tethne.networks.authors.coauthors() |
If you have sliced your data in a previous step, but wish to generate a network based on the entire dataset, you may use:
| Argument | Description |
|---|---|
| --merged | Ignore DataCollection slicing, and build a single graph from all Papers. |
Some methods use additional keyword arguments that affect the resulting graph. The following arguments can be used to set common keyword arguments. The meaning of these arguments varies between methods; consult networks for descriptions of each network-building method.
| Argument | Description |
|---|---|
| --threshold=THRESHOLD | Set the ‘threshold’ argument. Applies to all except: direct_citation, author_institution, author_papers. |
| --topn=TOPN | Set the ‘topn’ argument. Applies to: cocitation. |
| --node-attr=NODE_ATTR | List of attributes to include for each node. e.g. --node-attr=date,atitle,jtitle. Applies to: all. |
| --edge-attr=EDGE_ATTR | List of attributes to include for each edge. e.g. --edge-attr=ayjid,atitle,date. Applies to: all. |
| --node-id=NODE_ID | Field to use as node id (for papers graphs). e.g. --node-id=ayjid. Applies to: all paper methods. |
| --weighted | Trigger the ‘weighted’ argument. Applies to: bibliographic_coupling. |
For example:
$ python ~/Downloads/tethne-python/tethne -I fundata01 -O ~/results --graph \
> -N author -T coauthors --edge-attr=ayjid,date,jtitle
Resulting in something like:
----------------------------------------
        Workflow step: Graph
----------------------------------------
Loading DataCollection with slices from /tmp/fundata01_DataCollection_sliced.pickle...done.
Using first slice in DataCollection: date.
Building author graph using coauthors method...done in 0.426736116409 seconds.
Saving GraphCollection to /tmp/fundata01_GraphCollection.pickle...done.
Writing graph summaries to ~/results/fundata01_graphs.csv...done.
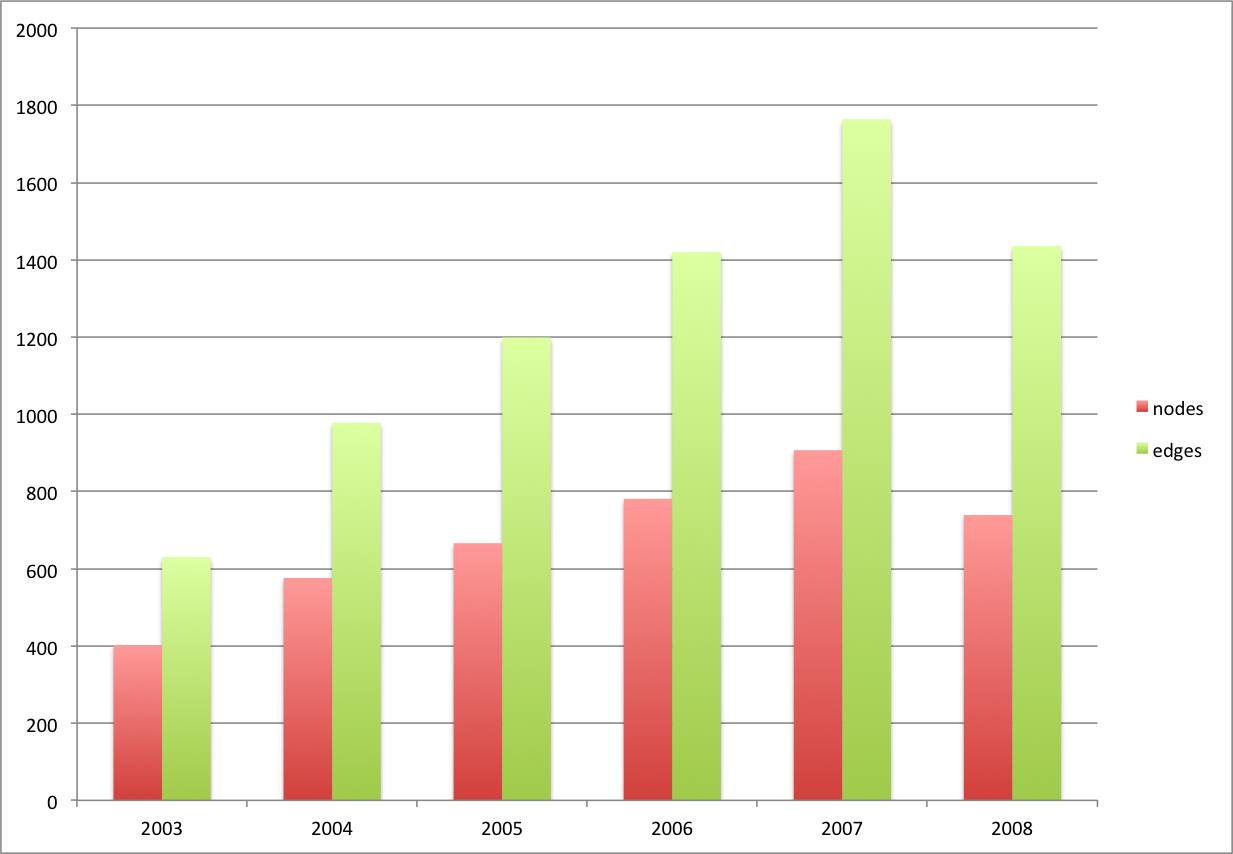
~/results/fundata01_graphs.csv contains a comma-separated table with the number of nodes and edges per graph (indexed by date, in this case). For example:
| index | nodes | edges |
| 2003 | 402 | 630 |
| 2004 | 576 | 978 |
| 2005 | 666 | 1199 |
| 2006 | 781 | 1420 |
| 2007 | 907 | 1764 |
| 2008 | 739 | 1436 |
You can easily visualize these data using your favorite spreadsheet software.
Analyze
The analysis workflow step is optional. As of v0.3.0-alpha, --analyze triggers analyze.collection.algorithm(), which calls a graph analysis algorithm in NetworkX. So far this has been tested for centrality algorithms only.
| Argument | Description |
|---|---|
| --analyze | Analyze a graph (or collection of graphs). If --outpath is set, produces a table with the mean and variance of the algorithm result for each graph, in [OUTPATH]/[DATASET_ID]_[ALGORITHM]_analysis.csv. |
Use the --algorithm argument to select an algorithm. This should be the name of an method in the `NetworkX centrality algorithm methods <http://networkx.github.io/documentation/latest/reference/algorithms.centrality.html>`+_.
| Argument | Alternative | Description |
|---|---|---|
| -A ALGORITHM | --algorithm=ALGORITHM | Name of a NetworkX graph analysis algorithm. |
For example:
$ python ~/Downloads/tethne-python/tethne -I fundata01 -O ~/results --analyze \
> -A betweenness_centrality
Resulting in something like:
----------------------------------------
        Workflow step: Analyze
----------------------------------------
Loading GraphCollection from /tmp/fundata01_GraphCollection.pickle...done.
Analyzing GraphCollection with betweenness_centrality...done.
Writing graph analysis results to ~/results/fundata01_betweenness_centrality_analysis.csv...done.
Saving GraphCollection to /tmp/fundata01_GraphCollection.pickle...done.
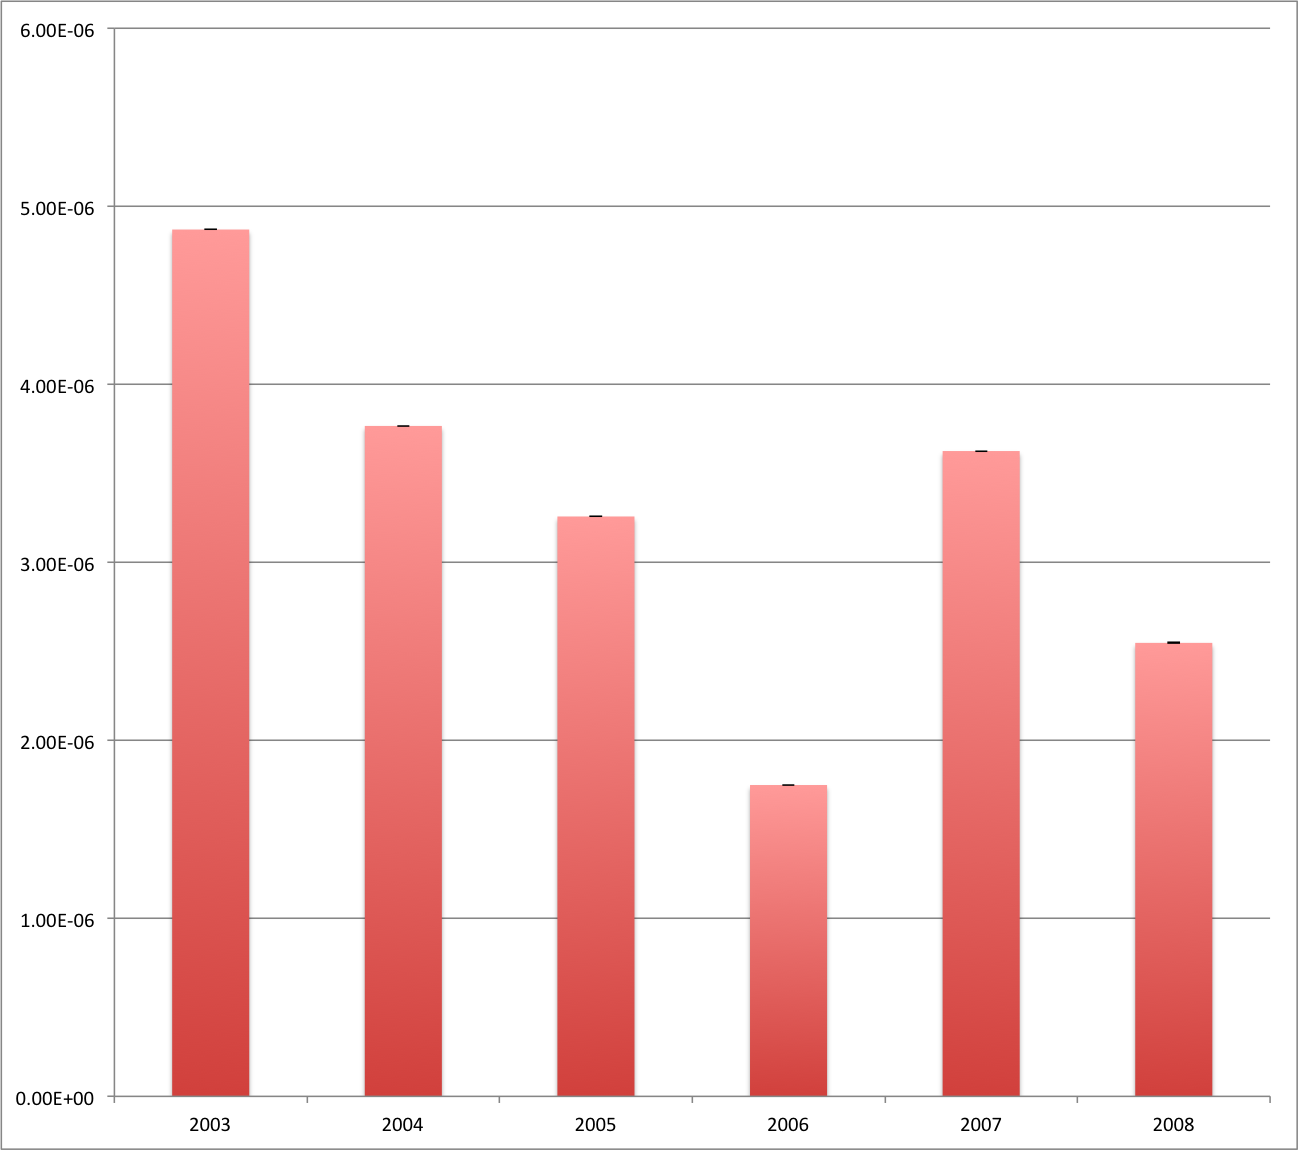
~/results/fundata01_betweenness_centrality_analysis.csv contains a comma-separated table with the mean and variance of per-node betweenness-centrality for each graph (indexed by date, in this case). For example:
| index | mean | variance |
| 2003 | 4.8696666294462848e-06 | 5.8521060847378354e-10 |
| 2004 | 3.7662643707182407e-06 | 5.0172975473198493e-10 |
| 2005 | 3.2576284954217712e-06 | 4.8988211004664643e-10 |
| 2006 | 1.749020895995168e-06 | 1.5297987419477807e-10 |
| 2007 | 3.6252321590741106e-06 | 1.4535627363876269e-09 |
| 2008 | 2.5476025127262327e-06 | 1.0268407559417709e-09 |
You can easily visualize these data using your favorite spreadsheet software.
Write
You can visualize networks using software like Cytoscape or Gephi. The writing workflow step involves converting a collection of NetworkX graphs into a structured graph file. Tethne can generate both static and dynamic networks. If a static network format is chosen, each graph in the collection will be written to a separate file.
| Argument | Description |
|---|---|
| --write | Write a graph (or collection of graphs) to a structured format, in [OUTPATH]. |
The --write-format argument is required:
| Argument | Alternative | Description |
|---|---|---|
| -W WRITE_FORMAT | –write-format=FORMAT | Output format for graph(s). If a static graph format is chosen (e.g. graphml), each slice in the GraphCollection will result in a separate file. Supported writers: (static) graphml; (dynamic) xgmml. |
For example:
$ python ~/Downloads/tethne-python/tethne -I fundata01 -O ~/results --write \
> -W graphml
Resulting in something like:
----------------------------------------
        Workflow step: Write
----------------------------------------
Loading GraphCollection from /tmp/fundata01_GraphCollection.pickle...done.
Writing graphs to ~/results with format graphml...done.
And generating the following files in ~/results:
-rw-r--r--  1 erickpeirson  staff  196686 Feb 23 10:52 fundata01_graph_2003.graphml
-rw-r--r--  1 erickpeirson  staff  299885 Feb 23 10:52 fundata01_graph_2004.graphml
-rw-r--r--  1 erickpeirson  staff  359992 Feb 23 10:52 fundata01_graph_2005.graphml
-rw-r--r--  1 erickpeirson  staff  427821 Feb 23 10:52 fundata01_graph_2006.graphml
-rw-r--r--  1 erickpeirson  staff  515779 Feb 23 10:52 fundata01_graph_2007.graphml
-rw-r--r--  1 erickpeirson  staff  418702 Feb 23 10:52 fundata01_graph_2008.graphml
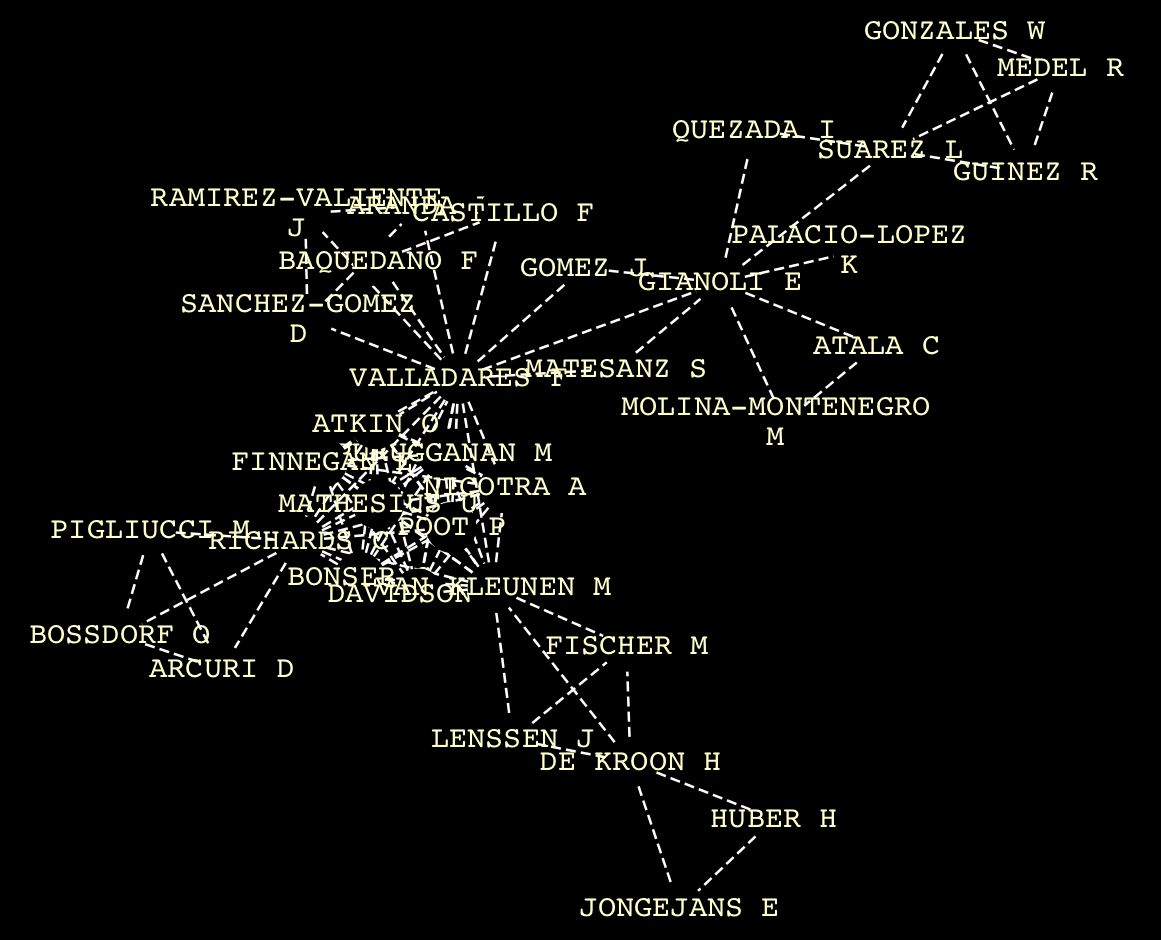
Opening fundata01_graph_2007.graphml in Cytoscape yields something like: