pyTimechart User Guide
Installation
pytimechart is based on the chaco graphic library, who is itself based on a lot of python technology. So its better to be helped by distros. Easiest installation varies between OS
Ubuntu, and debian based linux distros
apt-get and easy_install are your friends:
sudo apt-get install python-chaco python-setuptools python-lzma lzma
sudo easy_install pytimechart
Please note that chaco4.0 introduced incompatible namespace: http://blog.enthought.com/open-source/ets-4-0-released/ This leads to following error when trying to launch pytimechart:
ImportError: No module named enthought.etsconfig.api
To restore original namespace, that pytimechart uses, you will need to install another package:
sudo easy_install etsproxy
Fedora based linux distros
yum and easy_install are your friends:
sudo yum install python-chaco python-setuptools
sudo easy_install pytimechart
Windows
Windows is not as easy, but pythonxy still helps a lot. Easiest way is to install chaco is to use pythonxy python distribution.
You need to make sure that “ETS” and “wxpython” are selected for installation.
They are not selected in default install. Then, you can use easy_install to install pytimechart. In the command line window:
easy_install pytimechart
Alternatively, you can download the sources of pytimechart, and double click on the timechart.py script at root of tarball
OSX
You can use EPD to run pytimechart on OSX. Please note, that I have issues to make it run on latest version of EPD/pytimechart.
Recording a trace
Pytimechart is only a trace visualizer, it does not actually make the trace. You have to generate it with other programs.
Pytimechart supports parser for 3 kind of traces available on linux. ftrace, perf and trace-cmd. Problem with perf and trace-cmd, is that their python binding are not currently packaged by distributions. You’ll have to install them from source, and making sure you compile the python bindings. (usually build if you have python-dev package) Because of this, its currently recommended to use ftrace with pytimechart. A simple script is provided with the source of pytimechart: pytimechart-record
Basic usage of this script is (as root):
# pytimechart-record start
# ... run your workload here
# pytimechart-record stop
trace written to ~/trace11-06-11-20-13-26.txt.lzma
The script will produce you a timestamped .txt.lzma file that you can feed directly to pytimechart:
pytimechart ~/trace11-06-11-20-13-26.txt.lzma
unlike perf and trace-cmd, this script write the data to filesystem at the “stop”. During the workload, trace is kept in memory. I never needed any workload that would need more than 50MB of trace buffer.
You can modify the script as you wish, but dont worry about removing some tracepoints. They are really very low overhead, and can be filtered out by pytimechart easily if they are too noisy. Every trace type can make sense at some point. Its better to have it in.
User Interface
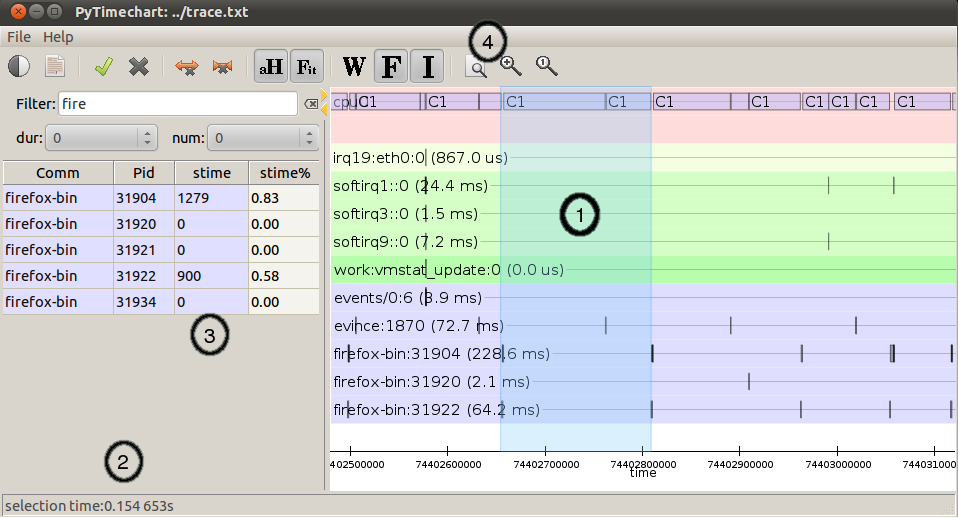
The UI is divided into 3 parts
- the timechart plot
- the process list
- the toolbar
the timechart plot
What do I see?
This is the main part of timechart. It consist of
One cpuidle line per CPU (aka C-states)
The color of the line is darker when the c-state is deeper
No drawing means the cpu is running at that time.
The name of the idle state is drawn inside the reactangle, if there is enough space (i.e. if you zoom enough)
Those can be hidden via following toolbar button

one P-states line per CPU (aka P-states)
frequency value is displayed as a usual line plot
Those can be hidden via following toolbar button

one line per visible process,
identifier of the process is displayed at the left of the line. It contains the “comm” of the process , its pid, and the total time of running.
A grey rectangle means that the process is running. Processor on which it is running is displayed inside the rectangle (provided you zoom enough, and there is actually enough space in the rectangle to display the number)
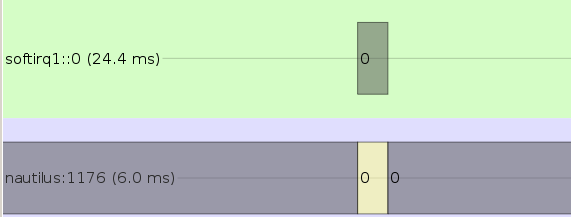
A yellow rectangle means the process is in running state, but another process has the cpu. This can happen when a process is scheduled out by the scheduler, or when its interrupted by an irq or other defered task (e.g. workqueue, tasklets). Following example shows nautilus being interrupted by softirq1 (timers)
background color of the line is showing you the type of the process (e.g. irq, workqueue, timer, runtime_pm, process, etc.)
the process list
The process list is very important for best use of pyTimechart. Usually, the trace will contain far too much information, The first thing to do is to hide a bunch of process, show only the process or event that highlight your problem, zoom on it, and show again processes that are active around this time.
The process is a simple table containing the list of all process available in your trace. The table shows 4 columns
Comm: The ‘comm’ of the process, or if its not a process, its name.
- pid: The pid of the process, or 0 if its not a real linux
process (irq, timer, etc).
stime: The time where the process is active in the current selection.
- stime%: The pourcent time where the process is active in the
current selection. (time of process active * 100 / total time of selection)
You can sort the table by clicking on column title with CTRL key down, Ctrl-clicking again will restore the original “sorted by types” order.
The process list background color correspond to the type of process (irq, workqueue, user process, etc)
When you select some process in the process list. They will be highlighted in blue in the timechart as well.
In order to easily find your processes, a filter as been implemented.
- filter by name (filter): Enter here a regular expression matching the
process you want to see. process list is updated as you type
- filter by process duration (dur): This popup menu allow you
to only show process that have minimum activity duration in the process list.
- filter by process number of activities (num): This popup menu allow you
to only show process that have minimum activity occurences in the process list. This is useful to look processes that does not stay long but generate lot of wakes.
the toolbar
The toolbar tools all have tooltips that user can see with mouseover on the tools. Following is the detailed description of each action.
invert:

Invert processes show/hide value.
This is useful, when you are fully zoomed, and you want to see if you are not missing some valuable info in the hidden processes
select all:

Select/Unselect all process visible in the process list
Thus processes that are filtered are always unselected by this command
show:

Show selected processes in the timechart
hide:

Hide selected processes in the timechart
hide others:

Hide process that are not shown at current zoom window
All processes that are not currently visible in the timechart will be hidden This is usefull when you zoom at a particular activity, and you want to unzoom without being noised by other activities.
hide onscreen:

Hide process that are shown at current zoom window
All processes that are currently visible in the timechart will be hidden This is usefull when you zoom at a particular noise activity, and you want to unzoom without being annoyed by this activity.
toggle autohide:

autoHide processes that do not have any events in the current zooming window
If this option is disabled, and a process does not have any activity in the current view, this will show an empty line, and eat vertical space for not much meaning. This is why it is recommanded to leave this setting on.
toggle auto zoom y:

Automatically set the y scale to fit the number of process shown
This make sure all the process that are not hidden fit the window vertically.
Disable this feature if you want to manually zoom though the y-axis with the CTRL+mouse wheel command.
toggle wakes:

Show/Hide the wake_events.
Wake events are generated by the “sched_wakeup” trace_event. wake events are represented by a row connecting a process to another.
Reason of wakes can be for example: * kernel driver waking up process because IO is available. * user thread releasing mutex on which another thread was waiting for.
Disabled by default because this slows down a lot graphics, and adds a lot of noise when fully unzoomed
toggle cpufreq:
Show/Hide the cpufreq representation.
toggle cpuidle:
Show/Hide the cpuidle representation.
trace text:

Shows the text trace of the selection
Sometimes, looking at the textual trace is more precise than just looking at the timechart. Moreover, all the informations of the trace is not represented by the timechart.
You can also save some part of a trace to another file with this option
zoom:

Zoom so that the selection fits the window
unzoom:

Unzoom to show the whole trace
the selection
The selection is a very important UI element of pytimechart.
1. You can start selecting part of the chart by click-and-drag with the right mouse button.
2. While selecting, you can see the duration of the selection in the status area, in the bottom of the window. This is very useful to measure the duration of an activity, frequency of a wake, etc.
3. The process list is also automatically updated with activity statistics over the time interval of the selection.
4. You can also use the toolbar action to zoom on the selection, or extract the textual trace delimited by the selection.