pytimechart
Fast graphical exploration and visualisation for linux kernel traces

pyTimechart is aimed at helping kernel developer to browse into large scale traces.
Based on very powerful and efficient plotting library Chaco, pytimechart UI feels very smooth.
Based on the python language, its plugin based architecture allow developer to very quickly implement parsing and representation of new trace-event function-trace or trace_printk
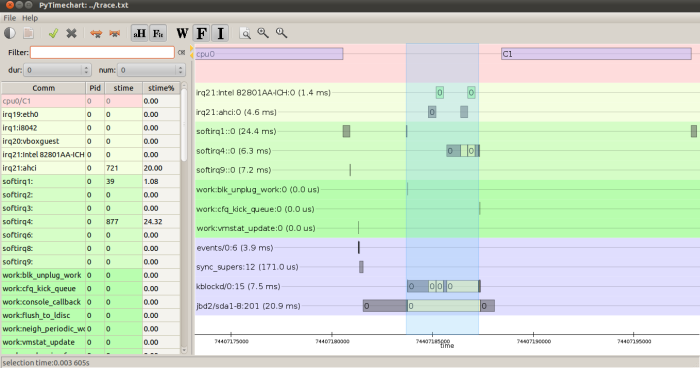
Kernel traces are parsed as trace-events, and organised into processes, each process is displayed in its own line. The x-axis representing the time, process is represented as intervals when it is scheduled in the system.
pyTimechart processes are not only process in the common unix sense, it can be any group of activities in the system. Thus pytimechart display activities of:
- cpuidle states
- cpufreq states
- runtime_pm
- irqs
- tasklets
- works
- timers
- kernel threads
- user process
- whatever there is a plugin for
pyTimechart also represent graphically the wakeup events between two process.