1. pypiview module
Utilities to lookup into pypi stats.
Warning
requires pandas and vanity packages
-
class
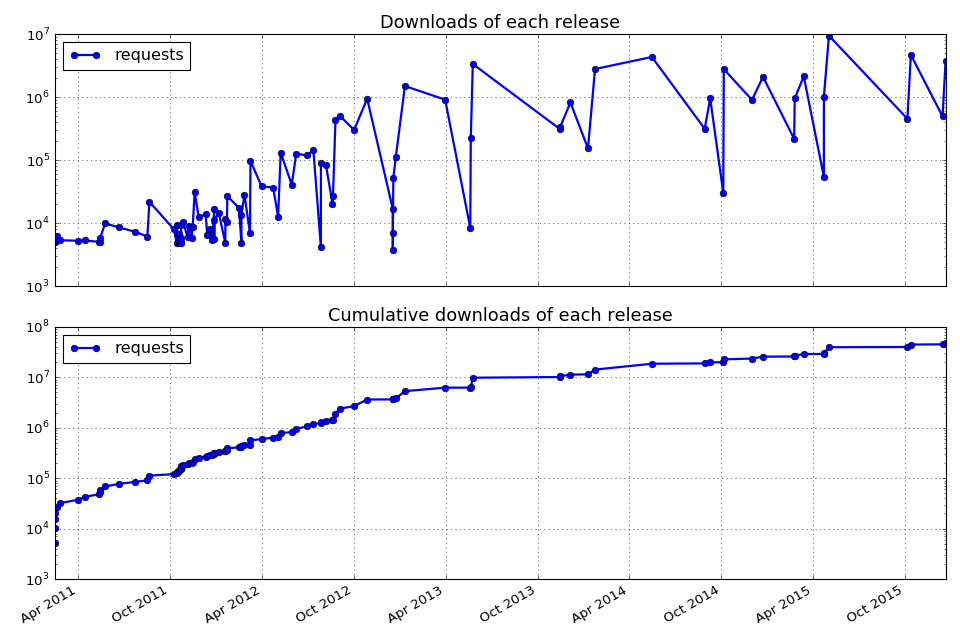
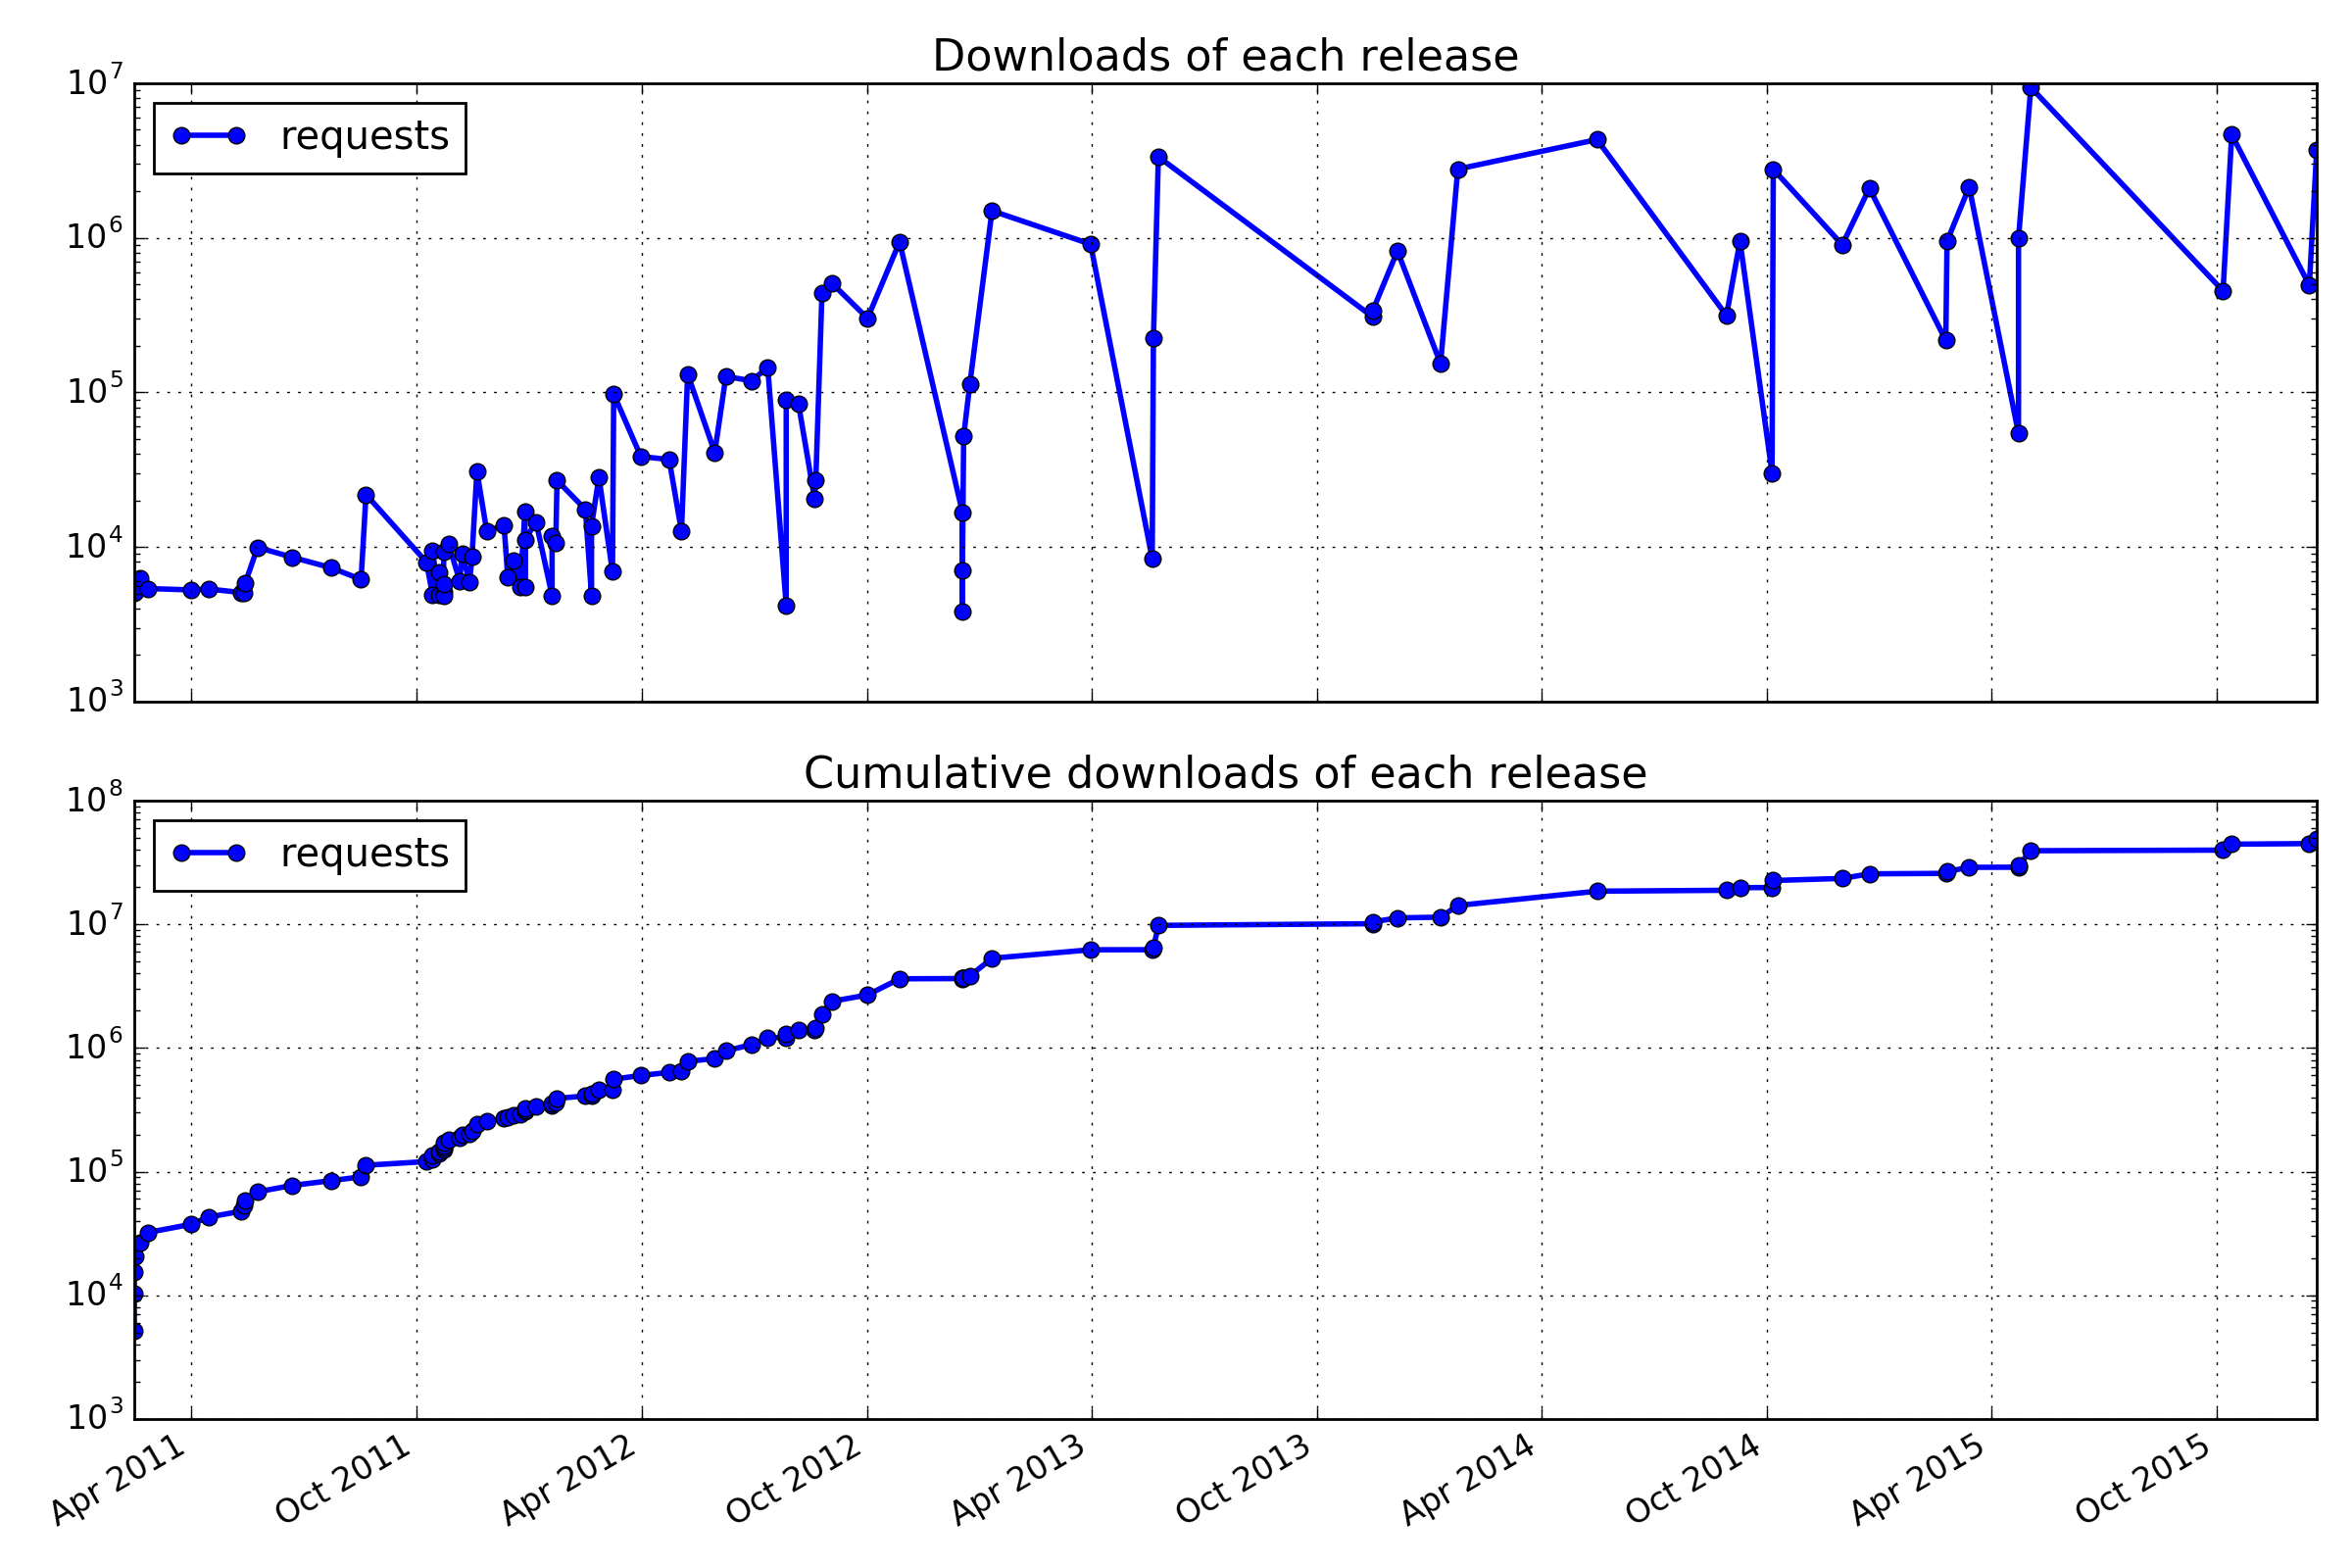
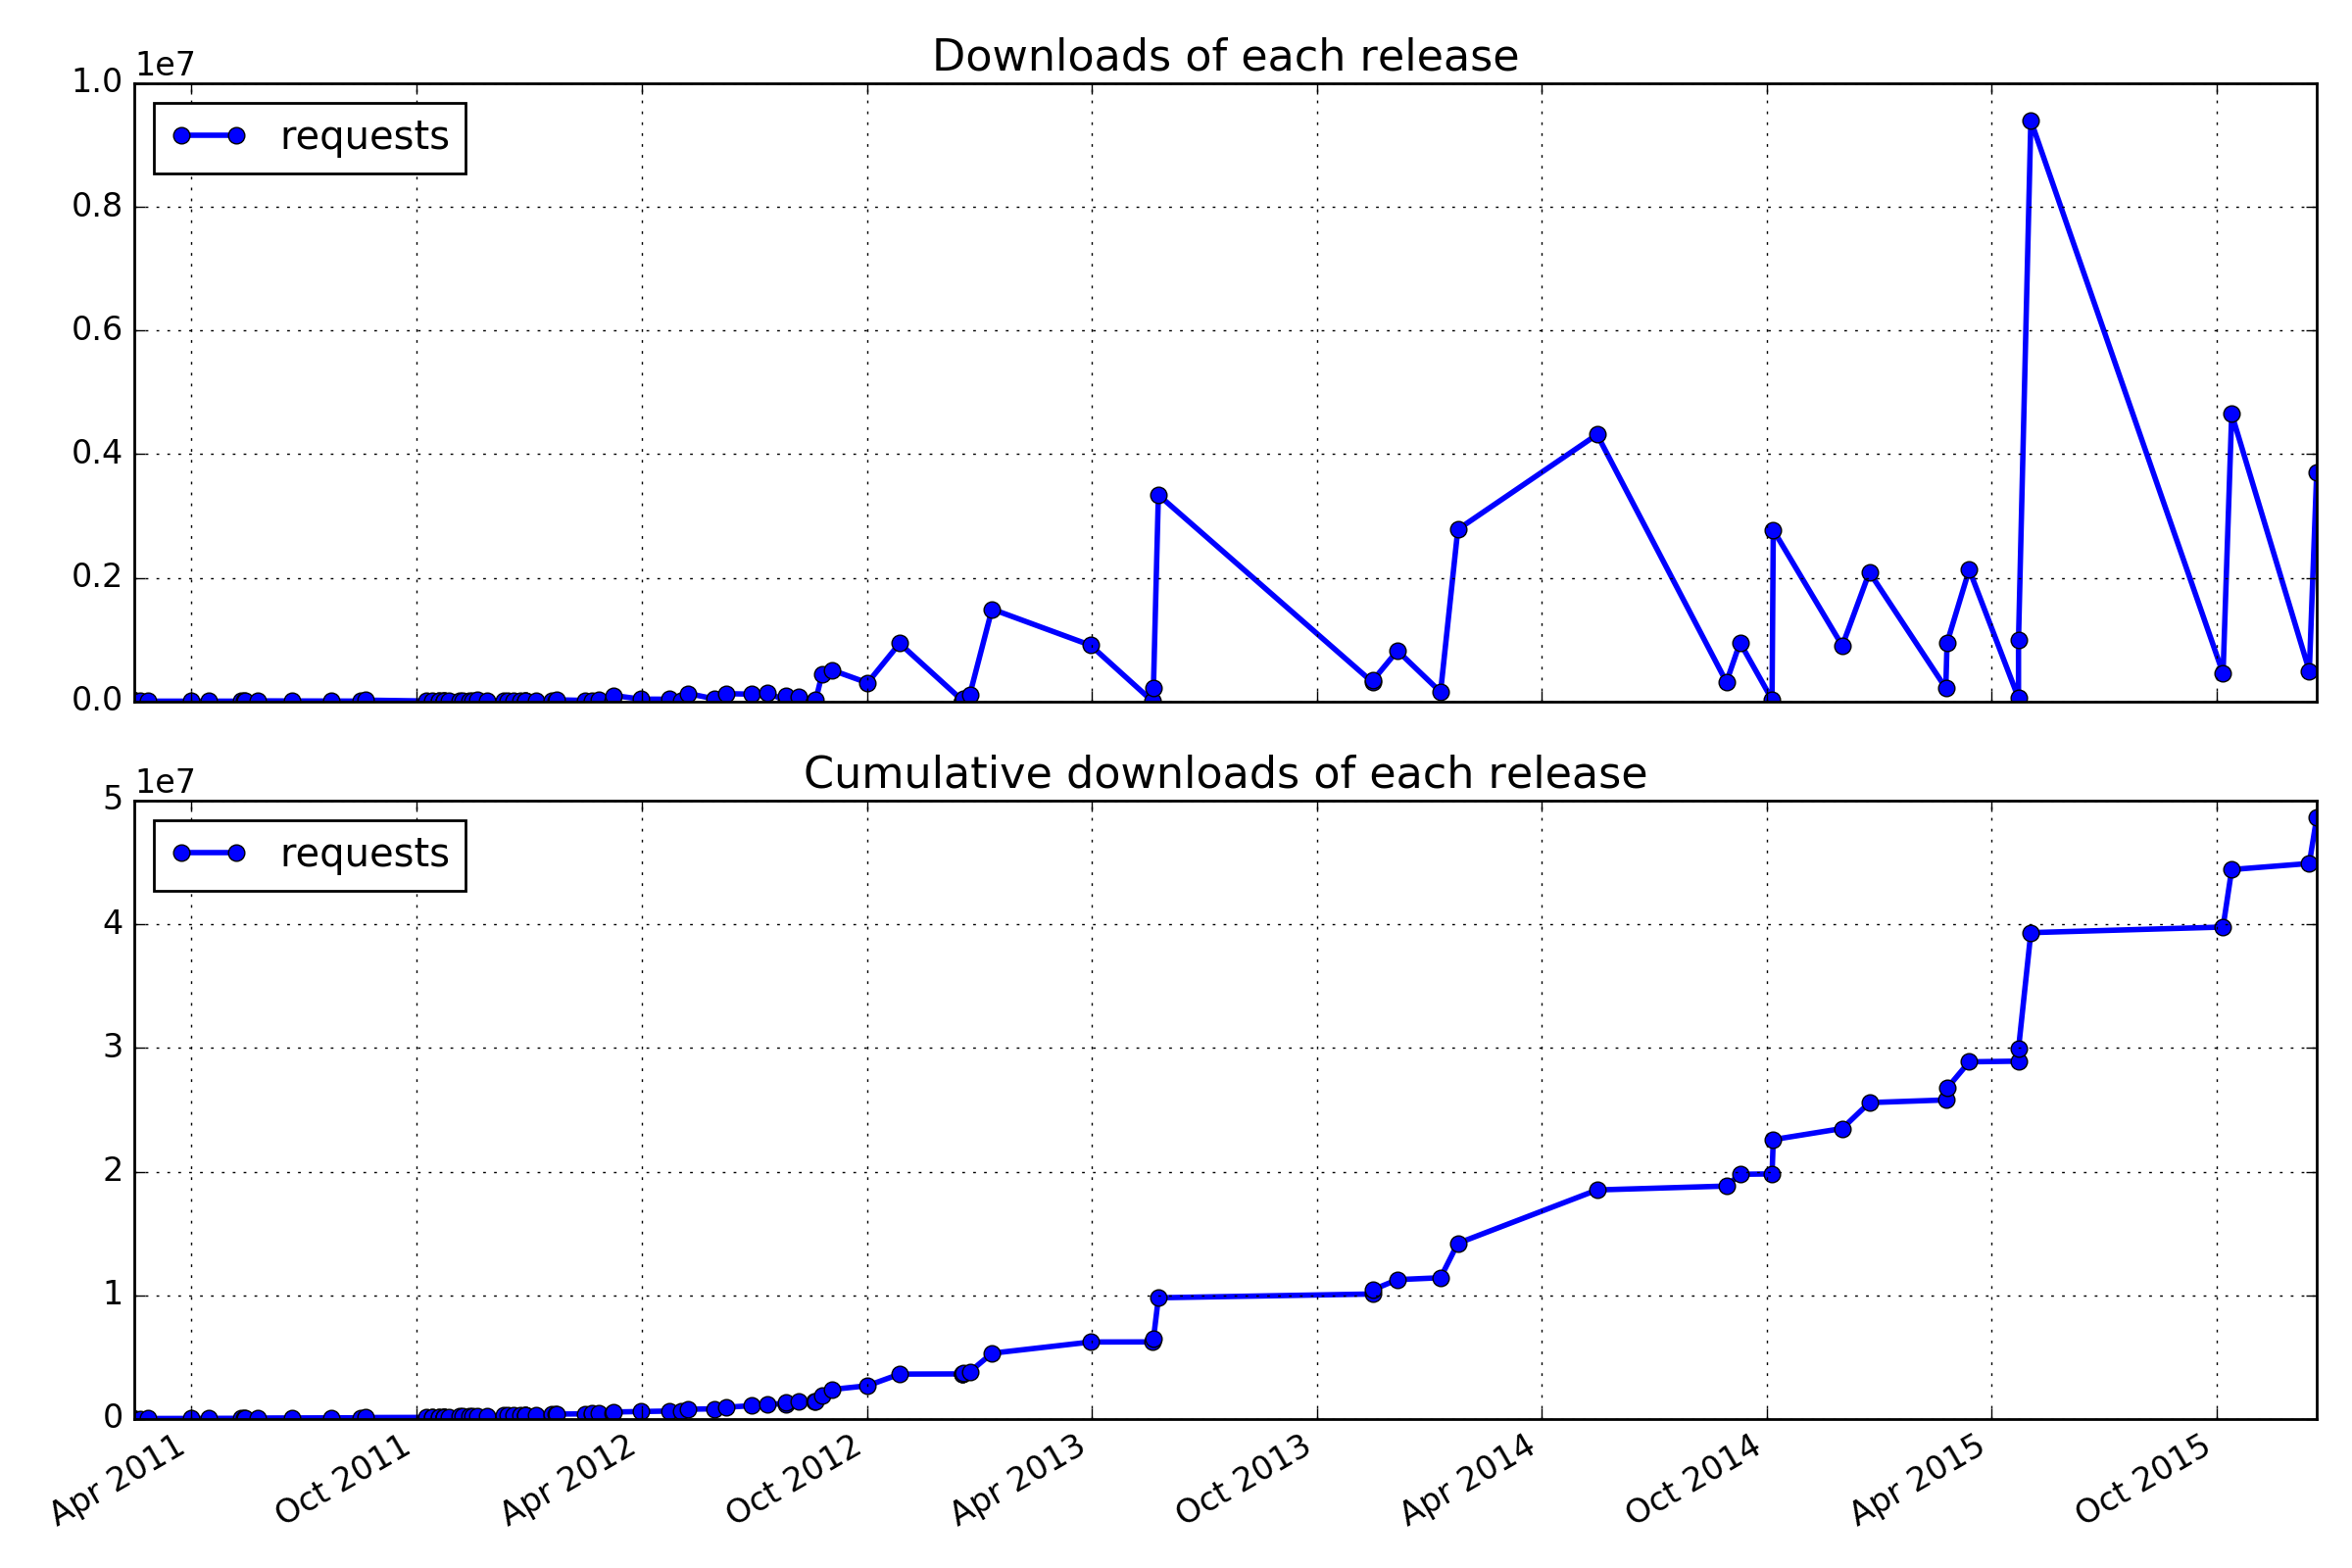
PYPIView(packages, verbose=True)[source]¶ Plot number of downloads versus time of a PYPI package.
from pypiview import PYPIView
p = PYPIView(["requests"], verbose=False)
p.plot(logy=True)
(Source code, png, hires.png, pdf)
The attribute
dfcontains the dataframe with all results. The attributetsscontains the individual TimeSeries for each package as returned byget_data_one_package().Constructor
Parameters: - packages – list of packages or single package
- verbose (bool) – print some information.
-
get_data_one_package(package)[source]¶ Return the data for one package
Parameters: pacakge (str) – a single package name Returns: a Pandas time series.
