Quickstart
Hopefully this tutorial can get you up and running fast.
PVMismatch
An explicit Python PV system IV & PV curve trace calculator which can also calculate mismatch.

Requirements
PVMismatch requires NumPy, SciPy and matplotlib. These packages are available from PyPI, Christoph Gohlke and Anaconda. You must install them prior to using PVMismatch.
Usage
Please see the documenation for tutorials and API. Bugs and feature requests can be reported on GitHub. The change history is also on GitHub.
Example
In this example let’s make a PV system of 2 strings with 8 modules each using
standard 96 cell modules. You can enter these commands in the Python
interpreter, run them from a script or simply paste them in
IPython with %paste.
>>> from pvmismatch import * # this imports everything we need
>>> pvsys = pvsystem.PVsystem(numberStrs=2, numberMods=8) # makes the system
>>> from matplotlib import pyplot as plt # now lets make some plots
>>> plt.ion() # this turns on interactive plotting
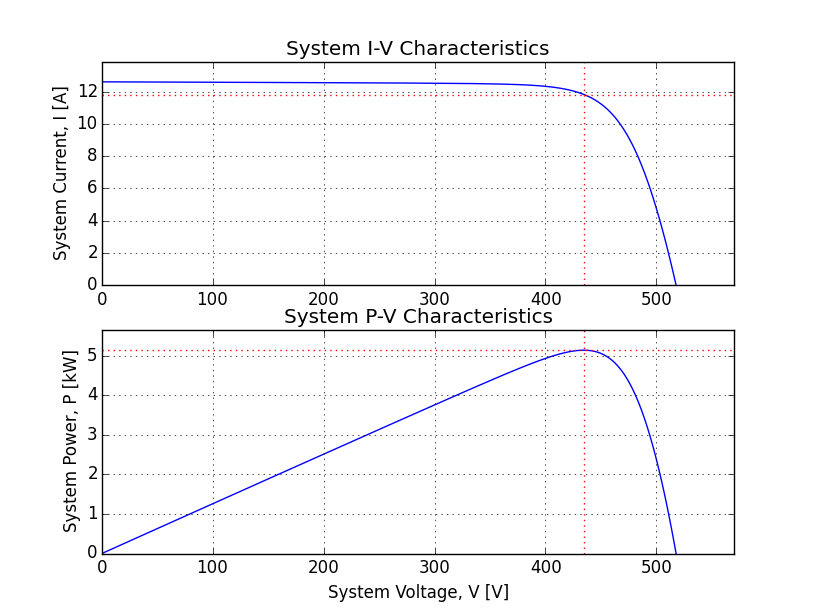
>>> f = pvsys.plotSys() # creates a figure with the system IV & PV curve
>>> pvsys.Vmp # max voltage [V]
434.78820171467481
>>> pvsys.Imp # max current [A]
11.821752935151656
>>>pvsys.Pmp # max power [W]
5139.9586997897668
>>> pvsys.FF # fill factor
0.78720728660102768
>>> pvsys.eff # efficiency
0.21824347997841023
>>> pvsys.Voc # open circuit voltage [V]
517.7428517321761
>>> pvsys.Isc # short circuit current [A]
12.611199981080691
Now lets shade the last row of the 1st module in the 1st string:
>>> pvsys.setSuns({0: {0: [(0.2, ) * 8, (11, 12, 35, 36, 59, 60, 83, 84)]}})
>>> f_shade = pvsys.plotSys()

How is this system doing now?
>>> pvsys.Vmp
402.2176762133148

>>> pvsys.Imp
11.782413660383165

>>> pvsys.Pmp
4739.0950426633335

>>> pvsys.FF
0.72444923136011019

>>> pvsys.eff
0.2020646802535036

>>> pvsys.Voc
517.5628797316385

>>> pvsys.Isc
12.63933841066166
That did a little damage - the system lost 400[W] about 8%. Let’s see what’s actually going on with those cells in the last row of the 1st module in the 1st string.
>>> pvsys.pvmods[0][0].pvcells[0] # let's see if they're actually shaded
<PVcell(Ee=1[suns], Tcell=298.15[K], Isc=6.3056[A], Voc=0.67444[V])>
>>> [pvsys.pvmods[0][0].pvcells[_] for _ in (11, 12, 35, 36, 59, 60, 83, 84)]
[<PVcell(Ee=0.2[suns], Tcell=298.15[K], Isc=1.26112[A], Voc=0.630143[V])>,
<PVcell(Ee=0.2[suns], Tcell=298.15[K], Isc=1.26112[A], Voc=0.630143[V])>,
<PVcell(Ee=0.2[suns], Tcell=298.15[K], Isc=1.26112[A], Voc=0.630143[V])>,
<PVcell(Ee=0.2[suns], Tcell=298.15[K], Isc=1.26112[A], Voc=0.630143[V])>,
<PVcell(Ee=0.2[suns], Tcell=298.15[K], Isc=1.26112[A], Voc=0.630143[V])>,
<PVcell(Ee=0.2[suns], Tcell=298.15[K], Isc=1.26112[A], Voc=0.630143[V])>,
<PVcell(Ee=0.2[suns], Tcell=298.15[K], Isc=1.26112[A], Voc=0.630143[V])>,
<PVcell(Ee=0.2[suns], Tcell=298.15[K], Isc=1.26112[A], Voc=0.630143[V])>]
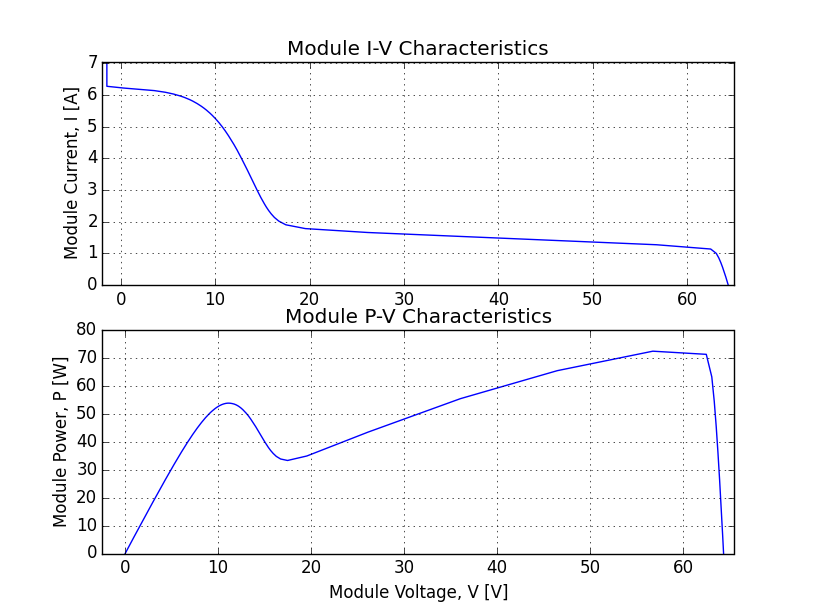
>>> f_mod00 = pvsys.pvmods[0][0].plotMod() # plot that module
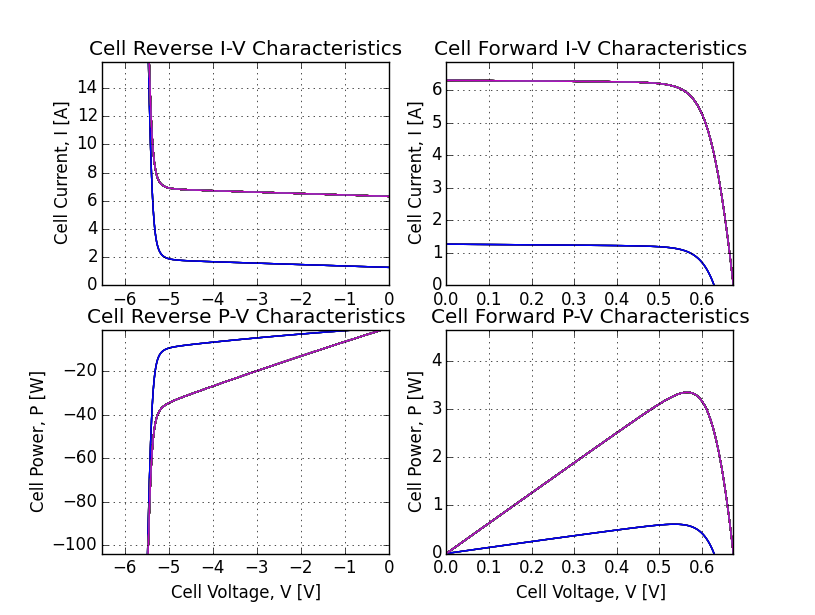
>>> f_mod00cells = pvsys.pvmods[0][0].plotCell() # plot all the cells
>>> import numpy as np # let's find the string current by interpolatign
>>> np.interp(pvsys.Vmp, pvsys.pvstrs[0].Vstring, pvsys.pvstrs[0].Istring)
5.624635929989247
Interpolation of string current from the system voltage yields 5.6[A]. Those shaded cells can only carry that current in reverse bias, so they must be hot! Let’s change their temperatures. In fact since the temperatures are still at 25[C], let’s update the normal cells too:
>>> pvsys.setTemps(50. + 273.15) # [K] normal cells
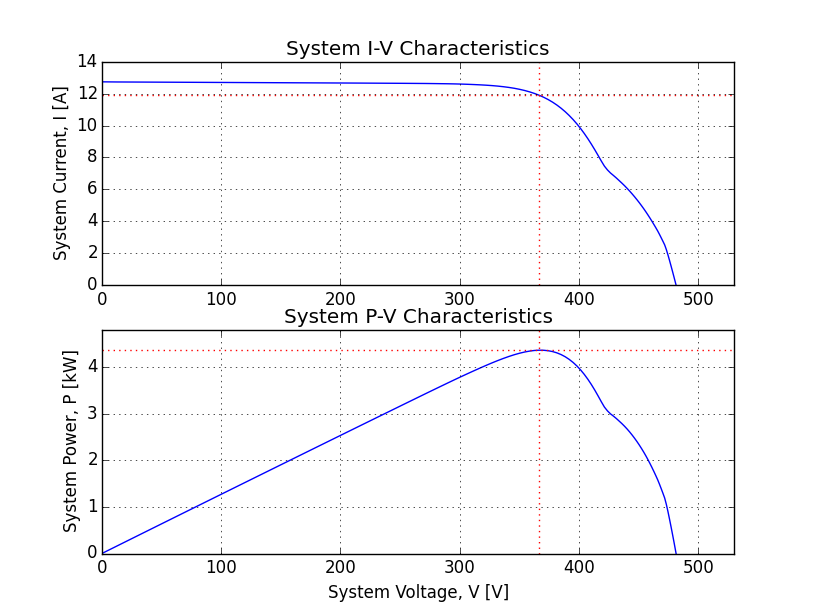
>>> pvsys.setTemps({0: {0: [(100. + 273.15, ) * 8, (11, 12, 35, 36, 59, 60, 83, 84)]}}) # [K] hot cells in RBD
>>> pvsys.pvmods[0][0].pvcells[0] # let's see if they're actually hot
<PVcell(Ee=1[suns], Tcell=323.15[K], Isc=6.36158[A], Voc=0.63443[V])>
>>> [pvsys.pvmods[0][0].pvcells[_] for _ in (11, 12, 35, 36, 59, 60, 83, 84)]
[<PVcell(Ee=0.2[suns], Tcell=373.15[K], Isc=1.29471[A], Voc=0.497765[V])>,
<PVcell(Ee=0.2[suns], Tcell=373.15[K], Isc=1.29471[A], Voc=0.497765[V])>,
<PVcell(Ee=0.2[suns], Tcell=373.15[K], Isc=1.29471[A], Voc=0.497765[V])>,
<PVcell(Ee=0.2[suns], Tcell=373.15[K], Isc=1.29471[A], Voc=0.497765[V])>,
<PVcell(Ee=0.2[suns], Tcell=373.15[K], Isc=1.29471[A], Voc=0.497765[V])>,
<PVcell(Ee=0.2[suns], Tcell=373.15[K], Isc=1.29471[A], Voc=0.497765[V])>,
<PVcell(Ee=0.2[suns], Tcell=373.15[K], Isc=1.29471[A], Voc=0.497765[V])>,
<PVcell(Ee=0.2[suns], Tcell=373.15[K], Isc=1.29471[A], Voc=0.497765[V])>]
>>> pvsys.Vmp
370.60261850573403
>>> pvsys.Imp
11.924151410534137
>>> pvsys.Pmp
4419.1217362027928
>>> pvsys.FF
0.71233263744268427
>>> pvsys.eff
0.1884217160847011
>>> pvsys.Voc
486.4780520368573
>>> pvsys.Isc
12.752339637569314
>>> f_hot = pvsys.plotSys()
Take note:
- For normal cells Voc decreases as expected when temperature is increased from 25[C] to 50[C] under the same 1[sun] conditions from 0.67444[V] to 0.63443[V]. The equivalent \(\beta V_oc = 0.15 \left[ V / C \right ]\) for 96-cells.

