joystick package
Submodules
joystick.core module
Here are some useful constants:
-
joystick.core.CALLIT_JOYSTICK_METH¶ = [‘init’, ‘start’, ‘stop’, ‘exit’, ‘add_frame’]
-
joystick.core.CALLIT_FRAME_METH¶ = [‘init’, ‘start’, ‘stop’, ‘exit’, ‘update’]
-
joystick.core.add_datapoint(ar, ar2, xnptsmax=None)¶ Concatenates ar2 at the end of ar. ar2 can either be a int/float or 1-dim vectors. Cuts the vector to xnptsmax elements.
joystick.deco module
-
joystick.deco.deco_infinite_loop(wait_time=0.5)¶ This decorator creates a daemon-thread to call the decotared joystick method in an infinite loop every wait_time seconds, as long as the joystick.running attribute is True, or until the end of the universe, whichever is first.
This is a self-aware decorator, recording all function names decorated with itself, such that all threads can be launched simultaneously with the joystick.start() method.
However, it must be initialized at run-time before use:
>>> class yuhu(joystick.Joystick):
>>>     _infinite_loop = joystick.deco_infinite_loop()
>>>     ...
- (the reason is that it must get a memory copy of the decorator
- function in order to record the decorated functions in the desired scope, not in the pakage import scope. In short, just initilize it as above and it will work)
It then can be used normally (within a class definition):
>>> @_infinite_loop(wait_time=0.5)  # in sec
>>> def repetitive_task(self, ...):
>>>     print("Next time I'm done I swear.")
-
joystick.deco.deco_thread_it(func)¶ This decorator creates a daemon-thread to wrap the decotared function into a separate thread that is started at the call of the function (not with simulation start)
>>> @joystick.deco_thread_it
>>> def wait_and_print(txt, wait_time=0.5):
>>>     time.sleep(wait_time)
>>>     print("Hey, btw: {}".format(txt))
-
joystick.deco.deco_callit(when='after', fct='init')¶ This decorator, when applied to a function f, registers it as to be called
when(‘before’ or ‘after’) the methodfct.INITMETHODinit.This is a self-aware decorator, recording all function names decorated with itself, such that all threads can be launched simultaneously with the joystick.start() method.
However, it must be initialized at run-time before use:
>>> class yuhu(joystick.Joystick):
>>>     _callit = joystick.deco_callit()
>>>     ...
- (the reason is that it must get a memory copy of the decorator
- function in order to record the decorated functions in the desired scope, not in the pakage import scope. In short, just initilize it as above and it will work)
It then can be used normally (within a class definition):
>>> @_callit('before', 'exit')
>>> def exit_warning(self):
>>>     print("OMG, you're about to exit")
joystick.frame module
-
class
joystick.frame.Frame(name, freq_up, pos=(50, 50), size=(400, 400), screen_relative=False, **kwargs)¶ Bases:
object-
__init__(name, freq_up, pos=(50, 50), size=(400, 400), screen_relative=False, **kwargs)¶ Initialises a frame, a base-class used to contain a e.g.
GraphorText.- Args:
- name (str): the frame name
- freq_up (float or None): the frequency of update of the
frame, between 1e-3 and 1e3 Hz, or
Nonefor no update - pos (px or %) [optional]: left-top corner position of the
frame, see
screen_relative - size (px or %) [optional]: width-height dimension of the
frame, see
screen_relative - screen_relative (bool) [optional]: set to
Trueto giveposandsizeas a % of the screen size, orFalseto give then as pixels
- Kwargs:
- Will be passed to the optional custom methods decorated
with
deco_callit()
- Will be passed to the optional custom methods decorated
with
-
exit(**kwargs)¶ Terminates the frame, if not already exited
-
freq_up¶ Update frequency (Hz) of the frame. Set between 1e-3 and 1e2 Hz, or
Nonefor no updating
-
reinit(**kwargs)¶ Re-initializes the frame, i.e. closes the current frame if necessary and creates a new one. Uses the parameters of initialization by default or anything provided through kwargs. See class
Framefor the description of input parameters.
-
running¶ Returns
Trueif the frame should update Set toTrue/Falseto start/stop the updating
-
show()¶ Does nothing - a bare frame does not need update
-
start(**kwargs)¶ Starts updating the frame, even if already running
-
stop(**kwargs)¶ Stops updating the frame, if not already stopped
-
typ¶ Returns the type of the frame, e.g.
Graph. Read-only.
-
visible¶ Returns
Trueif the frame has not been closed. Read-only.
-
joystick.graph module
-
class
joystick.graph.Graph(name, freq_up=1, pos=(50, 50), size=(400, 400), screen_relative=False, xnpts=30, fmt='ro-', bgcol='w', axrect=(0.1, 0.1, 0.9, 0.9), grid='k', xylim=(None, None, None, None), xnptsmax=50, axmargin=(1.1, 1.1), **kwargs)¶ Bases:
joystick.frame.Frame-
__init__(name, freq_up=1, pos=(50, 50), size=(400, 400), screen_relative=False, xnpts=30, fmt='ro-', bgcol='w', axrect=(0.1, 0.1, 0.9, 0.9), grid='k', xylim=(None, None, None, None), xnptsmax=50, axmargin=(1.1, 1.1), **kwargs)¶ Initialises a graph-frame. Use
set_xydata()andget_xydata()to set and get the x- and y-data of the graph, orset_xylim()andget_xylim()to get and set the axes limits.- Args:
- name (str): the frame name
- freq_up (float or None): the frequency of update of the frame,
between 1e-3 and 1e3 Hz, or
Nonefor no update - pos (px or %) [optional]: left-top corner position of the
frame, see
screen_relative - size (px or %) [optional]: width-height dimension of the
frame, see
screen_relative - screen_relative (bool) [optional]: set to
Trueto giveposandsizeas a % of the screen size, orFalseto give then as pixels - xnpts (int or None) [optional]: the number of data points to be
plotted. If
None, no limit is applied. - fmt (str) [optional]: the format of the line as in
plt.plot(x, y, fmt) - bgcol (color) [optional]: the background color of the graph
- axrect (list of 4 floats) [optional]: the axes bounds (l,b,w,h)
as in
plt.figure.add_axes(rect=(l,b,w,h)) - grid (color or None) [optional]: the grid color, or no grid if
None - xylim (list of 4 floats or None) [optional]: the values of the
axes limits (xmin, xmax, ymin, ymax), where any value can take
Noneto be recalculated according to the data at each update - xnptsmax (int or None) [optional]: the maximum number of data
points to be recorded, older data points will be deleted. If
None, no limit is applied. - axmargin (tuple of 2 floats) [optional]: a expand factor to
increase the (x, y) axes limits when they are automatically
calculated from the data (i.e. some xylim is
None)
- Kwargs:
- Any non-abbreviated parameter accepted by
figure.add_axes(eg.xlabel,ylabel,title,aspect) andplt.plot - Will be passed to the optional custom methods decorated
with
deco_callit()
- Any non-abbreviated parameter accepted by
-
add_datapoint(data1, data2)
-
axmargin
-
get_xydata()¶ Returns the x and y data of the graph
-
get_xylim()¶ DEPRECATED, use get_xylim_graph method instead
-
get_xylim_graph()¶ Returns the (xmin, xmax, ymin, ymax) limits of the graph
-
reinit(**kwargs)¶ Re-initializes the frame, i.e. closes the current frame if necessary and creates a new one. Uses the parameters of initialization by default or anything provided through kwargs. See class
Graphfor the description of input parameters.
-
set_xydata(x, y)¶ Sets the x and y data of the graph. Give x and y vectors as numpy arrays; only the last
xnpts()data-points will be displayed
-
set_xylim(xylim=(None, None, None, None))¶ DEPRECATED, set xylim property instead
-
show()¶ Updates the graph
-
xnpts¶ The number of data points to be plotted. Must be 1 < xnpts <=
Graph.xnptsmax. IfNone, no limit is applied.
-
xnptsmax¶ The maximum number of data points to be recorded, older data points will be deleted. Must be > 1. If
None, no limit is applied.
-
xylim
-
joystick.graphmulti module
-
class
joystick.graphmulti.GraphMulti(name, freq_up=1, pos=(50, 50), size=(400, 400), screen_relative=False, xnpts=30, nlines=2, numbering=True, lbls=None, legend=2, fmt=None, bgcol='w', axrect=(0.1, 0.1, 0.9, 0.9), grid='k', xylim=(None, None, None, None), xnptsmax=50, axmargin=(1.1, 1.1), **kwargs)¶ Bases:
joystick.graph.Graph-
__init__(name, freq_up=1, pos=(50, 50), size=(400, 400), screen_relative=False, xnpts=30, nlines=2, numbering=True, lbls=None, legend=2, fmt=None, bgcol='w', axrect=(0.1, 0.1, 0.9, 0.9), grid='k', xylim=(None, None, None, None), xnptsmax=50, axmargin=(1.1, 1.1), **kwargs)¶ Initialises a graph-frame. Use
set_xydata()andget_xydata()to set and get the x- and y-data of the graph, orset_xylim()andget_xylim()to get and set the axes limits.- Args:
- name (str): the frame name
- freq_up (float or None): the frequency of update of the frame,
between 1e-3 and 1e3 Hz, or
Nonefor no update - pos (px or %) [optional]: left-top corner position of the
frame, see
screen_relative - size (px or %) [optional]: width-height dimension of the
frame, see
screen_relative - screen_relative (bool) [optional]: set to
Trueto giveposandsizeas a % of the screen size, orFalseto give then as pixels - xnpts (int or None) [optional]: the number of data points to be
plotted. If
None, no limit is applied. - nlines (int): the number of lines in the frame
- numbering (bool) [optional]: whether to display the index (or labels) of the lines near the left-most data-point
- lbls (list of str) [optional]: the labels to display in the
legend. Default
Noneis equivalent to['L0', ..., 'Ln-1'] - legend (int or False) [optional]: if
False: no legend, elselegendis its location (0 to 10, see loc in plt.legend) - fmt (str or list of str) [optional]: the format of the lines as in
plt.plot(x, y, fmt). Leave toNonefor auto. - bgcol (color) [optional]: the background color of the graph
- axrect (list of 4 floats) [optional]: the axes bounds (l,b,w,h)
as in
plt.figure.add_axes(rect=(l,b,w,h)) - grid (color or None) [optional]: the grid color, or no grid if
None - xylim (list of 4 floats or None) [optional]: the values of the
axes limits (xmin, xmax, ymin, ymax), where any value can take
Noneto be recalculated according to the data at each update - xnptsmax (int or None) [optional]: the maximum number of data
points to be recorded, older data points will be deleted. If
None, no limit is applied. - axmargin (tuple of 2 floats) [optional]: a expand factor to
increase the (x, y) axes limits when they are automatically
calculated from the data (i.e. some xylim is
None)
- Kwargs:
- Any parameter accepted by
plt.figure.add_axes(eg.xlabel,ylabel,title,aspect, etc) - Any parameter accepted by
plt.plot(either a single element or a list ofnlineselements) - Will be passed to the optional custom methods decorated
with
deco_callit()
- Any parameter accepted by
-
get_xydata(ln=None)¶ Returns the x and y data from all lines in the graph: ([x0,x1,...], [y0,y1,...]), unless
lnis an integer
-
lbls¶ The list of labels for the legend (len=
nlines()) Set toNoneto simply display [‘L0’, ..., ‘Ln-1’].
-
legend(show, lbls=[], loc=None, **kwargs)¶ Turns the legend on/off interactively
- Args:
- show (bool):
TrueorFalsewhether to display - lbls (None or list of str): the labels of the legend.
See
lbls(). Leave to[]for no change in labels - loc (int): the location of the legend, as in
plt.legend
- show (bool):
- Kwargs:
- Any parameter accepted by
plt.figure.ax.legend
- Any parameter accepted by
-
nlines¶ The number of lines in the display
-
numbering¶ Whether to display the line-boxes on the graph
-
set_xydata(x, y, ln=None)¶ Sets the x and y data of the graph. If
lnis leftNone, the data of all lines will be set. In that case, x and y are expected to be lists (len=nlines()) of numpy 1d-vectors.If
lnis an integer (i.e. line-index), only this line will be updated x and y shall be numpy 1d-vectors.For each line, only the last
xnpts()data-points will be displayed
-
joystick.image module
-
class
joystick.image.Image(name, freq_up=1, pos=(50, 50), size=(400, 400), screen_relative=False, background='black', foreground='green', cmap='gist_earth', cm_bounds=(None, None), unitperpx=1.0, axrect=(0.1, 0.1, 0.9, 0.9), grid=None, **kwargs)¶ Bases:
joystick.frame.Frame-
__init__(name, freq_up=1, pos=(50, 50), size=(400, 400), screen_relative=False, background='black', foreground='green', cmap='gist_earth', cm_bounds=(None, None), unitperpx=1.0, axrect=(0.1, 0.1, 0.9, 0.9), grid=None, **kwargs)¶ Initialises an image-frame.
- Args:
- name (str): the frame name
- freq_up (float or None): the frequency of update of the frame,
between 1e-3 and 1e3 Hz, or
Nonefor no update - pos (px or %) [optional]: left-top corner position of the
frame, see
screen_relative - size (px or %) [optional]: width-height dimension of the
frame, see
screen_relative - screen_relative (bool) [optional]: set to
Trueto giveposandsizeas a % of the screen size, orFalseto give then as pixels - cmap (colormap name) [optional]: the colormap of the image
- cm_bounds (tuple of 2 float) [optional]: the (min, max) values of the colormap
- unitperpx (float) [optional]: unit scaling
- axrect (list of 4 floats) [optional]: the axes bounds (l,b,w,h)
as in
plt.figure.add_axes(rect=(l,b,w,h)) - grid (color or None) [optional]: the grid color, or no grid
if
None
- Kwargs:
- aspect: see
plt.imshow, default ‘auto’ - origin: see
plt.imshow, default ‘lower’ - Any non-abbreviated parameter accepted by
figure.add_axesandplt.imshow - Will be passed to the optional custom methods decorated
with
deco_callit()
- aspect: see
-
cm_bounds¶ The (min, max) values of the colormap.
-
cmap¶ The colormap name of the image
-
get_data()¶ Returns the image.
-
reinit(**kwargs)¶ Re-initializes the frame, i.e. closes the current frame if necessary and creates a new one. Uses the parameters of initialization by default or anything provided through kwargs. See
Imagefor the description of input parameters.
-
reset_image(data=None, **kwargs)¶ Resets the image in the frame (cmap, cm_bounds), axes, etc, using the kwargs provided (default is values of initialization). See
Imagefor accepted parameters.
-
set_data(data)¶ Sets the image. If the data shape does not corerspond to the current data shape, the
reset_image()is called.
-
show()¶ Updates the image
-
joystick.joystick module
-
class
joystick.joystick.Joystick(**kwargs)¶ Bases:
object-
__init__(**kwargs)¶ Main class to be wrapped (see example.py)
- Kwargs:
- Will be passed to the optional custom methods decorated
with
deco_callit()
- Will be passed to the optional custom methods decorated
with
-
add_frame(frame, **kwargs)¶ Adds a frame to the simulation. Use it as:
>>> self.mygraph = self.add_frame(frame)
-
exit(**kwargs)¶ Terminates the simulation
-
running¶ Returns
Trueif the simulation is running Set toTrue/Falseto start/stop the simulation
-
start(**kwargs)¶ Starts the simulation if not already running nor exited Starts each individual frame (calls
start_frames())
-
start_frames()¶ Turns on the updating of all frames, keeps the simulation as it was, running or not
-
stop(**kwargs)¶ Stops the simulation if not already exited or stopped Does not individually stop each frames, although frames will stop updating given that the simulation is no longer running; i.e. does not call
stop_frames().
-
stop_frames()¶ Stops all frames from updating, the simulation continues running
-
joystick.scatter module
-
class
joystick.scatter.Scatter(name, freq_up=1, pos=(50, 50), size=(400, 400), screen_relative=False, xnpts=30, c='r', s=20, bgcol='w', axrect=(0.1, 0.1, 0.9, 0.9), grid='k', xylim=(None, None, None, None), xnptsmax=50, axmargin=(1.1, 1.1), cmap='gist_earth', vmin=None, vmax=None, **kwargs)¶ Bases:
joystick.graph.Graph-
__init__(name, freq_up=1, pos=(50, 50), size=(400, 400), screen_relative=False, xnpts=30, c='r', s=20, bgcol='w', axrect=(0.1, 0.1, 0.9, 0.9), grid='k', xylim=(None, None, None, None), xnptsmax=50, axmargin=(1.1, 1.1), cmap='gist_earth', vmin=None, vmax=None, **kwargs)¶ Initialises a graph-frame. Use
set_xydata()andget_xydata()to set and get the x- and y-data of the graph, orset_xylim()andget_xylim()to get and set the axes limits.- Args:
- name (str): the frame name
- freq_up (float or None): the frequency of update of the frame,
between 1e-3 and 1e3 Hz, or
Nonefor no update - pos (px or %) [optional]: left-top corner position of the
frame, see
screen_relative - size (px or %) [optional]: width-height dimension of the
frame, see
screen_relative - screen_relative (bool) [optional]: set to
Trueto giveposandsizeas a % of the screen size, orFalseto give then as pixels - xnpts (int or None) [optional]: the number of data points to be
plotted. If
None, no limit is applied. - c (color, sequence, or sequence of color): the color of the
markers, as in
plt.scatter. - s (scalar or vector): the size of the markers, as in
plt.scatter - bgcol (color) [optional]: the background color of the graph
- axrect (list of 4 floats) [optional]: the axes bounds (l,b,w,h)
as in
plt.figure.add_axes(rect=(l,b,w,h)) - grid (color or None) [optional]: the grid color, or no grid if
None - xylim (list of 4 floats or None) [optional]: the values of the
axes limits (xmin, xmax, ymin, ymax), where any value can take
Noneto be recalculated according to the data at each update - xnptsmax (int or None) [optional]: the maximum number of data
points to be recorded, older data points will be deleted. If
None, no limit is applied. - axmargin (tuple of 2 floats) [optional]: a expand factor to
increase the (x, y) axes limits when they are automatically
calculated from the data (i.e. some xylim is
None) - cmap (str or colormap): the colormap of the scatter colors
- vmin (float or None): the value corresponding to the min of
the colorbar, or
Nonefor auto-scaling - vmax (float or None): the value corresponding to the max of
the colorbar, or
Nonefor auto-scaling
- Kwargs:
- Any non-abbreviated parameter accepted by
figure.add_axes(eg.xlabel,ylabel,title,aspect) andplt.scatter - Will be passed to the optional custom methods decorated
with
deco_callit()
- Any non-abbreviated parameter accepted by
-
c
-
cmap¶ The colormap of the scatter points
-
get_xydata()¶ Returns the (x, y, c, s) data of the scatter points
-
s
-
set_xydata(x, y, c=None, s=None)¶ Sets the x, y, c and s data of the points. Only the last
xnpts()data-points will be displayed
-
vmax
-
vmin
-
joystick.text module
-
class
joystick.text.Text(name, freq_up=1, pos=(50, 50), size=(400, 400), screen_relative=False, background='black', foreground='green', rev=True, font=('consolas', 11), mark_line=True, mark_fmt='%H:%M:%S > ', scrollbar=True, **kwargs)¶ Bases:
joystick.frame.Frame-
__init__(name, freq_up=1, pos=(50, 50), size=(400, 400), screen_relative=False, background='black', foreground='green', rev=True, font=('consolas', 11), mark_line=True, mark_fmt='%H:%M:%S > ', scrollbar=True, **kwargs)¶ Initialises a text-frame. Use
add_text()to add text to it.- Args:
- name (str): the frame name
- freq_up (float or None): the frequency of update of the frame,
between 1e-3 and 1e3 Hz, or
Nonefor no update - pos (px or %) [optional]: left-top corner position of the
frame, see
screen_relative - size (px or %) [optional]: width-height dimension of the
frame, see
screen_relative - screen_relative (bool) [optional]: set to
Trueto giveposandsizeas a % of the screen size, orFalseto give then as pixels - background (color) [optional]: background color of the frame
- foreground (color) [optional]: text color of the frame
- rev (bool) [optional]: if
True, a new line will be added on the top of the text - font (tuple (font, size)) [optional]: the font of the text
- mark_line (bool) [optional]: if
True, each line will be prepended using theText.mark_fmtformat - mark_fmt (str) [optional]:
time.strftimeformat to be used for (optionally) prepending each text added to the frame - scrollbar (bool) [optional]: if
True, a Y-scrollbar is added
- Kwargs:
- wrap (str): wrap mechanism (default ‘word’)
- undo (bool): authorized undoing if
True - Any non-abbreviated parameter accepted by
tkinter.Text - Will be passed to the optional custom methods decorated
with
deco_callit()
-
add_text(txt='', end=None, newline=True, mark_line=None, encoding='utf-8')¶ Adds the text
txtto the frame, on a newline ifnewlineisTrue. The newtxtis prepended using the format inText.mark_fmtifmark_lineisTrue, default isText.mark_line. It is added at the end of the frame text ifrevisTrue, default is not(Text.rev).
-
clear()¶ Flushes the text in the frame
-
reinit(**kwargs)¶ Re-initializes the frame, i.e. closes the current frame if necessary and creates a new one. Uses the parameters of initialization by default or anything provided through kwargs. See class
Textfor the description of input parameters.
-
show()¶ Updates the text
-
Module contents

| Name: | joystick |
|---|---|
| Website: | https://github.com/ceyzeriat/joystick |
| Author: | Guillaume Schworer |
| Version: | 0.3 |
Joystick provides a light-weight and simple framework to real-time data-plotting and logging, while the console remains accessible to manage the on-going simulation and data acquisition.
In some ways, this framework can replace a Graphical User Interface (GUI) on many projects, as long as 1) the user is comfortable enough with managing the simulation using command-lines, and 2) the display of the real-time data is not too complex.
Allright. Let’s say you have some data-stream (serial port, web scraping, on-going simulation or experiment, etc), and you would like to plot or log in real-time whatever is happening. In addition you would also like to send commands to interact with the mechanisms producing the data... without having to build a GUI (which looks pretty to your boss, but is time-consumming both in initial design and maintenance).
Then, this package is for you.
Note that Joystick is based on Tkinter to display frames of text or graph, and that it is released under the GNU General Public License v3 or later (GPLv3+).
Straight to the point: check-out this example. It generates fake random data (ydata) between 0 and 1.05 every 0.2 second, displayed as a function of time in a graph-frame. Whenever there is a datapoint above 1, it drops a warning in the text-frame.
import joystick as jk
import numpy as np
import time

class test(jk.Joystick):
    # initialize the infinite loop and callit decorators so they can auto-
    # register methods they decorate
    _infinite_loop = jk.deco_infinite_loop()
    _callit = jk.deco_callit()

    @_callit('before', 'init')
    def _init_data(self, *args, **kwargs):
        # Function automatically called at initialization, thanks to the
        # decorator
        self.xdata = np.array([])  # time x-axis
        self.ydata = np.array([])  # fake data y-axis

    @_callit('after', 'init')
    def _build_frames(self, *args, **kwargs):
        # Function automatically called at initialization, thanks to the
        # decorator. It will be called after "_init_data" given that it is
        # declared after
        # create a graph frame
        self.mygraph = self.add_frame(
                   jk.Graph(name="test", size=(500, 500), pos=(50, 50),
                            fmt="go-", xnpts=15, freq_up=7, bgcol="y",
                            xylim=(0,10,0,1), xlabel='t', ylabel='random'))
        # create a text frame
        self.mytext = self.add_frame(
                      jk.Text(name="Y-overflow", size=(500, 250),
                              pos=(600, 50), freq_up=1))

    @_callit('before', 'start')
    def _set_t0(self):
        # initialize t0 at start-up
        self._t0 = time.time()

    @_infinite_loop(wait_time=0.2)
    def _get_data(self):
        # This method will automatically be called with simulation start
        # (t.start()), and looped every 0.2 in a separate thread as long as
        # the simulation runs (running == True)
        # It gets new data (fake random data) and pushes it to the frames.
        # concatenate data on the time x-axis
        new_x_data = time.time()
        self.xdata = jk.core.add_datapoint(self.xdata,
                                           new_x_data,
                                           xnptsmax=self.mygraph.xnptsmax)
        # concatenate data on the fake data y-axis
        new_y_data = np.random.random()*1.05
        # check overflow for the new data point
        if new_y_data > 1:
            # send warning to the text-frame
            self.mytext.add_text('Some data bumped into the ceiling: '
                                 '{:.3f}'.format(new_y_data))
        self.ydata = jk.core.add_datapoint(self.ydata,
                                           new_y_data,
                                           xnptsmax=self.mygraph.xnptsmax)
        # prepare the time axis
        t = np.round(self.xdata-self._t0, 1)
        # push new data to the graph
        self.mygraph.set_xydata(t, self.ydata)

    @_callit('before', 'exit')
    def exit_warning(self):
        # Just a warning, automatically called with the exit method, and
        # before the exiting actually takes place (closing frames, etc)
        print("You're about to exit, frames will disappear in 1 second")
        time.sleep(1)

t = test()
t.start()
Here is what it should look like:
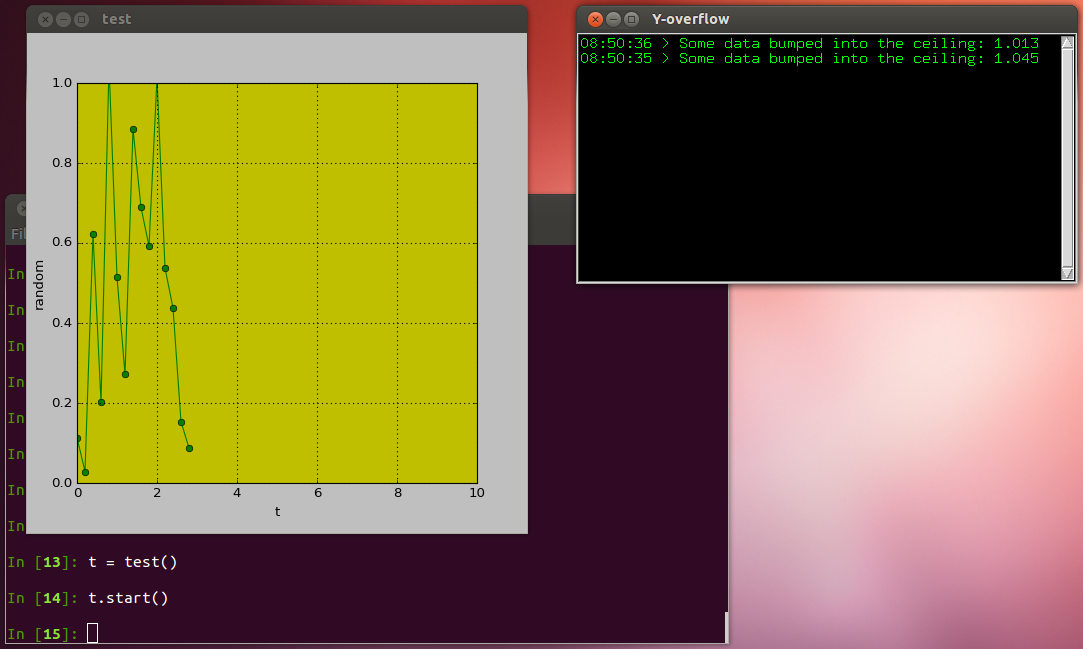
You should see a ‘snake’ going through the graph-frame, but after 10 seconds it is gone (that was on purpose, for the sake of the demo!). Type (line by line):
t.mygraph.xnpts = 50
t.mygraph.freq_up = 2
t.mygraph.xylim = (None, None, 0, 1)
Now that should be better, displaying the latest 50 points at a slower pace (twice a second), and the x-axis is auto-adjusting. Let’s stop and reinitialize the graph with slightly different parameters:
t.stop()
t.mygraph.reinit(bgcol='w', axrect=(0,0,1,1), xylim=(None, None, 0, 1))
t.start()
t.stop()
t.exit()
Too easy!
Note that this is a quick overview of the main point of this package. Other frames than simple text or graph are available: image, multi-line graph, 2D+color scatter graph, etc. Checkout the example.py for further details.
Documentation
Refer to this page, http://pythonhosted.org/joystick/joystick.html
Requirements
Joystick requires the following Python packages:
- tkinter: for the frames GUI
- NumPy: for basic numerical routines
- matplotlib: for plotting
- threading, time, functools, os: for basic stuff
Installation
The easiest and fastest way for you to get the package and run is to install joystick through pip:
$ pip install joystick
You can also download joystick source from GitHub and type:
$ python setup.py install
Dependencies will not be installed automatically. Refer to the requirements section. If you have an anaconda distribution, you will be good to go.
Contributing
Code writing
Code contributions are welcome! Just send a pull request on GitHub and we will discuss it. In the issue tracker you may find pending tasks.
Bug reporting
If you think you’ve found one please refer to the issue tracker on GitHub.
Additional options
You can either send me an e-mail or add it to the issues/wishes list on GitHub.
Citing
If you use joystick on your project, please drop me a line <mailto:{my first name}.{my family name}@gmail.com>, you will get fixes and additional options earlier.
License
Joystick is released under the GNU General Public License v3 or later (GPLv3+). Please refer to the LICENSE file.