Utility scripts
There are two scripts that complement the main ird script. Those are:
- Transfomation tool — good if you know relation between the template and subject and you just want to transform the subject in the same way as the
irdtool. - Incpection tool — intended for gaining insight into the phase correlation as such. Especially handy in cases when something goes wrong or when you want to gain insight into the phase correlation process.
Transormation tool
The classical use case of phase correlation is a situation when you have the subject, the template, and your goal is to transform the subject in a way that it matches the template. The transformation parameters are unknown, and the purpose of phase correlation is to compute them.
So the use case consists of two sub-cases:
- Compute relation of the two images, and
- transform the subject according to the result of the former.
The imreg_dft project enables you to do all using the ird script, but those two steps can be split — the first can be done by ird, whereas the second by ird-tform.
The transform parameters can be specified as an argument, or they can be read from stdin.
Therefore, those two one-liners are equivalent — the file subject-tformed.png is the rotated subject sample3.png, so it matches the template sample1.png.
Also note that the ird script alone will do the job faster.
[user@linuxbox examples]$ ird sample1.png sample3.png -o subject-tformed.png
[user@linuxbox examples]$ ird sample1.png sample3.png --print-result | ird-tform sample3.png --template sample1.png subject-tformed.png
Technically, the output of ird alone should be identical to ird-tform.
Inspection tool
The phase correlation method is built around the Fourier transform and some relatively simple concepts around it.
Although the phase correlation is an image registration technique that is highly regarded by field experts, it may produce unwanted results. In order to find out what is going on, you can request visualizations of various phases of the registration process.
Typically, you choose the template, the subject and instead of performing casual phase correlation using ird, you use ird-show.
Then, the normal phase correlation takes place and various stages of it are output in form of images (see the --display argument of ird-show).

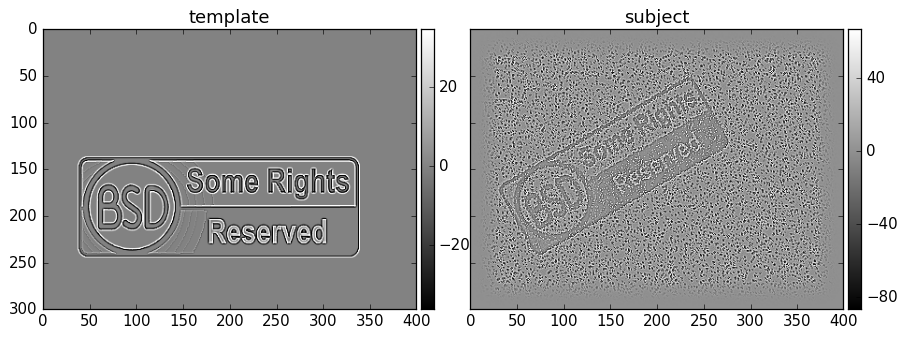
Filtered sample1.png and sample3n.jpg respectively.
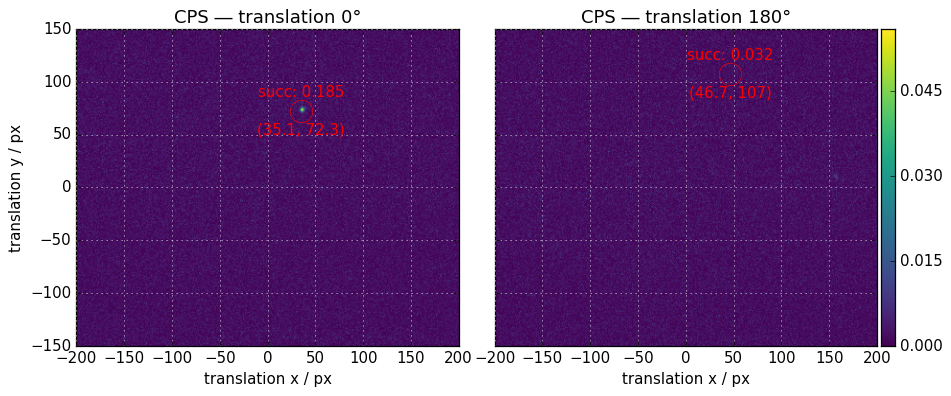
For example, consider the display of the final part of phase correlation — the translation (between the sample1.png and sample3n.jpg from the examples):

The left part shows the cross-power spectrum (CPS) of the template and rotated and scaled subject as-is. The right part shows the CPS of the template and rotated and scaled subject as-is, where the rotation angle is increased by 180°.
As we can see, the success value is much higher for the first figure, so unless there is a angle constraint, the registration procedure will assume that the match in the first figure corresponds to the successful final step of the image registration. You can visualize any subset from the table below:
| code | filename stem | what it is |
|---|---|---|
i |
ims_filt |
supplied template and subject after application of common filters |
s |
dfts_filt |
log-abs of frequency spectra of supplied template and subject (after application of common filters) |
l |
logpolars |
log-polar transform of the former |
1 |
sa |
insight into scale-angle phase correlation |
a |
after_tform |
after application of the first part of phase correlation — the angle-scale transform |
2 |
t_0, t_180 or t if terse |
insight into translation phase correlation |
t |
tiles_successes, tiles_decomp |
insight into the tiling functionality |