Utilities
Some visualisation tools
Plotting tools
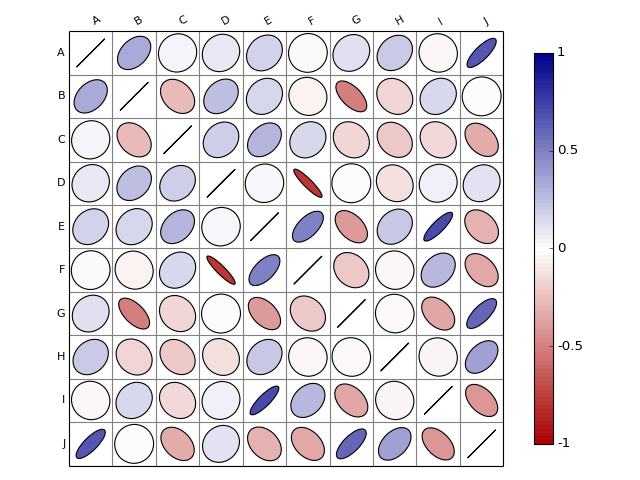
- class Corrplot(data, pvalues=None, na=0)[source]
An implementation of correlation plotting tools (corrplot)
Input must be a dataframe (Pandas) with data (any values) or a correlation matrix (square) with values between -1 and 1.
If NAs are found in the correlation matrix, there are replaced with zeros.
Data can also be a correlation matrix as a 2-D numpy array containing the pairwise correlations between variables. Labels will be numerical indices though.
By default from red for positive correlation to blue for negative ones but other colormaps can easily be provided.
from biokit.viz import corrplot
import string
letters = string.uppercase[0:10]
import pandas as pd
df = pd.DataFrame(dict(( (k, np.random.random(10)+ord(k)-65) for k in letters)))

c = corrplot.Corrplot(df)
c.plot()
(Source code, png, hires.png, pdf)

See also
All functionalities are covered in this notebook
- order(method='complete', metric='euclidean', inplace=False)[source]
Rearrange the order of rows and columns after clustering
Parameters: - method – any scipy method
- metric – any scipy distance
- inplace (bool) – if set to True, the dataframe is replaced
- plot(num=1, grid=True, rotation=30, colorbar_width=10, lower=None, upper=None, shrink=0.9, axisbg='white', colorbar=True, label_color='black', fontsize='small', edgecolor='black', method='ellipse', order=None, cmap=None)[source]
plot the correlation matrix from the content of df (dataframe)
Parameters: - grid – add grid (Defaults to True)
- rotation – rotate labels on y-axis
- lower – if set to a valid method, plots the data on the lower left triangle
- upper – if set to a valid method, plots the data on the upper left triangle
- method – shape to be used in ‘ellipse’, ‘square’, ‘rectangle’, ‘color’, ‘text’, ‘circle’, ‘number’, ‘pie’.
- cmap – a valid cmap from matplotlib of colormap package (e.g.,
jet, or
Here are some examples provided that the data is created and pass to c:
c = corrplot.Corrplor(dataframe)
c.plot(cmap=('Orange', 'white', 'green'))
c.plot(method='circle')
c.plot(colorbar=False, shrink=.8, upper='circle'  )
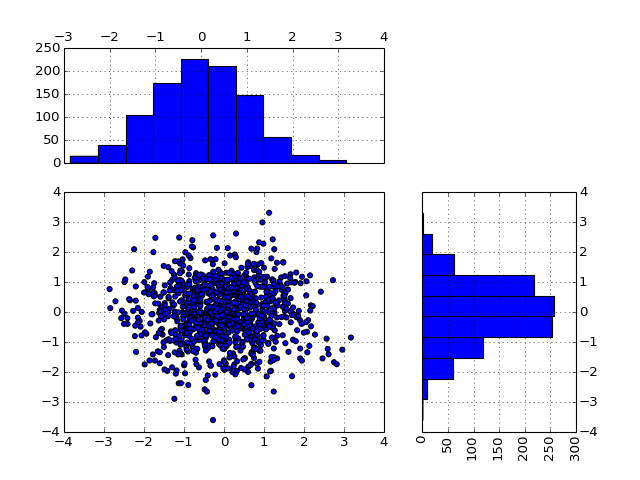
- scatter_hist(x, y=None, kargs_scatter={'s': 20, 'c': 'b'}, kargs_grids={}, kargs_histx={}, kargs_histy={}, hist_position='right', width=0.5, height=0.5, offset_x=0.1, offset_y=0.1, gap=0.06, grid=True, **kargs)[source]
data could be numpy array or list of lists of dataframe
if x and y provided, assume a 2D data set with X and Y ->> scatter if X only -> imshow from array or pandas
other kargs are: hold histx_position can be ‘top’/’bottom’ histy_position can be ‘left’/’right’
from biokit.viz import scatter_hist
import pylab
import pandas as pd
X = pylab.randn(1000)
Y = pylab.randn(1000)
df = pd.DataFrame({'X':X, 'Y':Y})
scatter_hist(df)
(Source code, png, hires.png, pdf)

See also
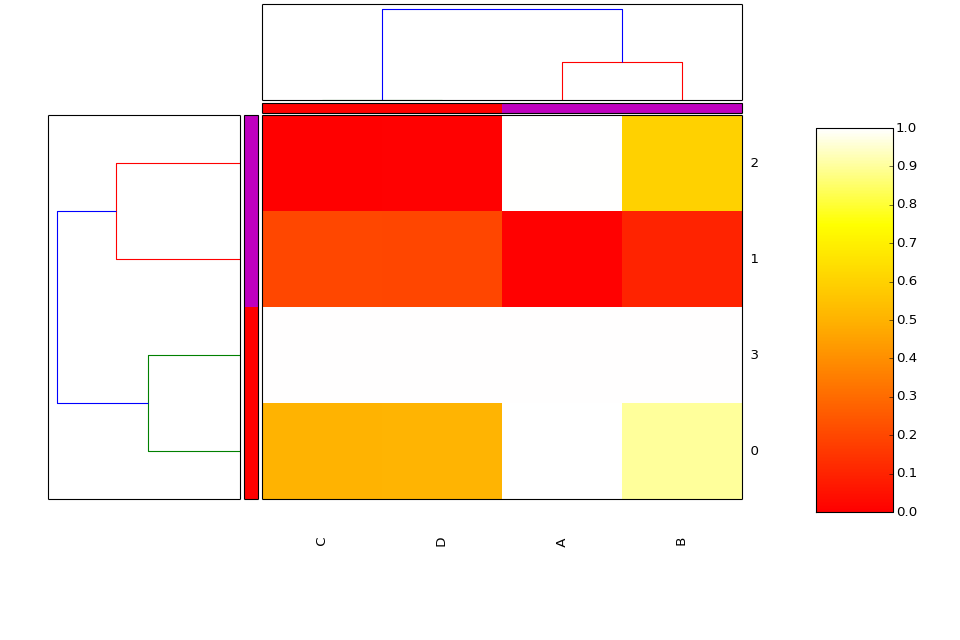
- class Heatmap(data=None, row_method='complete', column_method='complete', row_metric='euclidean', column_metric='euclidean', cmap='yellow_black_blue', col_side_colors=None, row_side_colors=None, verbose=True)[source]
Heatmap and dendograms of an input matrix
A heat map is an image representation of a matrix with a dendrogram added to the left side and to the top. Typically, reordering of the rows and columns according to some set of values (row or column means) within the restrictions imposed by the dendrogram is carried out.
from biokit.viz import heatmap
df = heatmap.get_heatmap_df()
h = heatmap.Heatmap(df)
h.plot()
(Source code, png, hires.png, pdf)
Warning
in progress
Parameters: data – a dataframe or possibly a numpy matrix. Todo
if row_method id none, no ordering in the dendogram
- column_method
- column_metric
- df
- frame
- plot(num=1, cmap='heat', colorbar=True, vmin=None, vmax=None, colorbar_position='right', gradient_span='None')[source]
Parameters: gradient_span – None is default in R iusing:
df = pd.DataFrame({'A':[1,0,1,1],
                   'B':[.9,0.1,.6,1],
                'C':[.5,.2,0,1],
                'D':[.5,.2,0,1]})
and
h = Heatmap(df)
h.plot(vmin=0, vmax=1.1)
we seem to get the same as in R wiht
df = data.frame(A=c(1,0,1,1), B=c(.9,.1,.6,1), C=c(.5,.2,0,1), D=c(.5,.2,0,1))
heatmap((as.matrix(df)), scale='none')
Todo
right now, the order of cols and rows is random somehow. could be ordered like in heatmap (r) byt mean of the row and col or with a set of vector for col and rows.
heatmap((as.matrix(df)), Rowv=c(3,2), Colv=c(1), scale=’none’)
gives same as:
df = get_heatmap_df()
h = heatmap.Heatmap(df)
h.plot(vmin=-0, vmax=1.1)
- row_method
- row_metric
Tools to handle R packages
utilities related to R language (e.g., RPackageManager, RSession)
- class RSession(RCMD='R', max_len=1000, use_numpy=True, use_pandas=True, use_dict=None, host='localhost', user=None, ssh='ssh', return_err=True, verbose=False)[source]
Interface to a R session
This class uses the pyper package to provide an access to R (via a subprocess). You can call R script and get back the results into the session as Python objects. Returned objects may be transformed into numpy arrays or Pandas datafranes.
Here is a very simple example but any complex R scripts can be provided inside the run() method:
from biokit.rtools import RSession
session = RSession()
session.run("mylist = c(1,2,3)")
a = session("mylist") # access to the R object
a.sum() # a is numpy array
There are different ways to access to the R object:
# getter
session['a']
# method-wise:
session.get('a')
# attribute:
session.a
For now, this is just to inherit from pyper.R class but there is no additional features. This is to create a common API.
Parameters: - RCMD (str) – the name of the R executable
- max_len – define the upper limitation for the length of command string. A command string will be passed to R by a temporary file if it is longer than this value.
- use_numpy (bool) – A False value will disable numpy even if it has been imported.
- use_pandas (bool) – A False value will disable pandas even if it has been imported.
- use_dict – named list will be returned a dict if use_dict is True, otherwise it will be a list of tuples (name, value).
- host – The computer name (or IP) on which the R interpreter is installed. The value “localhost” means that the R locates on the the localhost computer. On POSIX systems (including Cygwin environment on Windows), it is possible to use R on a remote computer if the command “ssh” works. To do that, the user need set this value, and perhaps the parameter “user”. not tested.
- user – The user name on the remote computer. This value need to be set only if the user name is different on the remote computer. In interactive environment, the password can be input by the user if prompted. If running in a program, the user need to be able to login without typing password! not tested.
- ssh – The program to login to remote computer. not tested
BioServices
Simple access to BioServices
BioServices is used in BioKit to access to web services (e.g., KEGG, UniProt, Ensembl...) but documentation for bioservices itself is not provided. See BioServices instead.