Set Enrichment

Determines statistically significant differences in expression levels for biological processes.
Signals
Inputs:
Data
Data set.
Reference
Data with genes for the reference set (optional).
Outputs:
Selected data
Data subset.
Description
The widget shows a ranked list of terms with p-values, FDR and enrichment. Set Enrichment is a great tool for finding biological processes that are over-represented in a particular gene or chemical set.
Sets from (GO, KEGG, miRNA and MeSH) come with the Orange installation.
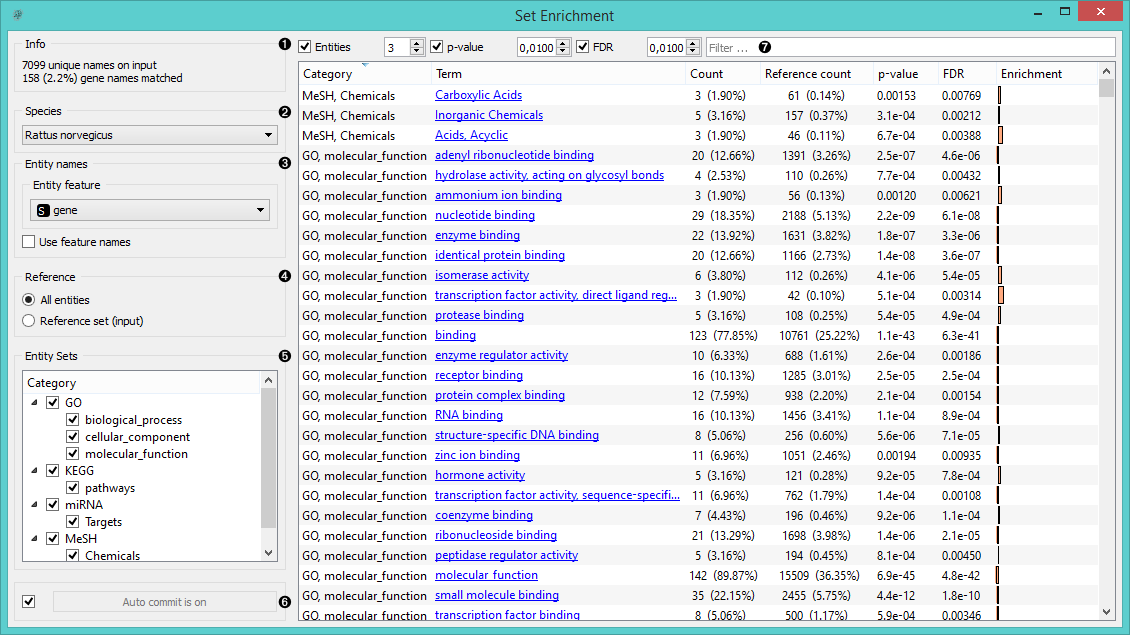
- Information on the input data set and the ratio of genes that were found in the databases.
- Select the species.
- Entity names define the features in the input data that you wish to use for term analysis. Tick Use feature names if your genes or chemicals are used as attribute names rather than as meta attributes.
- Select the reference data. You can either have entities (usually genes from the organism - All Entities) as a reference or a reference set from the input.
- Select which Entity sets you wish to have displayed in the list.
- When Auto commit is on, the widget will automatically apply the changes. Alternatively press Commit.
- Filter the list by:
- the minimum number of entities included in each term
- the minimum threshold for p-value
- the maximum threshold for false discovery rate
- a search word
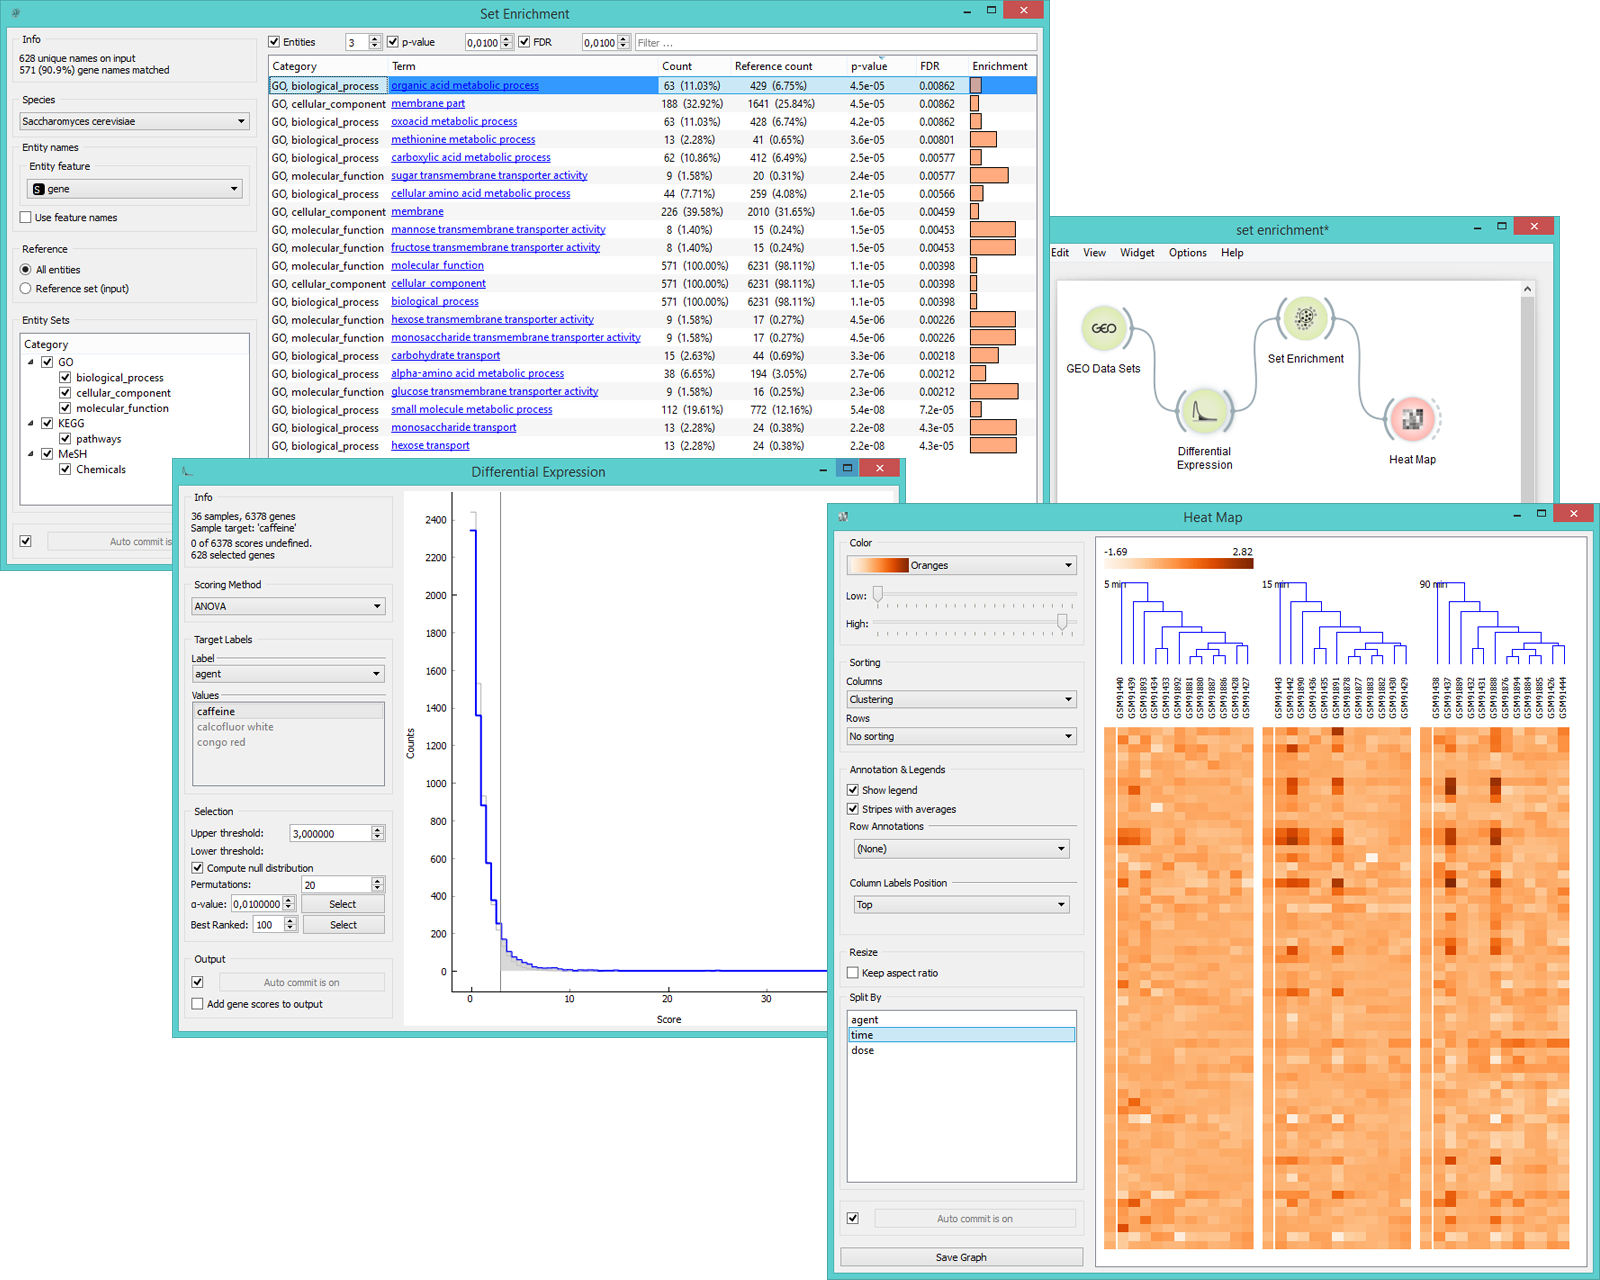
Example
In the example below we have decided to analyse gene expression levels from Caffeine effect: time course and dose response data set. We used the ANOVA scoring in the Differential Expression widget to select the most interesting genes. Then we fed those 628 genes to Set Enrichment for additional analysis of the most valuable terms. We sorted the data by FDR values and selected the top-scoring term. Heat Map widget provides a nice visualization of the data.