GenExpress

Gives access to GenExpress databases.
Signals
Inputs:
- (None)
Outputs:
Data
Selected experiments. Each annotated column contains results of a single experiment or, if the corresponding option is chosen, the average of multiple replicates.
Description
GenExpress is a widget for a direct access to GenExpress database. It is very similar to the PIPAx and GEO Data Sets widgets as it allows you to download the data from selected experiments.
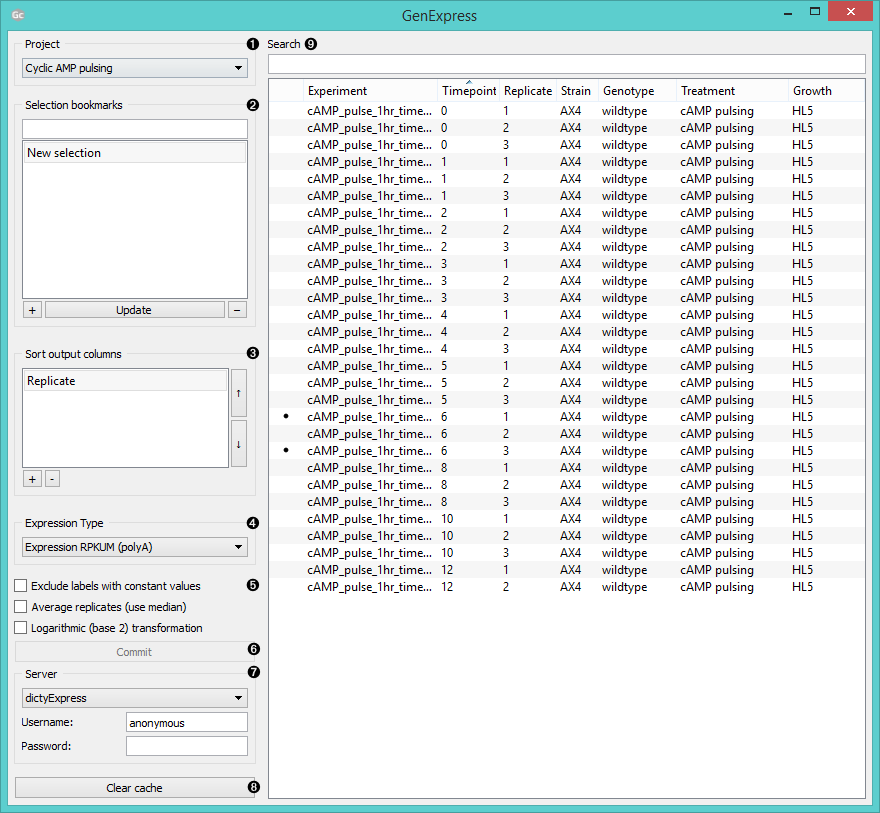
- Choose a projects to source your data from.
- Use Selection bookmarks to save a selection: select experiments, click the “+” button and name the set. To add experiments to your set, click on the set name, select additional experiments and click Update. To remove the set click “-”.
- In Sort output columns set the attributes by which the output columns are sorted. Add attributes with a “+” button and remove them with “-”. Switch the sorting order with arrows on the right.
- Set the expression type for your output data.
- Expression RPKM outputs data in reads per kilobase of transcript per million mapped reads
- Expression RPKUM outputs only RPKUM data.
- Read counts (raw) outputs raw read count data.
The polyA variants use only polyA (mRNA) mapped hits.
- Exclude labels with constant values removes labels that are the same for all selected experiments.
Average replicates (use median) averages identical experiments by using medians as values.
Logarithmic (base 2) transformation returns log2(value+1) for each value. - Click Commit to output selected data.
- Select the server you wish to access the data from. Log in to access private data.
- Clear cache removes the uploaded data sets from internal memory.
- Experiments can be filtered with the Search box. To select which attributes to display right-click on the header. To select multiple experiments click them while holding the Control/Command key.
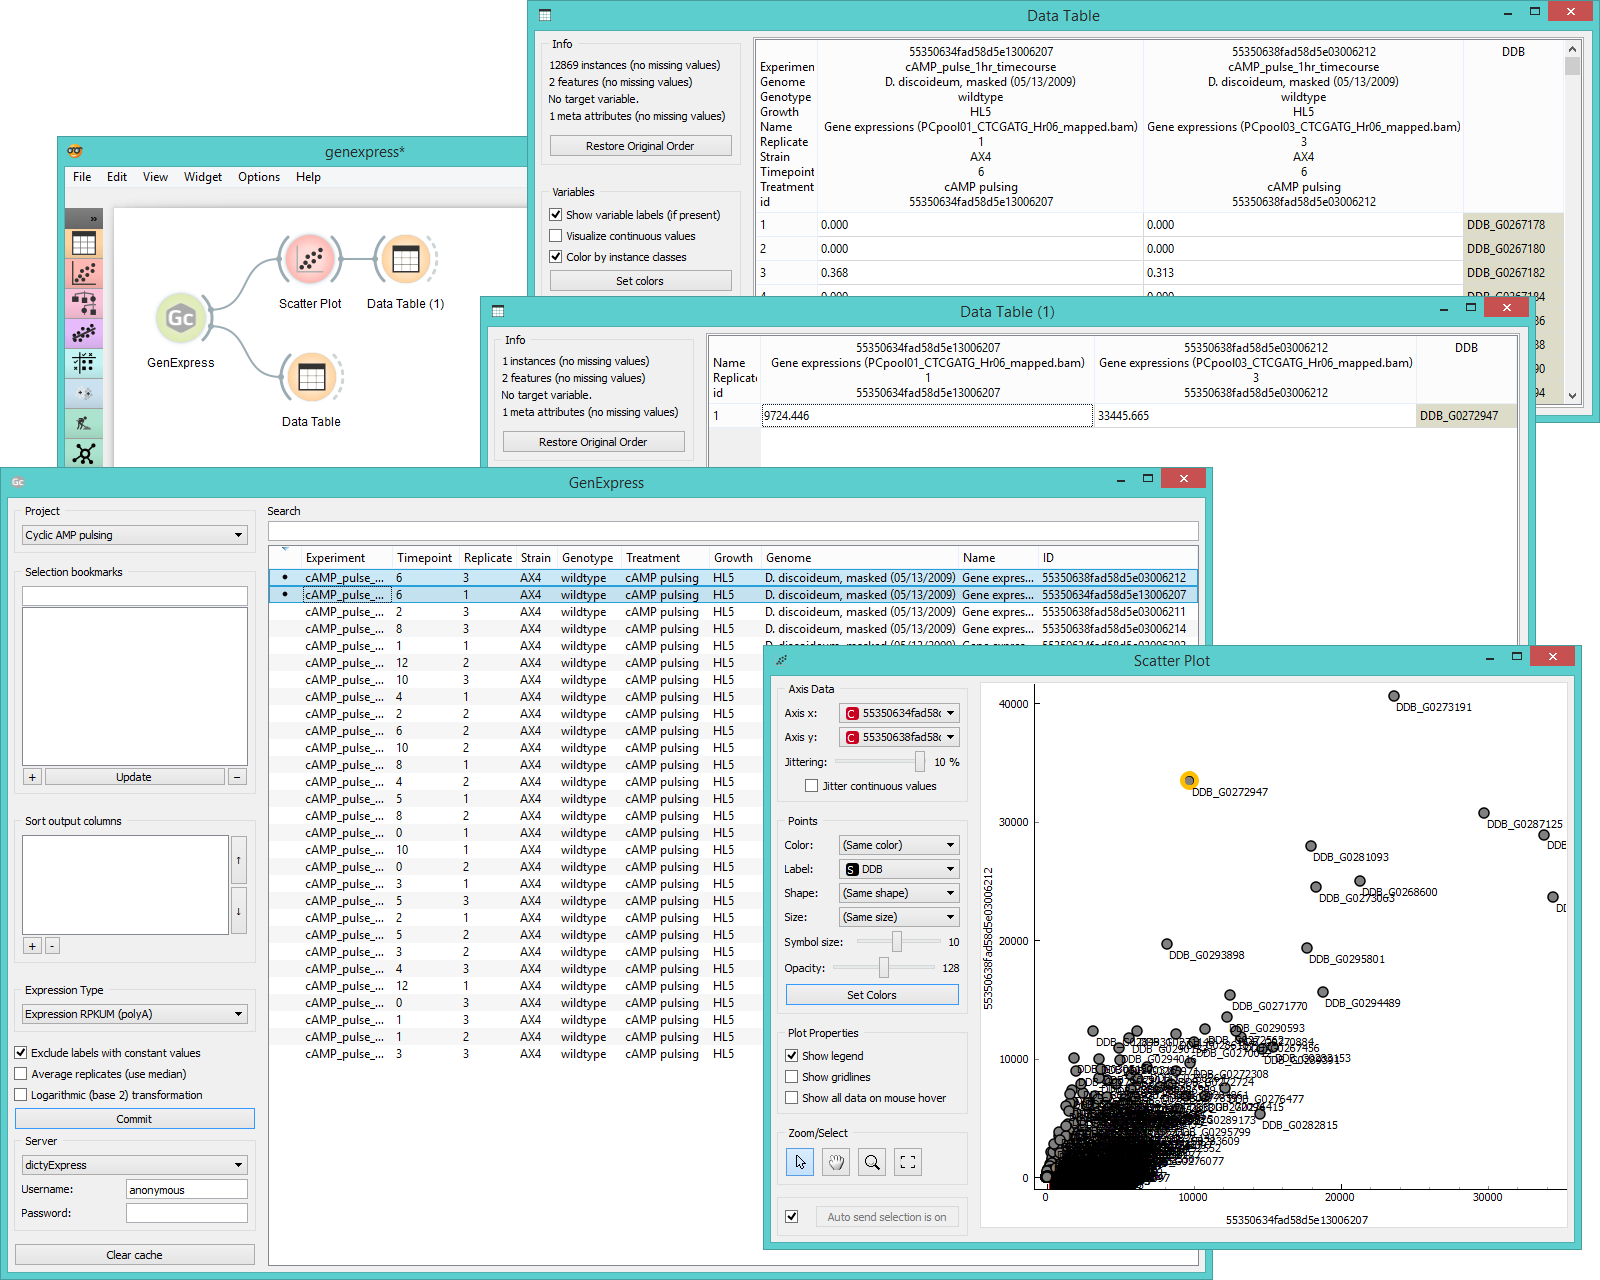
Example
In the schema below we connected GenExpress to Data Table to view the gene expression reads and then to Scatter Plot, where we chose to view expression levels from two experiments. In the plot we select an outlier and view it in another Data Table.