Creating a graph of collections
Collections in MetagenomeDB can be related to each other so that any given collection can have sub- or super-collections (see Relationships and Collection). You can create a graphic of all collections in your database and their relationships using a network visualization software such as Cytoscape.
Here is the code, with comments, that will generate such graphic:
#!/usr/bin/env python

import MetagenomeDB as mdb

### User-modifiable parameters
network_fn = "network.sif"
###

# first, we create the file that will contain our network
# as a list of edge, following the Cytoscape .SIF format
# (see http://cytoscape.wodaklab.org/wiki/Cytoscape_User_Manual/Network_Formats)
network_fh = open(network_fn, 'w')

# edges will be stored at first as keys of a dictionary
# to avoid duplicates
edges = {}

# for each collection in the database,
for collection in mdb.Collection.find():
        # for each sub-collection of this collection (if any),
        for sub_collection in collection.list_sub_collections():
                # we store a directed edge from this sub-collection to the collection
                edges[sub_collection, collection] = True

        # for each super-collection of this collection (if any),
        for super_collection in collection.list_super_collections():
                # we store a directed edge from this collection to the super-collection
                edges[collection, super_collection] = True

# finally, we write those directed edges in the output file
for (collection_a, collection_b) in sorted(edges.keys()):
        print >>network_fh, "%s part_of %s" % (collection_a["name"], collection_b["name"])
This code is also available as a download.
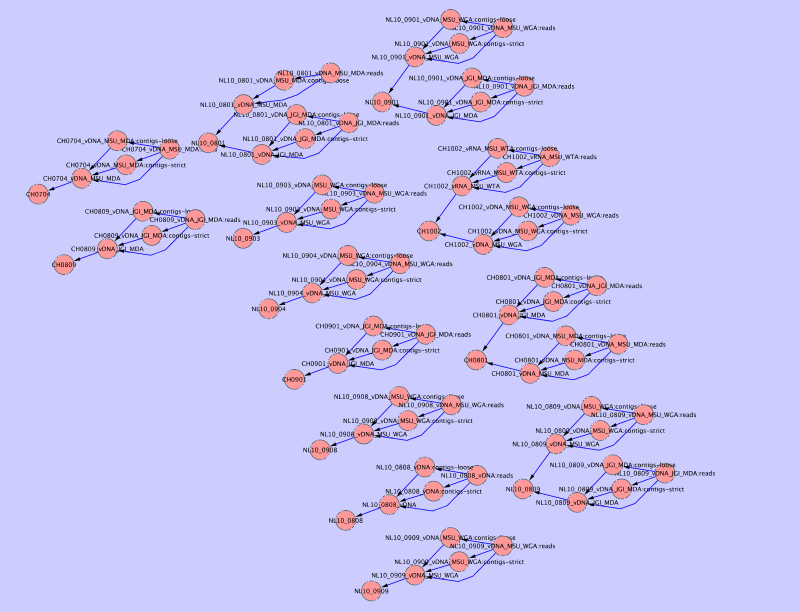
Once this script is executed the resulting network.sif file can be loaded into Cytoscape, producing an output similar to this one: