Package for plotting GPRegression results
pygp plotting tools
Tools to plot Gaussian process pygp.gp regression output.
- pygp.plot.gpr_plot.plot_sausage(X, mean, std, alpha=None, format_fill={'alpha': 0.1, 'facecolor': 'k'}, format_line={'color': 'g', 'lw': 3, 'ls': 'dashed', 'alpha': 1}, ax=None)
plot saussage plot of GP. I.e:
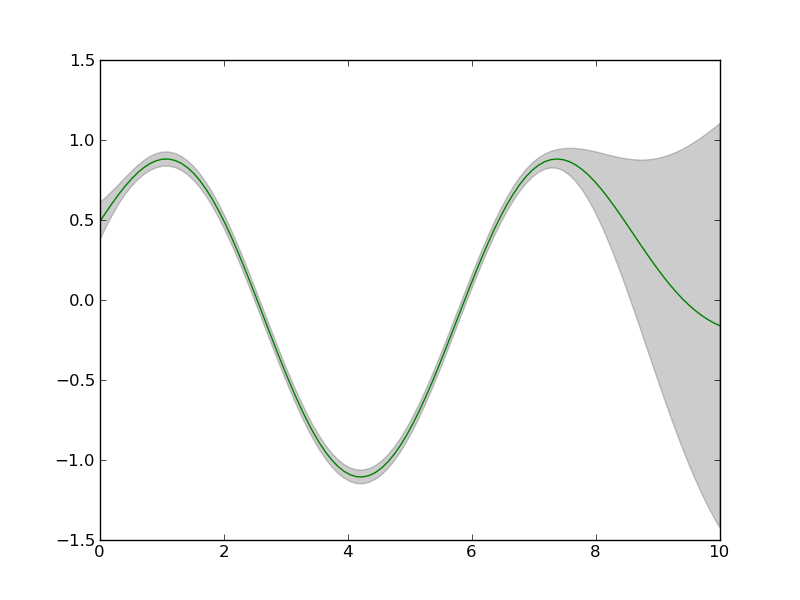
- returns: : [fill_plot, line_plot]
- The fill and the line of the sausage plot. (i.e. green line and gray fill of the example above)
Parameters:
- X : [double]
- Interval X for which the saussage shall be plottet.
- mean : [double]
- The mean of to be plottet.
- std : [double]
- Pointwise standard deviation.
- format_fill : {format}
- The format of the fill. See http://matplotlib.sourceforge.net/ for details.
- format_line : {format}
- The format of the mean line. See http://matplotlib.sourceforge.net/ for details.
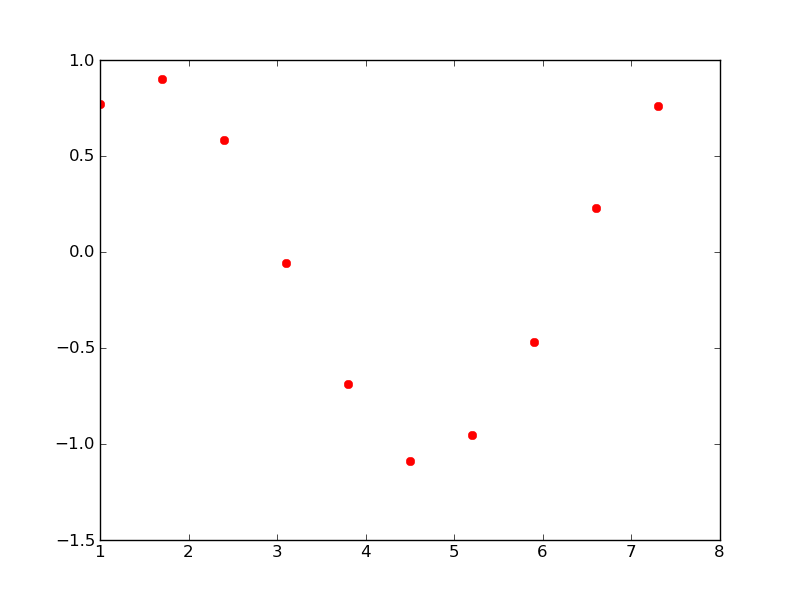
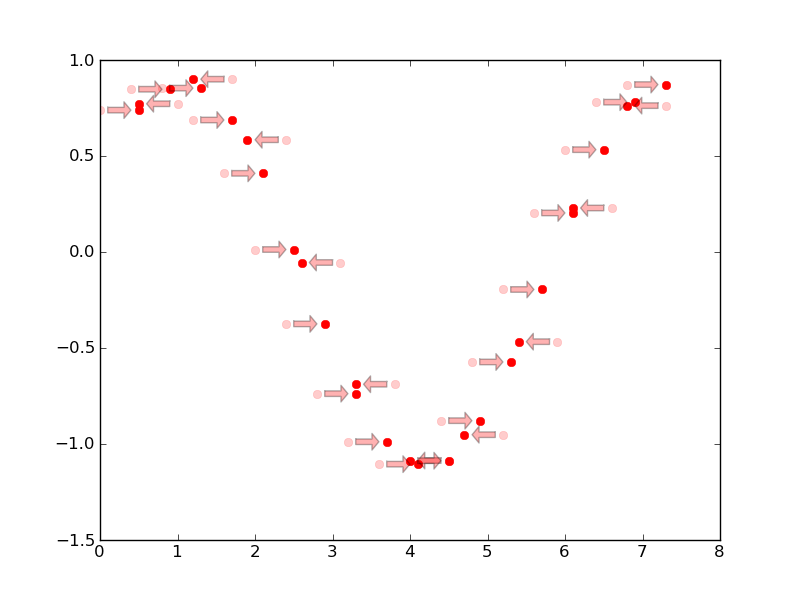
- pygp.plot.gpr_plot.plot_training_data(x, y, shift=None, replicate_indices=None, format_data={'marker': '.', 'alpha': 0.5, 'markersize': 9, 'linestyle': '--', 'lw': 1}, draw_arrows=0, plot_old=False)
Plot training data input x and output y into the active figure (See http://matplotlib.sourceforge.net/ for details of figure).
Instance plot without replicate groups:
Instance plot with two replicate groups and a shift in x-koords:
Parameters:
- x : [double]
- Input x (e.g. time).
- y : [double]
- Output y (e.g. expression).
- shift : [double]
- The shift of each replicate group.
- replicate_indices : [int]
- Indices of replicates for each x, rexpectively
- format_data : {format}
- Format of the data points. See http://matplotlib.sourceforge.net/ for details.
- draw_arrows : int
- draw given number of arrows (if greator than len(replicate) draw all arrows. Arrows will show the time shift for time points, respectively.