
plotpy.plot
- The plot module provides the following features:
plotpy.plot.PlotManager: the plot manager is an object to link plots, panels and tools together for designing highly versatile graphical user interfacesplotpy.plot.CurveWidget: a ready-to-use widget for curve displaying with an integrated and preconfigured plot manager providing the item list panel and curve-related toolsplotpy.plot.CurveDialog: a ready-to-use dialog box for curve displaying with an integrated and preconfigured plot manager providing the item list panel and curve-related toolsplotpy.plot.ImageWidget: a ready-to-use widget for curve and image displaying with an integrated and preconfigured plot manager providing the item list panel, the contrast adjustment panel, the cross section panels (along X and Y axes) and image-related tools (e.g. colormap selection tool)plotpy.plot.ImageDialog: a ready-to-use dialog box for curve and image displaying with an integrated and preconfigured plot manager providing the item list panel, the contrast adjustment panel, the cross section panels (along X and Y axes) and image-related tools (e.g. colormap selection tool)
See also
- Module
plotpy.curve - Module providing curve-related plot items and plotting widgets
- Module
plotpy.image - Module providing image-related plot items and plotting widgets
- Module
plotpy.tools - Module providing the plot tools
- Module
plotpy.panels - Module providing the plot panels IDs
- Module
plotpy.baseplot - Module providing the plotpy plotting widget base class
Class diagrams
Curve-related widgets with integrated plot manager:
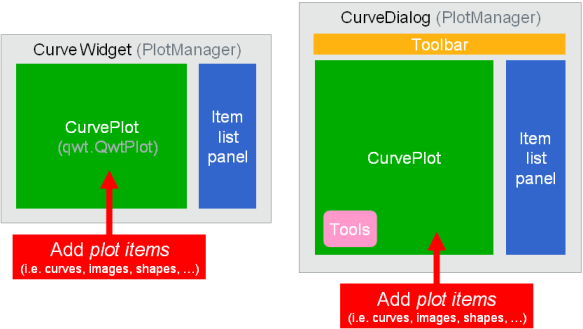
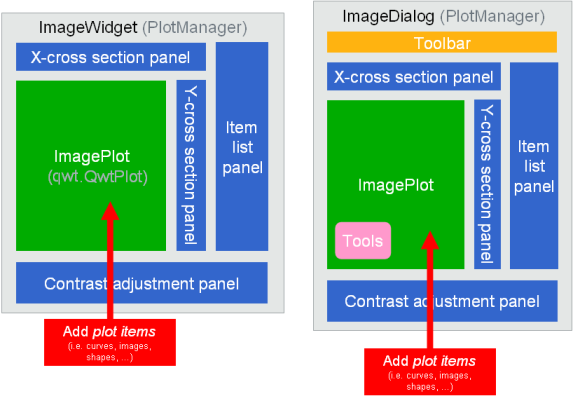
Image-related widgets with integrated plot manager:
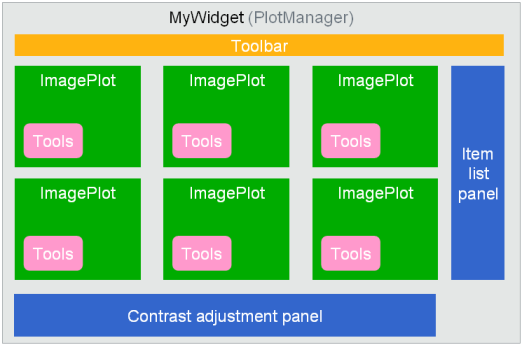
Building your own plot manager:
Examples
Simple example without the plot manager:
from guidata.qt.QtGui import QWidget, QVBoxLayout, QHBoxLayout, QPushButton

#---Import plot widget base class
from plotpy.plot import CurveWidget
from plotpy.builder import make
from guidata.configtools import get_icon
#---

class FilterTestWidget(QWidget):
    """
    Filter testing widget
    parent: parent widget (QWidget)
    x, y: NumPy arrays
    func: function object (the signal filter to be tested)
    """
    def __init__(self, parent, x, y, func):
        QWidget.__init__(self, parent)
        self.setMinimumSize(320, 200)
        self.x = x
        self.y = y
        self.func = func
        #---plotpy curve item attribute:
        self.curve_item = None
        #---

    def setup_widget(self, title):
        #---Create the plot widget:
        curvewidget = CurveWidget(self)
        curvewidget.register_all_curve_tools()
        self.curve_item = make.curve([], [], color='b')
        curvewidget.plot.add_item(self.curve_item)
        curvewidget.plot.set_antialiasing(True)
        #---

        button = QPushButton("Test filter: %s" % title)
        button.clicked.connect(self.process_data)
        vlayout = QVBoxLayout()
        vlayout.addWidget(curvewidget)
        vlayout.addWidget(button)
        self.setLayout(vlayout)

        self.update_curve()

    def process_data(self):
        self.y = self.func(self.y)
        self.update_curve()

    def update_curve(self):
        #---Update curve
        self.curve_item.set_data(self.x, self.y)
        self.curve_item.plot().replot()
        #---


class TestWindow(QWidget):
    def __init__(self):
        QWidget.__init__(self)
        self.setWindowTitle("Signal filtering (plotpy)")
        self.setWindowIcon(get_icon('plotpy.svg'))
        hlayout = QHBoxLayout()
        self.setLayout(hlayout)

    def add_plot(self, x, y, func, title):
        widget = FilterTestWidget(self, x, y, func)
        widget.setup_widget(title)
        self.layout().addWidget(widget)


def test():
    """Testing this simple Qt/plotpy example"""
    from guidata.qt.QtGui import QApplication
    import numpy as np
    import scipy.signal as sps, scipy.ndimage as spi

    app = QApplication([])
    win = TestWindow()

    x = np.linspace(-10, 10, 500)
    y = np.random.rand(len(x))+5*np.sin(2*x**2)/x
    win.add_plot(x, y, lambda x: spi.gaussian_filter1d(x, 1.), "Gaussian")
    win.add_plot(x, y, sps.wiener, "Wiener")

    win.show()
    app.exec_()


if __name__ == '__main__':
    test()
Simple example with the plot manager: even if this simple example does not justify the use of the plot manager (this is an unnecessary complication here), it shows how to use it. In more complex applications, using the plot manager allows to design highly versatile graphical user interfaces.
from guidata.qt.QtGui import (QWidget, QVBoxLayout, QHBoxLayout, QPushButton,
                              QMainWindow)

#---Import plot widget base class
from plotpy.curve import CurvePlot
from plotpy.plot import PlotManager
from plotpy.builder import make
from guidata.configtools import get_icon
#---

class FilterTestWidget(QWidget):
    """
    Filter testing widget
    parent: parent widget (QWidget)
    x, y: NumPy arrays
    func: function object (the signal filter to be tested)
    """
    def __init__(self, parent, x, y, func):
        QWidget.__init__(self, parent)
        self.setMinimumSize(320, 200)
        self.x = x
        self.y = y
        self.func = func
        #---plotpy related attributes:
        self.plot = None
        self.curve_item = None
        #---

    def setup_widget(self, title):
        #---Create the plot widget:
        self.plot = CurvePlot(self)
        self.curve_item = make.curve([], [], color='b')
        self.plot.add_item(self.curve_item)
        self.plot.set_antialiasing(True)
        #---

        button = QPushButton("Test filter: %s" % title)
        button.clicked.connect(self.process_data)
        vlayout = QVBoxLayout()
        vlayout.addWidget(self.plot)
        vlayout.addWidget(button)
        self.setLayout(vlayout)

        self.update_curve()

    def process_data(self):
        self.y = self.func(self.y)
        self.update_curve()

    def update_curve(self):
        #---Update curve
        self.curve_item.set_data(self.x, self.y)
        self.plot.replot()
        #---


class TestWindow(QMainWindow):
    def __init__(self):
        QMainWindow.__init__(self)
        self.setWindowTitle("Signal filtering 2 (plotpy)")
        self.setWindowIcon(get_icon('plotpy.svg'))

        hlayout = QHBoxLayout()
        central_widget = QWidget(self)
        central_widget.setLayout(hlayout)
        self.setCentralWidget(central_widget)
        #---plotpy plot manager
        self.manager = PlotManager(self)
        #---

    def add_plot(self, x, y, func, title):
        widget = FilterTestWidget(self, x, y, func)
        widget.setup_widget(title)
        self.centralWidget().layout().addWidget(widget)
        #---Register plot to manager
        self.manager.add_plot(widget.plot)
        #---

    def setup_window(self):
        #---Add toolbar and register manager tools
        toolbar = self.addToolBar("tools")
        self.manager.add_toolbar(toolbar, id(toolbar))
        self.manager.register_all_curve_tools()
        #---


def test():
    """Testing this simple Qt/plotpy example"""
    from guidata.qt.QtGui import QApplication
    import numpy as np
    import scipy.signal as sps, scipy.ndimage as spi

    app = QApplication([])
    win = TestWindow()

    x = np.linspace(-10, 10, 500)
    y = np.random.rand(len(x))+5*np.sin(2*x**2)/x
    win.add_plot(x, y, lambda x: spi.gaussian_filter1d(x, 1.), "Gaussian")
    win.add_plot(x, y, sps.wiener, "Wiener")
    #---Setup window
    win.setup_window()
    #---

    win.show()
    app.exec_()


if __name__ == '__main__':
    test()
Reference
-
class
plotpy.plot.PlotManager(main)[source]¶ Construct a PlotManager object, a ‘controller’ that organizes relations between plots (i.e.
plotpy.curve.CurvePlotorplotpy.image.ImagePlotobjects), panels, tools (seeplotpy.tools) and toolbars-
add_plot(plot, plot_id=<class 'plotpy.plot.DefaultPlotID'>)[source]¶ - Register a plot to the plot manager:
- plot:
plotpy.curve.CurvePlotorplotpy.image.ImagePlotobject - plot_id (default id is the plot object’s id:
id(plot)): unique ID identifying the plot (any Python object), this ID will be asked by the manager to access this plot later.
- plot:
- Plot manager’s registration sequence is the following:
- add plots
- add panels
- add tools
-
set_default_plot(plot)[source]¶ Set default plot
The default plot is the plot on which tools and panels will act.
-
get_default_plot()[source]¶ Return default plot
The default plot is the plot on which tools and panels will act.
-
add_panel(panel)[source]¶ Register a panel to the plot manager
- Plot manager’s registration sequence is the following:
- add plots
- add panels
- add tools
-
configure_panels()[source]¶ Call all the registred panels ‘configure_panel’ methods to finalize the object construction (this allows to use tools registered to the same plot manager as the panel itself with breaking the registration sequence: “add plots, then panels, then tools”)
-
add_toolbar(toolbar, toolbar_id='default')[source]¶ - Add toolbar to the plot manager
- toolbar: a QToolBar object toolbar_id: toolbar’s id (default id is string “default”)
-
add_tool(ToolKlass, *args, **kwargs)[source]¶ - Register a tool to the manager
- ToolKlass: tool’s class (plotpy builtin tools are defined in
module
plotpy.tools) - args: arguments sent to the tool’s class
- kwargs: keyword arguments sent to the tool’s class
- ToolKlass: tool’s class (plotpy builtin tools are defined in
module
- Plot manager’s registration sequence is the following:
- add plots
- add panels
- add tools
-
add_separator_tool(toolbar_id=None)[source]¶ Register a separator tool to the plot manager: the separator tool is just a tool which insert a separator in the plot context menu
-
set_active_tool(tool=None)[source]¶ Set active tool (if tool argument is None, the active tool will be the default tool)
-
get_plot(plot_id=<class 'plotpy.plot.DefaultPlotID'>)[source]¶ Return plot associated to plot_id (if method is called without specifying the plot_id parameter, return the default plot)
-
get_active_plot()[source]¶ Return the active plot
The active plot is the plot whose canvas has the focus otherwise it’s the “default” plot
-
get_main()[source]¶ Return the main (parent) widget
Note that for py:class:plotpy.plot.CurveWidget or
plotpy.plot.ImageWidgetobjects, this method will return the widget itself because the plot manager is integrated to it.
-
get_itemlist_panel()[source]¶ Convenience function to get the item list panel
Return None if the item list panel has not been added to this manager
-
get_contrast_panel()[source]¶ Convenience function to get the contrast adjustment panel
Return None if the contrast adjustment panel has not been added to this manager
-
set_contrast_range(zmin, zmax)[source]¶ Convenience function to set the contrast adjustment panel range
This is strictly equivalent to the following:
# Here, *widget* is for example a CurveWidget instance
# (the same apply for CurvePlot, ImageWidget, ImagePlot or any
#  class deriving from PlotManager)
widget.get_contrast_panel().set_range(zmin, zmax)
-
get_xcs_panel()[source]¶ Convenience function to get the X-axis cross section panel
Return None if the X-axis cross section panel has not been added to this manager
-
get_ycs_panel()[source]¶ Convenience function to get the Y-axis cross section panel
Return None if the Y-axis cross section panel has not been added to this manager
-
update_cross_sections()[source]¶ Convenience function to update the cross section panels at once
This is strictly equivalent to the following:
# Here, *widget* is for example a CurveWidget instance
# (the same apply for CurvePlot, ImageWidget, ImagePlot or any
#  class deriving from PlotManager)
widget.get_xcs_panel().update_plot()
widget.get_ycs_panel().update_plot()
-
get_toolbar(toolbar_id='default')[source]¶ - Return toolbar from its ID
- toolbar_id: toolbar’s id (default id is string “default”)
Return widget context menu – built using active tools
-
create_action(title, triggered=None, toggled=None, shortcut=None, icon=None, tip=None, checkable=None, context=1, enabled=None)[source]¶ Create a new QAction
-
-
class
plotpy.plot.CurveWidget(parent=None, title=None, xlabel=None, ylabel=None, xunit=None, yunit=None, section='plot', show_itemlist=False, gridparam=None, panels=None)[source]¶ Construct a CurveWidget object: plotting widget with integrated plot manager
- parent: parent widget
- title: plot title
- xlabel: (bottom axis title, top axis title) or bottom axis title only
- ylabel: (left axis title, right axis title) or left axis title only
- xunit: (bottom axis unit, top axis unit) or bottom axis unit only
- yunit: (left axis unit, right axis unit) or left axis unit only
- panels (optional): additionnal panels (list, tuple)
-
class
plotpy.plot.CurveDialog(wintitle='plotpy plot', icon='plotpy.svg', edit=False, toolbar=False, options=None, parent=None, panels=None)[source]¶ Construct a CurveDialog object: plotting dialog box with integrated plot manager
- wintitle: window title
- icon: window icon
- edit: editable state
- toolbar: show/hide toolbar
- options: options sent to the
plotpy.curve.CurvePlotobject (dictionary) - parent: parent widget
- panels (optional): additionnal panels (list, tuple)
Install standard buttons (OK, Cancel) in dialog button box layout (
plotpy.plot.CurveDialog.button_layout)This method may be overriden to customize the button box
-
class
plotpy.plot.ImageWidget(parent=None, title='', xlabel=('', ''), ylabel=('', ''), zlabel=None, xunit=('', ''), yunit=('', ''), zunit=None, yreverse=True, colormap='jet', aspect_ratio=1.0, lock_aspect_ratio=True, show_contrast=False, show_itemlist=False, show_xsection=False, show_ysection=False, xsection_pos='top', ysection_pos='right', gridparam=None, panels=None)[source]¶ Construct a ImageWidget object: plotting widget with integrated plot manager
- parent: parent widget
- title: plot title (string)
- xlabel, ylabel, zlabel: resp. bottom, left and right axis titles (strings)
- xunit, yunit, zunit: resp. bottom, left and right axis units (strings)
- yreverse: reversing Y-axis (bool)
- aspect_ratio: height to width ratio (float)
- lock_aspect_ratio: locking aspect ratio (bool)
- show_contrast: showing contrast adjustment tool (bool)
- show_xsection: showing x-axis cross section plot (bool)
- show_ysection: showing y-axis cross section plot (bool)
- xsection_pos: x-axis cross section plot position (string: “top”, “bottom”)
- ysection_pos: y-axis cross section plot position (string: “left”, “right”)
- panels (optional): additionnal panels (list, tuple)
-
class
plotpy.plot.ImageDialog(wintitle='plotpy plot', icon='plotpy.svg', edit=False, toolbar=False, options=None, parent=None, panels=None)[source]¶ Construct a ImageDialog object: plotting dialog box with integrated plot manager
- wintitle: window title
- icon: window icon
- edit: editable state
- toolbar: show/hide toolbar
- options: options sent to the
plotpy.image.ImagePlotobject (dictionary) - parent: parent widget
- panels (optional): additionnal panels (list, tuple)