Frame column_summary_statistics
-
column_summary_statistics(self, data_column, weights_column=None, use_population_variance=None)¶ Calculate multiple statistics for a column.
Parameters: data_column : unicode
The column to be statistically summarized. Must contain numerical data; all NaNs and infinite values are excluded from the calculation.
weights_column : unicode (default=None)
Name of column holding weights of column values.
use_population_variance : bool (default=None)
If true, the variance is calculated as the population variance. If false, the variance calculated as the sample variance. Because this option affects the variance, it affects the standard deviation and the confidence intervals as well. Default is false.
Returns: : dict
Dictionary containing summary statistics. The data returned is composed of multiple components:
mean : [ double | None ]Arithmetic mean of the data.geometric_mean : [ double | None ]Geometric mean of the data. None when there is a data element <= 0, 1.0 when there are no data elements.variance : [ double | None ]None when there are <= 1 many data elements. Sample variance is the weighted sum of the squared distance of each data element from the weighted mean, divided by the total weight minus 1. None when the sum of the weights is <= 1. Population variance is the weighted sum of the squared distance of each data element from the weighted mean, divided by the total weight.standard_deviation : [ double | None ]The square root of the variance. None when sample variance is being used and the sum of weights is <= 1.total_weight : longThe count of all data elements that are finite numbers. In other words, after excluding NaNs and infinite values.minimum : [ double | None ]Minimum value in the data. None when there are no data elements.maximum : [ double | None ]Maximum value in the data. None when there are no data elements.mean_confidence_lower : [ double | None ]Lower limit of the 95% confidence interval about the mean. Assumes a Gaussian distribution. None when there are no elements of positive weight.mean_confidence_upper : [ double | None ]Upper limit of the 95% confidence interval about the mean. Assumes a Gaussian distribution. None when there are no elements of positive weight.bad_row_count : [ double | None ]The number of rows containing a NaN or infinite value in either the data or weights column.good_row_count : [ double | None ]The number of rows not containing a NaN or infinite value in either the data or weights column.positive_weight_count : [ double | None ]The number of valid data elements with weight > 0. This is the number of entries used in the statistical calculation.non_positive_weight_count : [ double | None ]The number valid data elements with finite weight <= 0.- Sample Variance
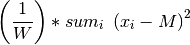
Sample Variance is computed by the following formula:
where
 is sum of weights over valid elements of positive
weight, and
is sum of weights over valid elements of positive
weight, and  is the weighted mean.
- Population Variance
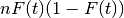
Population Variance is computed by the following formula:
where
is sum of weights over valid elements of positive
weight, and is the weighted mean.- Standard Deviation
- The square root of the variance.
- Logging Invalid Data
A row is bad when it contains a NaN or infinite value in either its data or weights column. In this case, it contributes to bad_row_count; otherwise it contributes to good row count.
A good row can be skipped because the value in its weight column is less than or equal to 0. In this case, it contributes to non_positive_weight_count, otherwise (when the weight is greater than 0) it contributes to valid_data_weight_pair_count.
Equations
bad_row_count + good_row_count = # rows in the frame
positive_weight_count + non_positive_weight_count = good_row_count
In particular, when no weights column is provided and all weights are 1.0:
non_positive_weight_count = 0 and
positive_weight_count = good_row_count
Examples
Given a frame with column ‘a’ accessed by a Frame object ‘my_frame’:
>>> import trustedanalytics as ta
>>> ta.connect()
Connected ...
>>> data = [[2],[3],[3],[5],[7],[10],[30]]
>>> schema = [('a', ta.int32)]
>>> my_frame = ta.Frame(ta.UploadRows(data, schema))
[===Job Progress===]
Inspect my_frame
>>> my_frame.inspect()
[#]  a
=======
[0]   2
[1]   3
[2]   3
[3]   5
[4]   7
[5]  10
[6]  30
Compute and return summary statistics for values in column a:
>>> summary_statistics = my_frame.column_summary_statistics('a')
[===Job Progress===]
>>> print sorted(summary_statistics.items())
[(u'bad_row_count', 0), (u'geometric_mean', 5.6725751451901045), (u'good_row_count', 7), (u'maximum', 30.0), (u'mean', 8.571428571428571), (u'mean_confidence_lower', 1.277083729932067), (u'mean_confidence_upper', 15.865773412925076), (u'minimum', 2.0), (u'non_positive_weight_count', 0), (u'positive_weight_count', 7), (u'standard_deviation', 9.846440014156434), (u'total_weight', 7.0), (u'variance', 96.95238095238095)]
Given a frame with column ‘a’ and column ‘w’ as weights accessed by a Frame object ‘my_frame’:
>>> data = [[2,1.7],[3,0.5],[3,1.2],[5,0.8],[7,1.1],[10,0.8],[30,0.1]]
>>> schema = [('a', ta.int32), ('w', ta.float32)]
>>> my_frame = ta.Frame(ta.UploadRows(data, schema))
[===Job Progress===]
Inspect my_frame
>>> my_frame.inspect()
[#]  a   w
=======================
[0]   2   1.70000004768
[1]   3             0.5
[2]   3   1.20000004768
[3]   5  0.800000011921
[4]   7   1.10000002384
[5]  10  0.800000011921
[6]  30   0.10000000149
Compute and return summary statistics values in column ‘a’ with weights ‘w’: