PyCallGraph Explorations
Background
What is the problem to solve?
While pyreverse can be used to auto-generate class and dependency diagrams, it uses a static checker (pylint) and so is not as helpful when you want to visualize the execution of your code.
What will solve this?
I think that pycallgraph will allow visualizing of the execution of code.
What would a correct solution look like?
If this works, an argument could be added to the ArgumentClinic to create visualizations of executing code. Additionally, for cases where the code is runnable on its own (without the ape command-line interface), call-graphs could be dynamically generated and embedded in the weaved documentation by compiling the source code (I have my doubts about this condition, running inside of Pweave seems like a bad idea). An alternative (and possibly a superior solution) would be to create a simplified command-line and just include the image in the weave.
Testing the PyCallGraph
Since the ape list sub-command does not have any external code to run I will test pycallgraph using it.
# third-party
from pycallgraph import PyCallGraph
from pycallgraph import GlobbingFilter
from pycallgraph import Config
from pycallgraph.output import GraphvizOutput

# this package
from ape.interface.ubootkommandant import UbootKommandant
subcommand = UbootKommandant()
graphviz = GraphvizOutput()
graphviz.output_file = 'figures/callgraphtest.png'
with PyCallGraph(output=graphviz):
   subcommand.list_plugins(None)
Ape
CrashTestDummy
Dummy
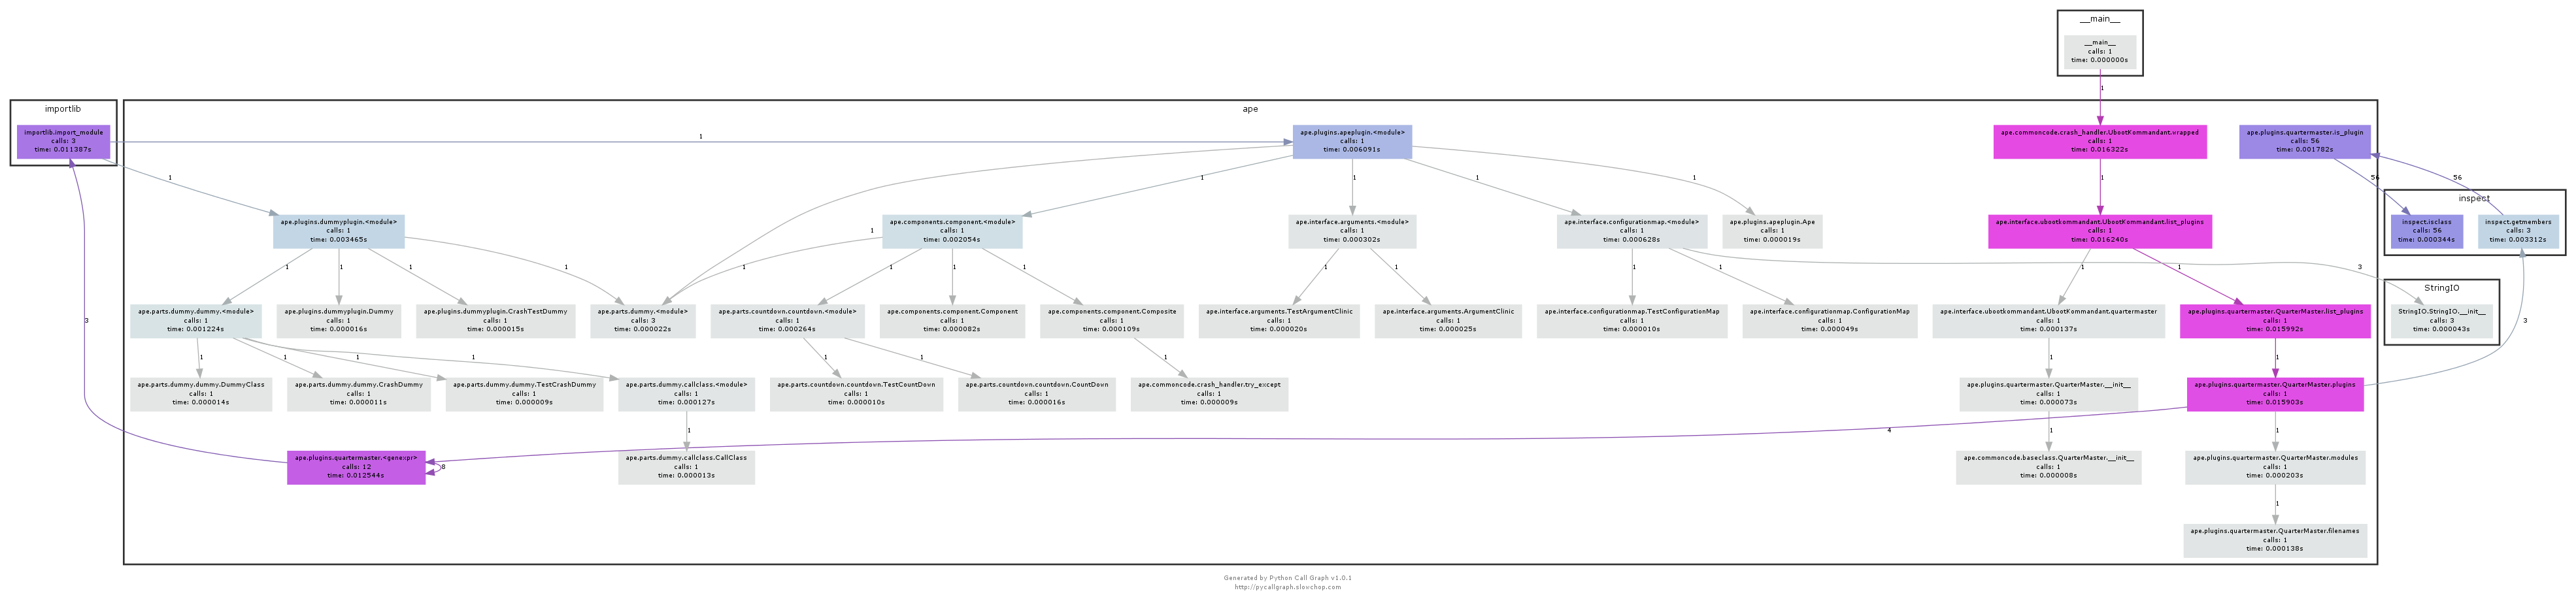
That was surprisingly easy.
Filtering
Although it is easy enough to follow the graph, I think that trimming some of the leaves would make it easier.
config = Config()
config.trace_filter = GlobbingFilter(exclude='*interface.arguments*'.split())
graphviz = GraphvizOutput()
graphviz.output_file = 'figures/filtered_graph.png'
with PyCallGraph(output=graphviz, config=config):
   subcommand.list_plugins(None)
Ape
CrashTestDummy
Dummy
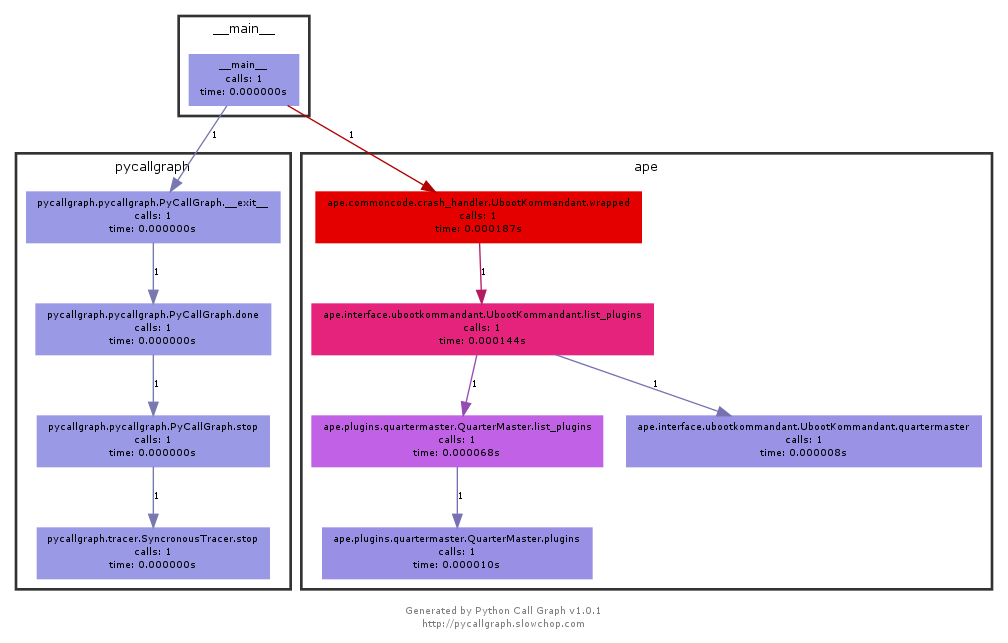
That made it much clearer but wasn’t what I was expecting.
- pycallgraph included itself
- More than just the arguments module was excluded
Depth
Instead of filtering you can set the maximum depth that the tree will follow.
DEPTH = 100
config = Config(max_depth=DEPTH)
graphviz = GraphvizOutput()
graphviz.output_file = 'figures/trimmed_graph.png'
with PyCallGraph(output=graphviz, config=config):
   subcommand.list_plugins(None)
Ape
CrashTestDummy
Dummy
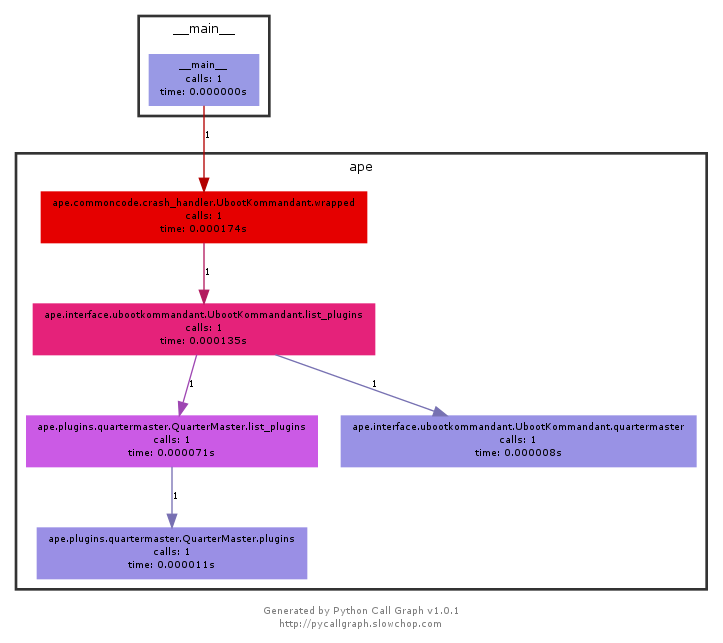
This seems to be the most comprehensible version (although I don’t know how the actual depth-value works – except for max_depth=1 all the values seem to create the same graph).