RiboPlot
Plot and output Ribo-Seq read counts of a single transcript from an alignment file (sorted BAM).
Parameters
1. Ribo-Seq alignment file (Sorted BAM file)
A Bowtie 1 output (BAM) from an alignment of Ribo-Seq data to the transcriptome. This BAM file should be sorted. This can be done using one of the following methods.
- RiboGalaxy -> Sort Data -> Sort BAM dataset.
samtools sort input.bam inputsorted
2. Transcriptome (FASTA)
A FASTA format file with sequences of the transcripts.
3. Name of the transcript to plot (Text)
The name of the transcript to plot should match the name in the transcriptome (FASTA) and the Ribo-Seq/RNA-Seq alignment (BAM).
4. RNA coverage [optional] (Sorted BAM file)
If you have RNA-Seq data (sorted BAM), you can select the option to plot RNA coverage.
5. Read lengths to consider [optional] (Integer - 0 or greater)
If this option is provided, only Ribo-Seq data of the given read length is considered. Multiple read lengths can be provided and should be separated by commas. If multiple read lengths are input, corresponding read offsets should also be specified. If you do not wish to apply an offset, please input 0 for the corresponding offset.
6. Read offset(s) corresponding to read lengths [optional] (Integer - 0 or greater)
If this option is provided, this offset is added to the read alignment positions. Multiple offsets should be separated by commas.
Output
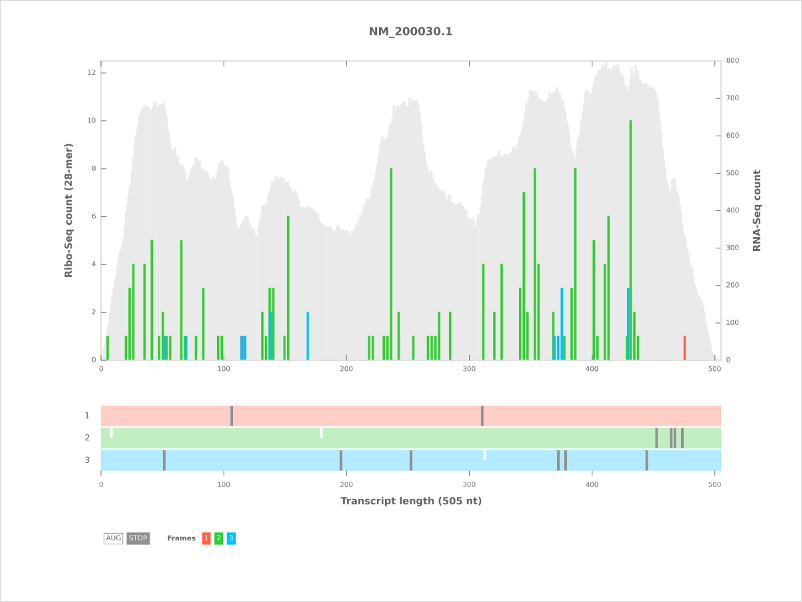
1. Plots (PNG and SVG)
Ribo-Seq read counts as a bar plot in 3 frames (color codes: 1: red, 2: green, 3: blue)
RNA coverage as a gray background (if the RNA coverage option was selected).
The open reading frame architecture appears below the plot with start (ATG) and stop codons (‘TAA’, ‘TAG’, ‘TGA’) in all 3 frames.
The color codes are start (white) and stop (dark gray).
2. RiboSeq read counts (CSV)
In 3 frames for each position in the transcript.
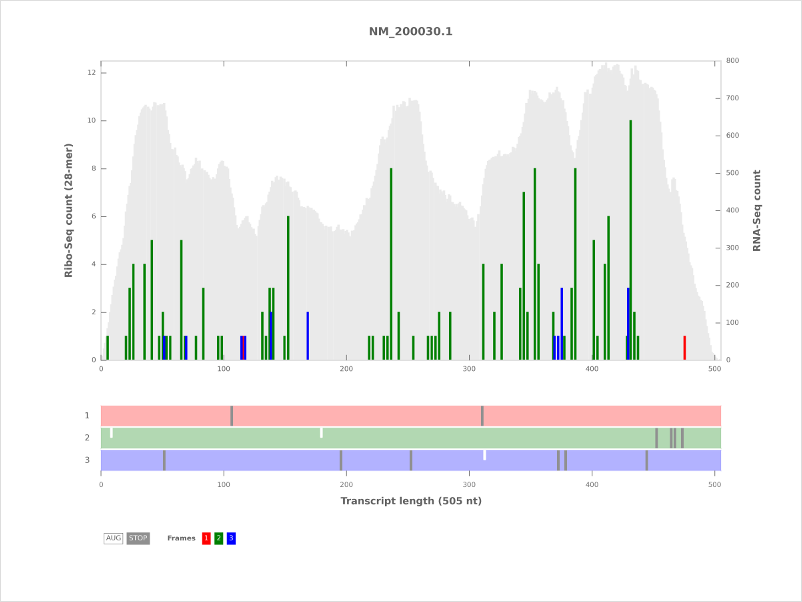
Additional color schemes
Three additional color schemes are available in addition to the default used in the plot above.
ColorBrewer
Uses a color blind and print friendly color scheme from ColorBrewer.
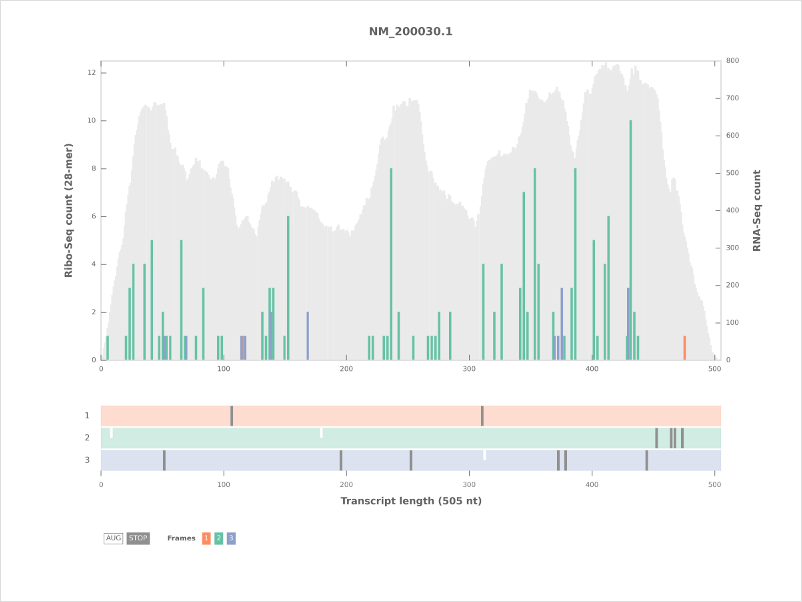
To use this color scheme, use the -c colorbrewer option with riboplot.
GreyORFs
Uses the default color scheme but the ORF architecture is displayed in a grey background.
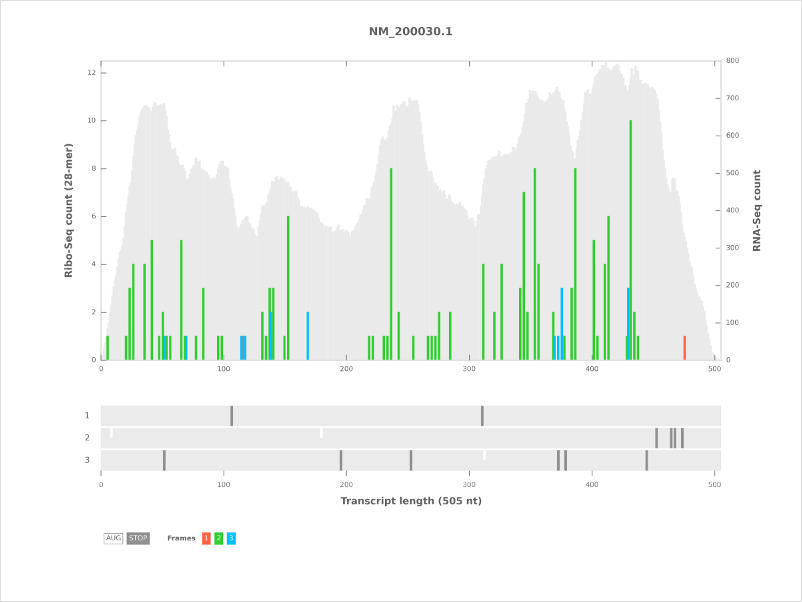
To use this color scheme, use the -c greyorfs option.
Command line
riboplot can also be run on the command line. The usage is
riboplot.py [-h] -b RIBO_FILE -f TRANSCRIPTOME_FASTA -t TEXT
[-n RNA_FILE] [-l READ_LENGTHS] [-s READ_OFFSETS]
[-c {default,colorbrewer,rgb,greyorfs}] [-m HTML_FILE]
[-o OUTPUT_PATH] [-d]
Plot and output read counts for a single transcript
- optional arguments:
-h, --help show this help message and exit -n RNA_FILE, --rna_file RNA_FILE RNA-Seq alignment file (BAM) -l READ_LENGTHS, --read_lengths READ_LENGTHS Read lengths to consider (default: 0). Multiple read lengths should be separated by commas. If multiple read lengths are specified, corresponding read offsets should also be specified. If you do not wish to apply an offset, please input 0 for the corresponding read length -s READ_OFFSETS, --read_offsets READ_OFFSETS Read offsets (default: 0). Multiple read offsets should be separated by commas -c COLOR_SCHEME, --color_scheme COLOR_SCHEME One of default, colorbrewer, rgb, greyorfs -m HTML_FILE, --html_file HTML_FILE Output file for results (HTML) -o OUTPUT_PATH, --output_path OUTPUT_PATH Files are saved in this directory -d, --debug Flag. Produce debug output - required arguments:
-b RIBO_FILE, --ribo_file RIBO_FILE Ribo-Seq alignment file in BAM format -f TRANSCRIPTOME_FASTA, --transcriptome_fasta TRANSCRIPTOME_FASTA FASTA format file of the transcriptome -t TEXT, --transcript_name TEXT Transcript name