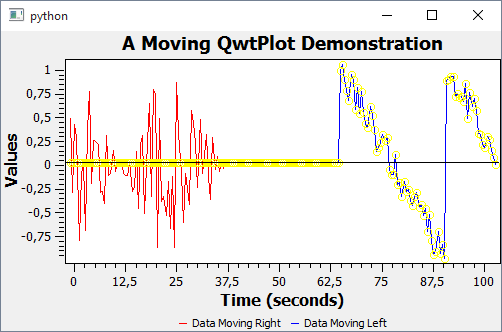
import random
import sys
import numpy as np

from qwt.qt.QtGui import QApplication, QPen, QBrush, QFrame
from qwt.qt.QtCore import QSize
from qwt.qt.QtCore import Qt
from qwt import (QwtPlot, QwtPlotMarker, QwtSymbol, QwtLegend, QwtPlotCurve,
                 QwtAbstractScaleDraw)


class DataPlot(QwtPlot):

    def __init__(self, *args):
        QwtPlot.__init__(self, *args)

        self.setCanvasBackground(Qt.white)
        self.alignScales()

        # Initialize data
        self.x = np.arange(0.0, 100.1, 0.5)
        self.y = np.zeros(len(self.x), np.float)
        self.z = np.zeros(len(self.x), np.float)

        self.setTitle("A Moving QwtPlot Demonstration")
        self.insertLegend(QwtLegend(), QwtPlot.BottomLegend);

        self.curveR = QwtPlotCurve("Data Moving Right")
        self.curveR.attach(self)
        self.curveL = QwtPlotCurve("Data Moving Left")
        self.curveL.attach(self)

        self.curveL.setSymbol(QwtSymbol(QwtSymbol.Ellipse,
                                        QBrush(),
                                        QPen(Qt.yellow),
                                        QSize(7, 7)))

        self.curveR.setPen(QPen(Qt.red))
        self.curveL.setPen(QPen(Qt.blue))

        mY = QwtPlotMarker()
        mY.setLabelAlignment(Qt.AlignRight | Qt.AlignTop)
        mY.setLineStyle(QwtPlotMarker.HLine)
        mY.setYValue(0.0)
        mY.attach(self)

        self.setAxisTitle(QwtPlot.xBottom, "Time (seconds)")
        self.setAxisTitle(QwtPlot.yLeft, "Values")

        self.startTimer(50)
        self.phase = 0.0

    def alignScales(self):
        self.canvas().setFrameStyle(QFrame.Box | QFrame.Plain)
        self.canvas().setLineWidth(1)
        for i in range(QwtPlot.axisCnt):
            scaleWidget = self.axisWidget(i)
            if scaleWidget:
                scaleWidget.setMargin(0)
            scaleDraw = self.axisScaleDraw(i)
            if scaleDraw:
                scaleDraw.enableComponent(QwtAbstractScaleDraw.Backbone, False)

    def timerEvent(self, e):
        if self.phase > np.pi - 0.0001:
            self.phase = 0.0

        # y moves from left to right:
        # shift y array right and assign new value y[0]
        self.y = np.concatenate((self.y[:1], self.y[:-1]), 1)
        self.y[0] = np.sin(self.phase) * (-1.0 + 2.0*random.random())

        # z moves from right to left:
        # Shift z array left and assign new value to z[n-1].
        self.z = np.concatenate((self.z[1:], self.z[:1]), 1)
        self.z[-1] = 0.8 - (2.0 * self.phase/np.pi) + 0.4*random.random()

        self.curveR.setData(self.x, self.y)
        self.curveL.setData(self.x, self.z)

        self.replot()
        self.phase += np.pi*0.02


def make():
    demo = DataPlot()
    demo.resize(500, 300)
    demo.show()
    return demo


if __name__ == '__main__':
    app = QApplication(sys.argv)
    demo = make()
    sys.exit(app.exec_())
