Tutorial
2D Example:
>>> from scipy.misc import lena
>>> import matplotlib.pyplot as plt
>>> from rwt import dwt, idwt
>>> from rwt.wavelets import daubcqf
>>> img = lena()
>>> h0, h1 = daubcqf(4, 'min')
>>> L = 1
>>> y, L = dwt(img, h, L)
>>> plt.imshow(y)
>>> plt.show()
2D Example’s output and explanation:
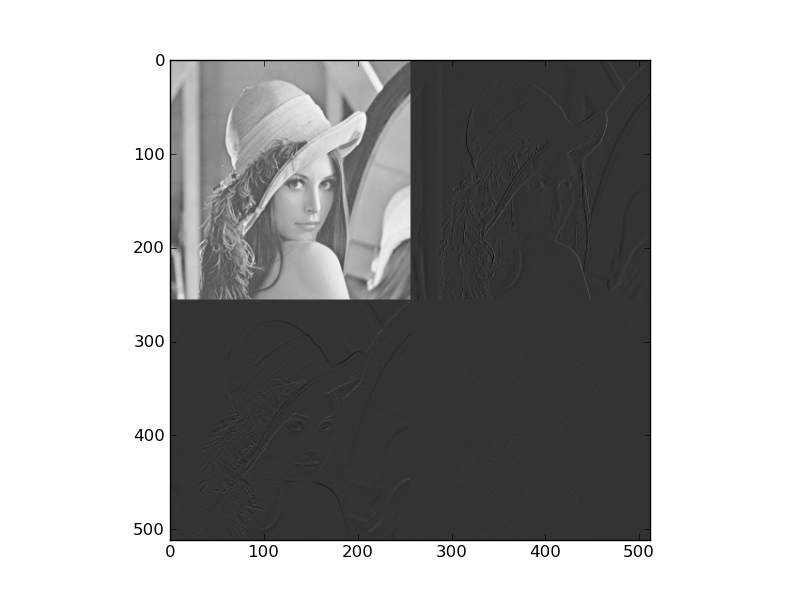
The coefficients in y are arranged as follows.
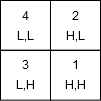
where:
- High pass vertically and high pass horizontally
- Low pass vertically and high pass horizontally
- High pass vertically and low pass horizontally
- Low pass vertically and Low pass horizontally (scaling coefficients)