The pyWebGraph console
The pyWebGraph console is meant as a tool to explore WebGrph data. A sample session could be:
$ jython -m pywebgraph.console
Welcome to pyWebGraph console!
>> graph example
>> pwn
#0
>> ls
0: #1
1: #342
...
>> namemaps example
>> pwn
#0 http://acireale.src.cnr.it/
>> ls #0
0: #1 http://acireale.src.cnr.it/acireale2001/
1: #342 http://acireale.src.cnr.it/htm/diretta.htm
...
>> cn "http://acireale.src.cnr.it/acireale2001/"
First of all you load a graph with the graph command, then you can explore it (much like you would do with your filesystem): using pwn and cn (to print and change, respectively, the working node) and using ls to list outlinks. Additionaly, with namemaps, you can load a map from node numbers to their names (and vice versa if possible) that will be used when printing (and identifying) nodes.
Node specifications
A node can be specified to commands of the console in three ways:
- as an absolute node number (a non negative integer prefixed by #),
- as a node name (any string enclosed in double quotes),
- as a path (relative to the current working node).
The current working node is a given node of the graph. A path is a sequence of integers separated by / (leading, trailing, and repeated separators are ignored); numbers in the sequence refer to outlinks (or inlinks, if prefixed by a -, in any case, numbered starting from 0). For example, path 2/4 referes to the fifth outlink of the third outlink of the current node; similarly, path 3/-1/5 refers to the sixth outlink af the second inlink of the fourth outlink of the current working node.
Note
Since web graphs need not to be connected, it is not true in general that every node can be specified with a path relative to some specific (so to say “root”) node, hence the notion of an absolute path makes little sense here. This navigational methaphor hence differs from the filesystem case, corresponding to a (of course connected) tree.
Visualization
If the console is given the -r/--renderer command line option pointing to a Ubigraph server, then the console can be used to visualize WebGraph data using the commands bfs, isg, hl, label, and clear; please use the help console command for details.
A sample session could be:
$ jython -m pywebgraph.console -r-
Welcome to pyWebGraph console!
>> graph example
>> namemaps example
>> bfs 0
>> bfs 1
>> label 0 on
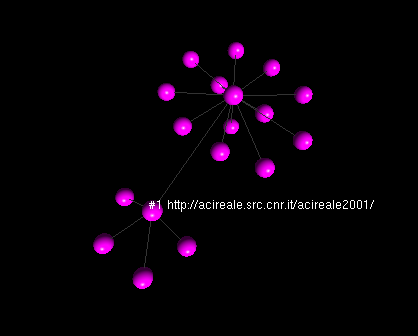
This could give an output like
XML-RPC Server
It is likely that one wants to use this library with a standard Python interpreter (say one that supports the Python 2.6 version). This is made possible by limiting the need of a Java capable interpreter (like Jython that supports only the Python 2.5 vesrion) to the code accessing WebGraph, allowing any other interpreter to access the data via XML-RPC.
Two low level components are needed: a server (implemented in module pywebgraph.webgraph.server) exposing the data and a client (implemented in pywebgraph.webgraph.client) able to access it.
Such mechanism is made available the console via the -g/--graph-server command line option (and thanks to the fact that pywebgraph.webgraph.server is also executable).
A sample session could be:
$ jython -m pywebgraph.webgraph.server &
Listening on port 8000
$ python2.6 -m pywebgraph.console -g-
Welcome to pyWebGraph console!
>> graph example
>> ls
0: #1
1: #342
...