memtop documentation
Contents:
Introduction
Intended to help you to analyse and understand system memory utilization of your Linux box and check memory consumption of processes running there. It is intended to run in long-period iterations to let you see changes in overall memory utilization and consumption of individual processes.
To simplify analysis it can create a log file and here you can also download a simple script to generate graphs from it.
Typical situation is when you need to reduce RAM usage of your box or you want to monitor your system for longer period of time to identify misbehaving applications.
The script calculates amount of private/writeable for each process (using /proc/$PID/maps files) and prints biggest ones. It completely ignores private/non-writeable and shared memory. The reasons are:
- shared memory is hard to interpret and at the end you still can not say ‘how much memory is proces x taking’.
- when tracking memory use of a process over time, private/writeable memory is most iteresting portion of process’s memory use. Memtop will help you to find out how it changes over time. Also keep in mind that problems like memory leaks will be shown just in this number...
- private/writeable memory is supposed to be an amount that will be freed in ‘memory’ (here the term includes both: RAM and swap) when process terminates
- there are other tools to show this kind of info (shared memory use), so there is no need to have it included also here
In addition to pure listing of processes and their memory use, it can track memory use in general way and help you identify periods when your system is short of RAM and how bad it is. For more info, scroll down to “Overall system memory utilization info” section.
Example of output
One example is better then ten lines of description
  PID |   private/writ. mem |command                                                       10 Apr 11:30:22
      |  current |  change  |(might be truncated)                                         (waiting 1 min.)
18005 | 400.9 MB |    +     |/opt/firefox-10/firefox
 8530 |  91.0 MB |          |/usr/lib/virtualbox/VirtualBox --comment ArchLin --startvm 7ed0ed70-e8c6-4b8a
 3187 |  69.4 MB |          |tea
 2663 |  57.6 MB |          |xfce4-terminal
30024 |  55.6 MB |          |/usr/lib/openoffice/program/soffice.bin -writer -splash-pipe=5
 2724 |  51.3 MB |          |geany
18253 |  47.8 MB |          |/opt/firefox-10/plugin-container /usr/lib/flashplayer-mozilla/libflashplayer.
 1726 |  26.7 MB |          |/usr/bin/X :0 -audit 0 -auth /var/lib/gdm/:0.Xauth -nolisten tcp vt7
  1578 |  24.9 MB |          |/usr/sbin/rsyslogd -c4
 24192 |  23.1 MB |          |/usr/lib/virtualbox/VirtualBox
   Writeable/RAM: ===============================  80.0%
   RAM use without cached pages: 43.4% , SWAP use: 19.9%                       # enabled with -m option
   Swapping: 0.0 / 0.0, Paging: 0.0 / 6.2 (in/out / sec). CPU I/O wait: 0.0 %   # enabled with -m option

   PID |   private/writ. mem |command                                                       10 Apr 11:31:21
       |  current |  change  |(might be truncated)                                         (waiting 1 min.)
 18005 | 382.1 MB | ---      |/opt/firefox-10/firefox
  8530 |  91.0 MB |          |/usr/lib/virtualbox/VirtualBox --comment ArchLin --startvm 7ed0ed70-e8c6-4b8a
  3187 |  69.4 MB |          |tea
  2663 |  57.6 MB |          |xfce4-terminal
 30024 |  55.6 MB |          |/usr/lib/openoffice/program/soffice.bin -writer -splash-pipe=5
  2724 |  51.3 MB |          |geany
 18253 |  47.8 MB |          |/opt/firefox-10/plugin-container /usr/lib/flashplayer-mozilla/libflashplayer.
  1726 |  26.7 MB |          |/usr/bin/X :0 -audit 0 -auth /var/lib/gdm/:0.Xauth -nolisten tcp vt7
  1578 |  24.9 MB |          |/usr/sbin/rsyslogd -c4
 24192 |  23.1 MB |          |/usr/lib/virtualbox/VirtualBox
   Writeable/RAM: ==============================  78.8%
   RAM use without cached pages: 43.0% , SWAP use: 19.9%
   Swapping: 0.0 / 0.0, Paging: 0.0 / 3.3 (in/out / sec). CPU I/O wait: 0.0 %
This example shows “graph” mode, and here the third column “previous” indicates change against previous iteration. It is just to visualise what program (its RAM occupation) is growing or shrinking.
Use
No installation is needed, just run the script. Available parameters are
|| -p :math:`integer ||wait time between iterations (in minutes)|| ||-s graph|numb||two alternatives how to present mainly data from former iteration|| || -l `integer||number of lines - processes to show|| ||-m ||more info about memory utilization (since 0.9.4)|| || -L || log data to file, see section about graphs below|| ||-h||help||
If you have downloaded&saved the memtop to a directory not in your path, you can consider using an alias for root, f.e. put following (use the correct path of course)in /root/.bashrc file:
alias memtop='/home/tibor/dev/memtop/memtop-1.0.2.py'
Important note: The script should be run as root or you will not get data for processes running under other users.
Overall system memory utilization info (introduced from 0.9.4)
From this release you can use swith “-m” / “-more” to get two additional lines. Those two lines do not deal with individual applications but are depicting overall utlization of system memory and some other symptomps of possible memory shortage. First line shows how much of your RAM & swap space is utilized:
RAM use without cached pages: 43.6% , SWAP use: 19.1%
It takes data from /proc/meminfo and consideres following lines:
- Memtotal - as size of your RAM
- Memfree - as free portion of RAM
- Cached - ”...in-memory cache for files read from the disk...” - this portion of RAM is not reported in Memfree as free memory, but due to the character of data, kernel can drop stored data immediately and use freed capacity as needed, therefore this chung of data is considered as free memory by memtop
- Swaptotal
- Swapfree
And the other line looks like:
Swapping: 0.0 / 0.0, Paging: 0.0 / 1.1 (in/out / sec). CPU I/O wait: 0.0 %
This should be pretty self-explanatory. In case you dont understand what are these numbers about, the higher numbers the worser. Technical note: the data are calculated (for this second line) for whole (just ending) period.
Loging + Visualisation (graphs) of logs (from 0.9.6)
From 0.9.6 you can use swith -L/–log that will create file memtop.log in current directory, with content like:
##Date     time   wrtble ram   swap     pgin   pgout TopApp:PID writble(B)   command
10/04/2012 11:29   80.0  43.3  19.9      0.0     0.0   18005    419979264 /opt/firefox-10/firefox
10/04/2012 11:30   80.0  43.4  19.9      0.0    6.18   18005    420384768 /opt/firefox-10/firefox
10/04/2012 11:31   78.8  43.0  19.9      0.0     3.3   18005    400646144 /opt/firefox-10/firefox
10/04/2012 11:32   78.8  43.0  19.9     1.72    1.72   18005    400646144 /opt/firefox-10/firefox
10/04/2012 11:33   78.8  43.6  19.9      0.0   18.82   18005    401170432 /opt/firefox-10/firefox
10/04/2012 11:34   78.8  43.8  19.9      0.0   19.63   18005    401367040 /opt/firefox-10/firefox
The log provides the very same numbers as memtop prints out in console, but in a form that is easy to use with gnuplot, or f.e. to import into office suite..
You can use my own shell script (see download section, gnuplot needed) to create two graphs from the log file. Use:
$ ./memtop-graph.sh  mem2.log
Input file:  mem2.log
Creating:    PgInOut.png
Creating:    MemStat.png
If no argument is given, it expects memtop.log file in current directory. Example of output:
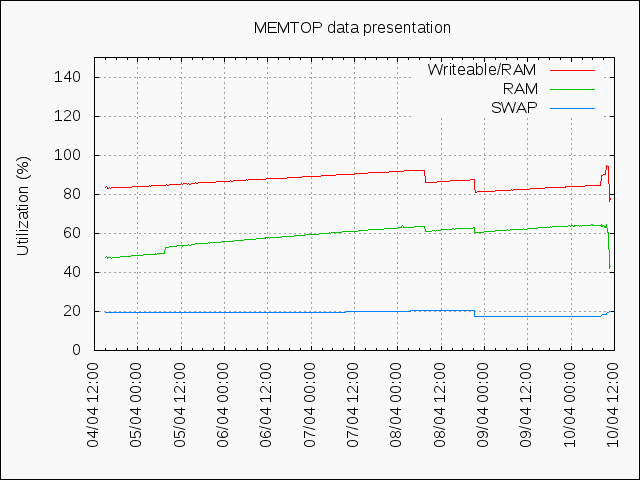
Obviously, nothing much special here. The box was idle most of time, just RAM utilization was growing steadily, this was caused by few instances of xfe leaking heappily. The drop on the end of graph happened when I killed those instances.
Another example: memory exhaustion
This is like a case study where you can see how system memory exhaustion looks in numbers. Here I started two instances of gimp and started some memory intensive operations (resizing). Outcome of this you can see below:
##Date     time   wrtble ram   swap     pgin   pgout   IOw TopApp:PID wrtbl(KB) command
12/04/2012 13:53   83.1  30.5  48.7     3.99    6.33   0.1    3692     396032  /opt/firefox-10/firefox
# I started resizing img 10x
12/04/2012 13:54  154.2  91.0  73.4  2757.42 5283.52  65.9    3431    1391288  gimp
12/04/2012 13:55  153.9  88.6  77.1  3632.48 5142.24  89.9    3431    1391488  gimp
12/04/2012 13:56  154.2  92.1  69.9  6345.05 8097.35  86.5    3431    1391740  gimp
# few lines skipped here
12/04/2012 14:01  156.0  92.5  75.1  4334.27 2395.05  83.0    3431    1390860  gimp
12/04/2012 14:02  163.9  90.9  92.1  4544.95 4394.79  77.2    3431    1390860  gimp
# second instance of gimp launched here
12/04/2012 14:03  172.4  93.2 100.0  6013.65 1994.96  88.6    3431    1390860  gimp
12/04/2012 14:05  172.4  93.7 100.0  5885.28  791.90  91.1    3431    1390860  gimp
# here the first (bigger) instance of gimp killed (by OOM killer probably)
12/04/2012 14:06   80.2  41.7  24.0  6844.10  212.41  92.3    3692     379772  /opt/firefox-10/firefox
12/04/2012 14:07   81.4  42.5  23.4   763.69    8.63  12.0    3692     379264  /opt/firefox-10/firefox
12/04/2012 14:08   81.4  42.5  23.4     0.76    2.06   0.0    3692     379392  /opt/firefox-10/firefox
What’s next?
Well, I have no ideas. Currently I am only fixing small issues if any created in Issues section or if I receive an email. So if you have any idea, let us know. You can send an e-mail to info@martin-thoma.de or [add an issue at GitHub](https://github.com/MartinThoma/memtop/issues).
Note from Tibor Bamhor:
The Memtop is distributed for free and under GPLv2 license. I dont expect earning big money from this, but if the tool is useful for you, you can consider paying a voluntary price for the time I spent developing and maintaining it.
