Python Log Viewer
The Python Log Viewer is a desktop application which allows viewing of events logged to TCP, UDP and ZeroMQ sockets by an application using Python’s standard logging package.
Download
Because the application relies on a recent Qt version which may or may not be installed on your system, the viewer is packaged in binary formats for Windows, Linux and Mac OS X. You can download the relevant packages through the links below:
- Windows binary distribution - unzip the package into a directory and run the executable (logview.exe) in that directory.
- Mac OS X binary distribution - mount the disk image in the normal way.
- Linux binary distribution - unzip the package into a directory and run the executable (logview) in that directory.
Alternatively, if you have Qt >= 4.7.0 and PyQt >= 4.7.4 already installed, you can use the source distribution:
- Source distribution - unzip the package into a directory and run python logview.py in that directory. This assumes that PyQt4 (and optionally pyzmq) will be found in the module search path.
Command-line parameters
The following command-line parameters are available.
-h, --help Show a help message and exits -c CAPACITY, --capacity=CAPACITY Maximum number of messages to hold. If specified as zero (the default), there’s no limit (other than available memory) to the number of records collected. -t TCPHOST, --tcp=TCPHOST Where to listen for TCP traffic (host[:port]). The default is 0.0.0.0, which listens on all IP addresses and on the default TCP port defined in logging.handlers (9020). -u UDPHOST, --udp=UDPHOST Where to listen for UDP traffic (host[:port]). The default is 0.0.0.0, which listens on all IP addresses and on the default UDP port defined in logging.handlers (9021). -z ZMQHOST, --zmq=ZMQHOST Where to listen for ZeroMQ traffic (host[:port]). The default is localhost:9024.
The default settings should be adequate for most purposes.
User Interface
The application’s main window is as shown in the diagram below.
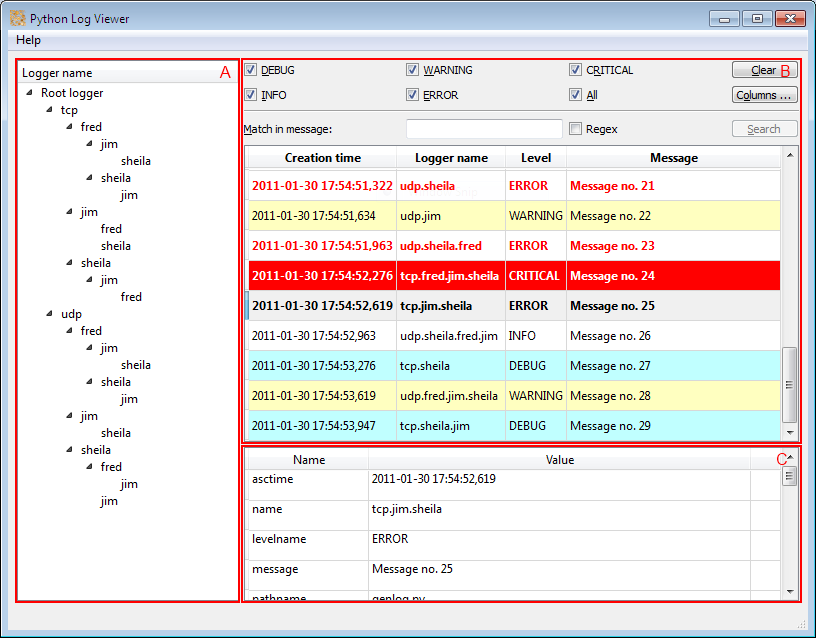
The pane at left, labelled A, shows the hierarchy of loggers. The diagram shows a hierarchy with tcp and udp in it, but these are just an artifact of the test program used to generate log records. In practice, you will see the combined logger hierarchies of all applications which send log records, either via UDP or via TCP, to a specific viewer instance.
The pane at top right, labelled B, shows the log records that have been collected (received over the network).
The pane at bottom right, labelled C, shows the details of a single log record selected in the pane above it.
Capture of log events
Capturing of log events is automatically started when the program is run, and continues until the program is stopped.
If you scroll right to the bottom of the records pane, it’s assumed you want to stay at the bottom. Accordingly, the records pane will scroll as capture proceeds, so that the last collected records remain in view. The automatic scrolling stops when you scroll off the bottom of the records pane.
You can clear all captured records using the Clear button (you will be prompted to confirm your action).
Pane resizing
There are splitters between the hierarchy and the record panes, and between the record and record property panes, which allow you to resize the panes. You can double click on the splitter handles, too. If you double-click with the left mouse button, the pane to the left or top is collapsed to zero width/height; if you use the right mouse button, the pane of the right or bottom is collapsed to zero size.
Double-clicking on a splitter handle after you collapsed a pane will restore the collapsed pane to its former size.
Note: On some systems, left-double clicking doesn’t work as described - this seems to be due to the platform’s X libraries. It appears to work correctly on Windows, Mac OS X and Ubuntu Maverick.
Column resizing and reordering
You can resize columns and reorder them using drag-and-drop. The “Columns...” button allows you to specify which columns are displayed, and their ordering, by showing the “Column Preferences” dialog:
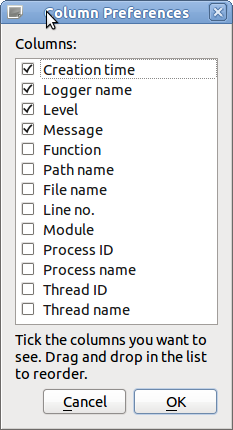
In this dialog, you can use drag and drop to reorder the columns, and use the check box to control visibility of columns.
Viewing multi-line record properties
In the record properties pane at bottom right, values that contain newlines (such as exception text) will result in a ... appearing in the rightmost column, clicking on which will display the multi-line text in a dialog box, which allows you to select some or all of the text and copy it to the clipboard:

Filtering by level
You can select which events to display using the level checkboxes at the top of the records pane. You can select individual levels separately (which is why a slider has not been provided). The All checkbox reflects its state to all the other level checkboxes.
Filtering by hierarchy
You can also select records for display according to their place in the logger hierarchy. If you select any node in the logger pane, then only records in that part of the hierarchy are shown. To show all records, click the “Root logger” node.
Filtering by hierarchy works in conjunction with filtering by level, i.e. both criteria are applied at all times.
Using ZeroMQ
A ZeroMQ handler
By using pyzmq, you can use the following handler to publish logging events to a ZeroMQ PUB socket:
import zmq

class ZeroMQHandler(logging.Handler):
    def __init__(self, uri, socktype=zmq.PUB, ctx=None):
        logging.Handler.__init__(self)
        self.ctx = ctx or zmq.Context()
        self.socket = zmq.Socket(self.ctx, socktype)
        self.socket.bind(uri)

    def close(self):
        self.socket.close()

    def emit(self, record):
        """
        Emit a record.

        Writes the LogRecord to the queue, preparing it for pickling first.
        """
        try:
            # The format operation gets traceback text into record.exc_text
            # (if there's exception data), and also puts the message into
            # record.message. We can then use this to replace the original
            # msg + args, as these might be unpickleable. We also zap the
            # exc_info attribute, as it's no longer needed and, if not None,
            # will typically not be pickleable.
            self.format(record)
            record.msg = record.message
            record.args = None
            record.exc_info = None
            data = pickle.dumps(record.__dict__)
            self.socket.send(data)
        except (KeyboardInterrupt, SystemExit):
            raise
        except Exception:
            self.handleError(record)
which you can use like this:
handler = ZeroMQHandler('tcp://localhost:9024')
some_logger.addHandler(handler)
Using a ZeroMQ proxy
Often, the machine on which you run logview will not have a stable IP address: for example if it’s a desktop machine, it may well have a dynamic IP address obtained via DHCP. If you’re using a ZeroMQHandler to send log messages from your applications, it could connect to a proxy on a suitable server machine with a stable IP address, to which you can connect logview. For example, say you have three logically different machines: server, which runs the application generating logs, proxy, which runs a ZeroMQ proxying application, and desktop, which runs logview.
The following script can be run on proxy. It assumes that on server, a ZeroMQ PUB socket has been set up on port 9024, to which logging events are published. The proxy listens for events published by the server and republishes them on port 9025.
You can then get logview to pick up the republished events using:
logview -z proxy:9025
Of course, you would substitute the appropriate host names for server and proxy, and make other changes to adapt this script to your needs.
Here’s the proxy script:
import zmq

def main():
    ctx = zmq.Context()
    upstream = zmq.Socket(ctx, zmq.SUB)
    upstream.connect('tcp://server:9024')
    downstream = zmq.Socket(ctx, zmq.PUB)
    downstream.bind('tcp://0.0.0.0:9025')
    upstream.setsockopt(zmq.SUBSCRIBE, '')
    try:
        n = 0
        while True:
            message = upstream.recv()
            downstream.send(message)
            n += 1
            if (n % 10) == 0:
                print('%d messages proxied' % n)
    finally:
        upstream.close()
        downstream.close()

if __name__ == '__main__':
    main()
Potential issues
Loss of messages when using TCP
If you run logview after your application starts sending, you may lose messages. That’s because the SocketHandler implementation uses an exponential back-off algorithm when a socket error is encountered. When your application fails to open a connection to logview (because it hasn’t been run yet), the SocketHandler instance will drop the message it was trying to send. When subsequent messages are handled by the same SocketHandler instance, it will not try connecting until some time has passed. The default parameters are such that the initial delay is one second, and if after that delay the connection still can’t be made, the handler will double the delay each time up to a maximum of 30 seconds.
If you encounter this problem, you can either use your own subclass of SocketHandler which tries connecting every time, or use a solution based on ZeroMQ using a proxy (see above). You can also use a DatagramHandler rather than a SocketHandler, but as UDP makes no delivery guarantees, you could still lose messages.
Older versions of Qt
This application was developed and tested with Qt 4.7 and PyQt 4.7.4, and may not work with earlier versions of Qt and PyQt. If in doubt, use one of the binary distributions.
PySide support
While designed to allow PySide to be used in place of PyQt, PySide is not currently supported. Such support may be added in future, when PySide has ironed out its current bugs (it’s still in beta, after all).
If you want to try and add support yourself, get the source distribution and change the qt module so that it imports from PySide rather than PyQt4. (All other modules in logview import Qt classes from the qt module, so they won’t need to be changed).