4. Leaflet and membrane identification
4.1. How FATSLiM identifies leaflets and membranes
4.1.1. Step 1. Lipid simplification
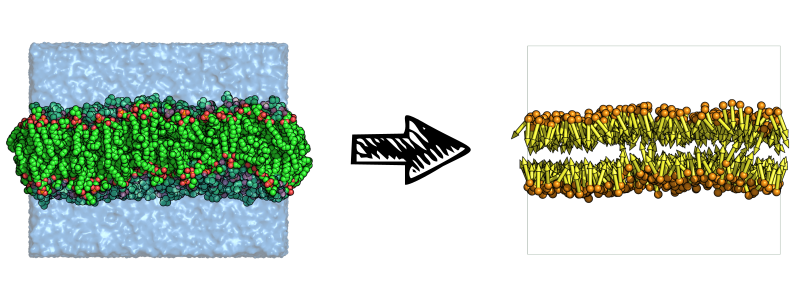
A full description of the lipids is not essential to the calculation of most bilayer properties. This is why, when appropriate, FATSLiM describes each lipid by one bead for the head group and one vector for its orientation:
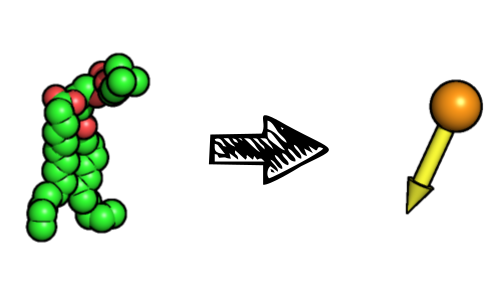
This leads to a rather simplified description of the system which is used internally by FATSLiM:
The role of the index file that users need to provide is to define the atoms to be considered as the head group. FATSLiM identifies lipids based on residue indices meaning that atoms from the same residue (as in same residue index) will be considered as being part of the same head group and their centroid will be used for the resulting bead. This also means that a lipid molecule must be defined as a single residue for FATSLiM to work properly. The lipid direction is simply inferred from the vector from the head group bead to the whole lipid centroid.
See also
See Generating the index file for further details.
4.1.2. Step 2. Local normal calculation
The key feature of FATSLiM is to use the calculation of local normals rather than to rely on assumption on the membrane topology and/or orientation. Normal estimation from a point cloud (here the cloud made by the lipid beads) is intensively used in domains such as computer graphics or surface reconstruction from Lidar data for instance.
In a nutshell, normal estimation is done in three steps:
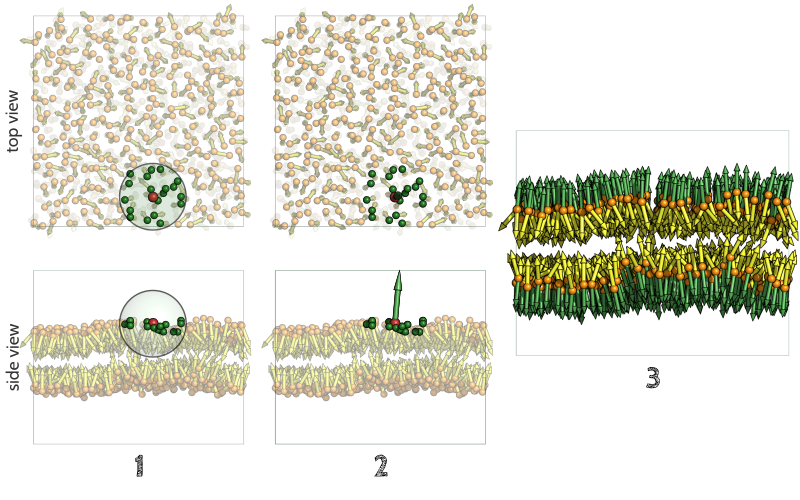
- For each lipid, the point cloud considered is consituted by all the beads within a user-tweakable cutoff distance (see --cutoff) from the reference lipid.
Important
FATSLiM is PBC-aware, so the neighbor search performed here, as well as all the later ones, satisfy the minimum image convention.
- A principal component analysis is performed. The eigenvector related to the smallest eigenvalue is the normal.
- This process is repeated for all the lipids, giving as many local normals as there are lipids.
See also
If you want more details on normal estimation, you should take a look at the Point Cloud Library and, in particular, its 3D feature tutorial.
4.1.3. Step 3. Leaflets and membrane identification
4.1.3.1. Leaflets identification
To be considered as part of the same leaflet, two lipids must fulfill the following conditions:
- They must be close (i.e. closer than the cutoff distance)
- Their orientation must be compatible (i.e. roughly colinear and not anti-parallel)
The leaflet is then identified from lipid to lipid.
4.1.3.2. Membrane identification
Once the leaflets are identified, they are checked for compatibility:
They must be constituted from, at least, 30 lipids
If both planar:
- the distance between both leaflets both not exceed 10 nm (i.d. must be realistic)
- the two mean normals (one for each leaflet) must be (roughly) anti-parallel
If both non-planar (i.d. leaflets from a vesicle):
- the two centers of geometry must be close (i.d. leaflet must be concentrical)
4.1.4. Examples
Here are a few examples of membrane identification as done by FATSLiM:
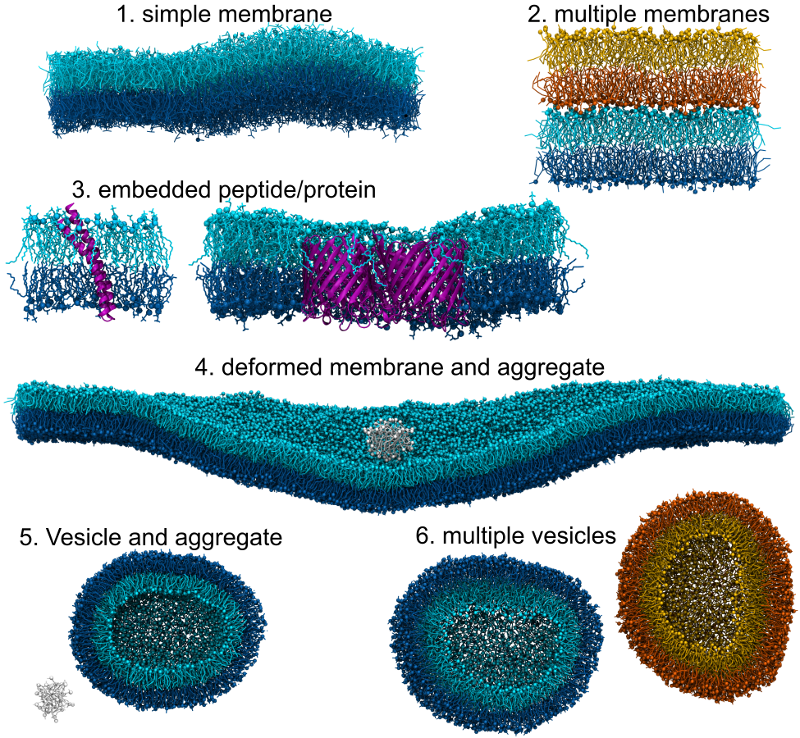
Leaflets from the same membrane are represented using two shades of the same color. No color means that the aggregate does not belong to any membrane. Proteins (when present) are depicted in purple using the cartoon representation.
4.2. Associated command and parameters
4.2.1. Command
If you want FATSLiM to identify membranes, use the following command:
fatslim membranes
4.2.2. Parameters
In addition to the common analytical parameters,
Some parameters are specific to the membranes command.
4.2.2.1. Analytical parameters
4.2.2.1.1. Cutoff distance for leaflet identification
Because all analytical commands rely on membrane identification, the cutoff distance associated with the normal estimation and the membrane identification (option --cutoff) is described with other common analytical parameters.
4.2.2.2. Output files
4.2.2.2.1. Number of membranes
- Associated parameter:
--outputor-o - Purpose: This option specifies the filename where FATSLiM should save the number of membranes found over time (as a XY plot).
- Accepted file extensions: .xvg
- Default value: None (no output file)
4.2.2.2.2. Leaflets and headgroups
- Associated parameter:
--output-index(full lipids) or--output-index-hg(only headgroup) - Purpose: Once membrane identification is done, these two options allow users to save the lipid (
--ouput-index) or head group (--output-index-hg) atoms to an index file so the atoms (grouped by leaflet) can used as selection for other tools such as the GROMACS ones. - Accepted file extensions: .ndx.
- Default values: None (no output file)
See also