Timeserie Interface
Dynts data class
- class dynts.DynData(name, info)
Base class for data. It has two subclasses: the timeseries interface dynts.TimeSeries and dynts.xydata for 2 dimensional data types. An instance of this class contains a dataset of series. Each serie can be seen as an independent entity which, nevertheless, can have close tights with other series in the dataset.
- name
name of data object.
- info
additional information regarding data object.
- names()
List of names for series in dataset. It will always return a list or names with length given by dynts.DynData.count.
- count()
Number of series in dataset.
- series()
Iterator over series in dataset.
- serie(index)
Get serie data by column index.
- display()
Nicely display self on the shell. Useful during prototyping and development.
Interface class
- class dynts.TimeSeries(name='', date=None, data=None, info=None)
A dynts.DynData specialisation for timeseries back-ends. This class expose all the main functionalities of a timeseries
- type
string indicating the backend type (zoo, rmetrics, numpy, etc...)
- shape
tuple containing the timeseries dimensions.
- count()
Number of series in timeseries.
- asbtree()
Return an instance of dynts.utils.wrappers.asbtree which exposes binary tree like functionalities of self.
- ashash()
Return an instance of dynts.utils.wrappers.ashash which exposes hash-table like functionalities of self.
- max(fallback=False)
Max values by series
- min(fallback=False)
Max values by series
- mean(fallback=False)
Mean values by series
- median(fallback=False)
Median values by series. A median value of a serie is defined as the the numeric value separating the higher half, from the lower half. It is therefore differnt from the TimeSeries.mean() value.
The median of a finite list of numbers can be found by arranging all the observations from lowest value to highest value and picking the middle one.
If there is an even number of observations, then there is no single middle value; the median is then usually defined to be the mean of the two middle values
- returns(fallback=False)
Calculate returns as delta(log(self)) by series
- dates(desc=None)
Returns an iterable over datetime.date instances in the timeseries.
- keys(desc=None)
Returns an iterable over raw keys. The keys may be different from dates for same backend implementations.
- values(desc=None)
Returns a numpy.ndarray containing the values of the timeseries. Implementations should try not to copy data if possible. This function can be used to access the timeseries as if it was a matrix.
- items(desc=None)
Returns a python generator which can be used to iterate over dynts.TimeSeries.dates() and dynts.TimeSeries.values() returning a two dimensional tuple (date,value) in each iteration. Similar to the python dictionary items function. The additional input parameter desc can be used to iterate from the greatest to the smallest date in the timeseries by passing ‘’desc=True``
- series()
Generator of single series.
- isconsistent()
Check if the timeseries is consistent
- start()
Start date of timeseries
- end()
End date of timeseries
- frequency()
Average frequency of dates
- shape
The dimensions of the timeseries. This is a two-elements tuple of integers indicating the size of the timeseries and the number of series. A timeseries with 2 series of length 250 will return the tuple:
(250,2)
- delta(lag=1, **kwargs)
First order derivative. Optimised.
Parameters: lag – backward lag
- delta2(lag=2, **kwargs)
Second order derivative. Optimised.
Parameters: lag – backward lag
- logdelta(lag=1, **kwargs)
Delta in log-space. Used for percentage changes.
- var(ddof=0)
Calculate variance of timeseries. Return a vector containing the variances of each series in the timeseries.
Parameters: ddof – delta degree of freedom, the divisor used in the calculation is given by N - ddof where N represents the length of timeseries. Default 0. 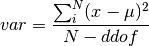
- sd()
Calculate standard deviation of timeseries
- apply(func, window=None, bycolumn=True, align=None, **kwargs)
Apply function func to the timeseries.
Parameters: - func – string indicating function to apply
- window – Rolling window, If not defined func is applied on the whole dataset. Default None.
- bycolumn – If True, function func is applied on each column separately. Default True.
- align – string specifying whether the index of the result should be left or right (default) or centered aligned compared to the rolling window of observations.
- kwargs – dictionary of auxiliary parameters used by function func.
- rollapply(func, window=20, **kwargs)
A generic rolling function for function func. Same construct as dynts.TimeSeries.apply() but with default window set to 20.
- rollmax(**kwargs)
A rolling function for max values. Same as:
self.rollapply('max',**kwargs)
- rollmin(**kwargs)
A rolling function for min values. Same as:
self.rollapply('min',**kwargs)
- rollmedian(**kwargs)
A rolling function for median values. Same as:
self.rollapply('median',**kwargs)
- rollmean(**kwargs)
A rolling function for mean values: Same as:
self.rollapply('mean',**kwargs)
- rollsd(scale=1, **kwargs)
A rolling function for stadard-deviation values: Same as:
self.rollapply('sd',**kwargs)
- make(date, data, **kwargs)
Internal function to create the inner data:
- date iterable/iterator/generator over dates
- data iterable/iterator/generator over values
XY data class
- class dynts.xydata(name='', data=None, info=None, extratype=None, **kwargs)
A dynts.DynData class for 2-dimensional series of data with an extra dimension which contain further information for of each x-y pair. For example a date in a timeseries scatter plot.