Admin integration
Of course, django-geoportail couldn’t ship without any Django admin support. We will see how you can easily use Geoportal’s data within the Django admin.
Registration of a model
You have started a project and a few apps in this project. Now you need a model that contains some geographic data.
Definition of the model
There is nothing more than GeoDjango, you just need to define a Django model with one or more geographic field and stick a GeoManager to it:
# models.py
from django.contrib.gis.db import models

class Polygon(models.Model):
    name = models.CharField('Name', max_length=255)
    surface = models.PolygonField()

    objects = models.GeoManager()

    def __unicode__(self):
        return u'%s' % self.name
Registration of the model
Now, we need to register the model within the admin interface, so we can add instances of this model to the database using rich map widgets. This can be done very easily in the admin.py file:
# admin.py
from geoportal import admin
from app.models import Polygon

admin.site.register(Polygon, admin.GeoPortalAdmin)
And you’re done! Start your development server, go to your admin interface and see the map that pops up when you want to add an object:
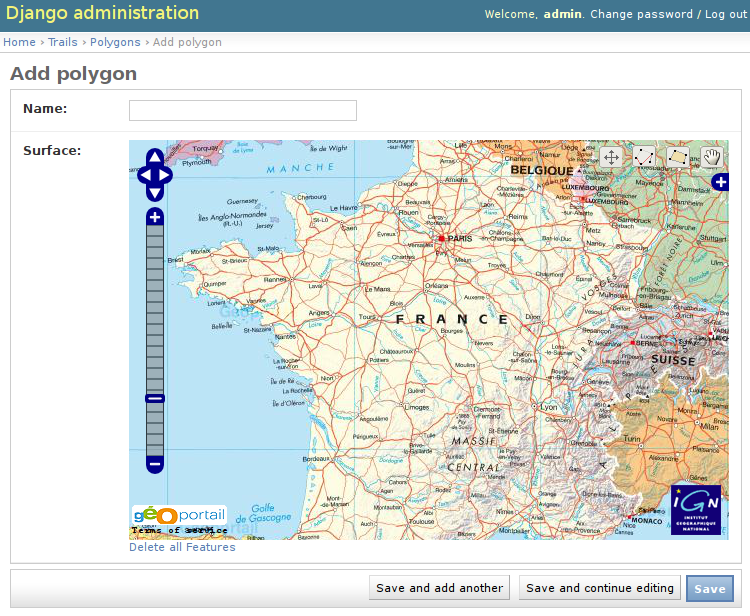
The map is centered on France since this is where we have the most detailed information and the highest resolution. However, some layers are available in the entire world.
Customization of the map
How cool was that? We have access to zoomable, high-quality maps in a few lines of python code!
Example
Let’s do some customisation. As you would have guessed, the customization is simply done by subclassing the base admin class provided by django-geoportail. Here is a simple example
# admin.py
from geoportal import admin
from app.models import Polygon

class PolygonAdmin(admin.GeoPortalAdmin):
     map_info = True
     layers = (
         ('maps', 1),
     )

admin.site.register(Polygon, PolygonAdmin)
We have overriden a few options here. map_info is a boolean indicating whether to show the 50px-high blue bar below the map. The layers tuple defines which layers we want to display, this will be fully explained later. (athough in this case, the value is the default one). Here is what our admin interface looks like now:
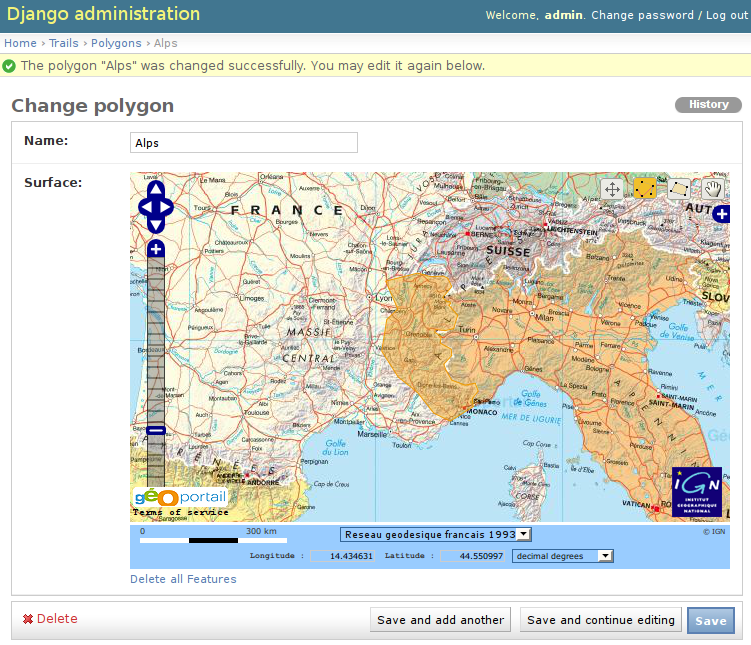
Here I have added a polygon that covers all the French part of the Alps. We will see it again later. Note the blue bar at the bottom of the map.
Admin options reference
Here is a full list of the currently supported admin options that you can use to customize your admin widgets.
map_width: the width of the map (in pixels). Default: 600
map_height: the height of the map, in pixels. Default: 400
default_zoom: the zoom level when a new empty map is created. Default: 5
default_lon: default longitude for a new map. Default: 2
default_lat: default latitude for a new map. Default: 47. default_lon, default_lat and default_zoom are set to display a map centered on France with the whole country. They can be easily overriden to focus a map to a specific town or area.
point_zoom: the zoom level to select when you see a single point. Default: 14, for a 1:25000 map (best resolution available)
map_info: show Geoportal’s scale and coordinates widget. Default: False
layers: A 2-tuple tuple to customize the layers. Default: ( ('maps', 1), ). The format is ( ('code', opacity), (..., ...), ). code is the codename of the layer you want to display, opacity is its opacity, between 0 and 1.
The order is important, the layers are added to the map in the same order as they are defined. If you add a layer with an opacity set to 1 to some previously added layers, this will hide the previous layers.
Available layers are:
- 'photos'
- 'maps'
- 'terrain': elevation map
- 'cadaster': cadastral parcels
- 'hydrography'
- 'roads'
- 'railways'
- 'runways'
- 'buildings'
- 'gov': utility and governmental services
- 'boundaries': adminstrative boundaries
- 'coast': sea regions
Note that layers may or may not be available depending on your API key. The free contract gives you only 'photos' and 'maps'.
For more information about the different layers, please read the IGN documentation on available layers
As an example, if you want a slighlty-transparent layer of aerial photos over a map, you can write:
layers = (
    ('maps', 1),
    ('photos', 0.3),
)
layerswitcher: Display the menu to toggle each layer’s visibility. Default: True.