Favorite Composer
Let’s say you have a couple of composers that you want to get some feedback on. Here are several different approaches you could take.
Simple Poll
Let’s simply allow users to pick their favorite composer from a list. In other words, you could set this up as a simple poll with a pie chart display that breaks down the results. We will have a single question where the user may pick a composer. We’ll set it up so users can enter multiple times which will allow them to stuff the ballot box for a particular composer or vote on multiple composers.

Yes or No For Each Composer
For this approach, we’ll let each user enter the survey only once. Every composer gets a separate check box. We’ll use the default survey report to display a pie chart for every composer showing checks vs. empty checks.

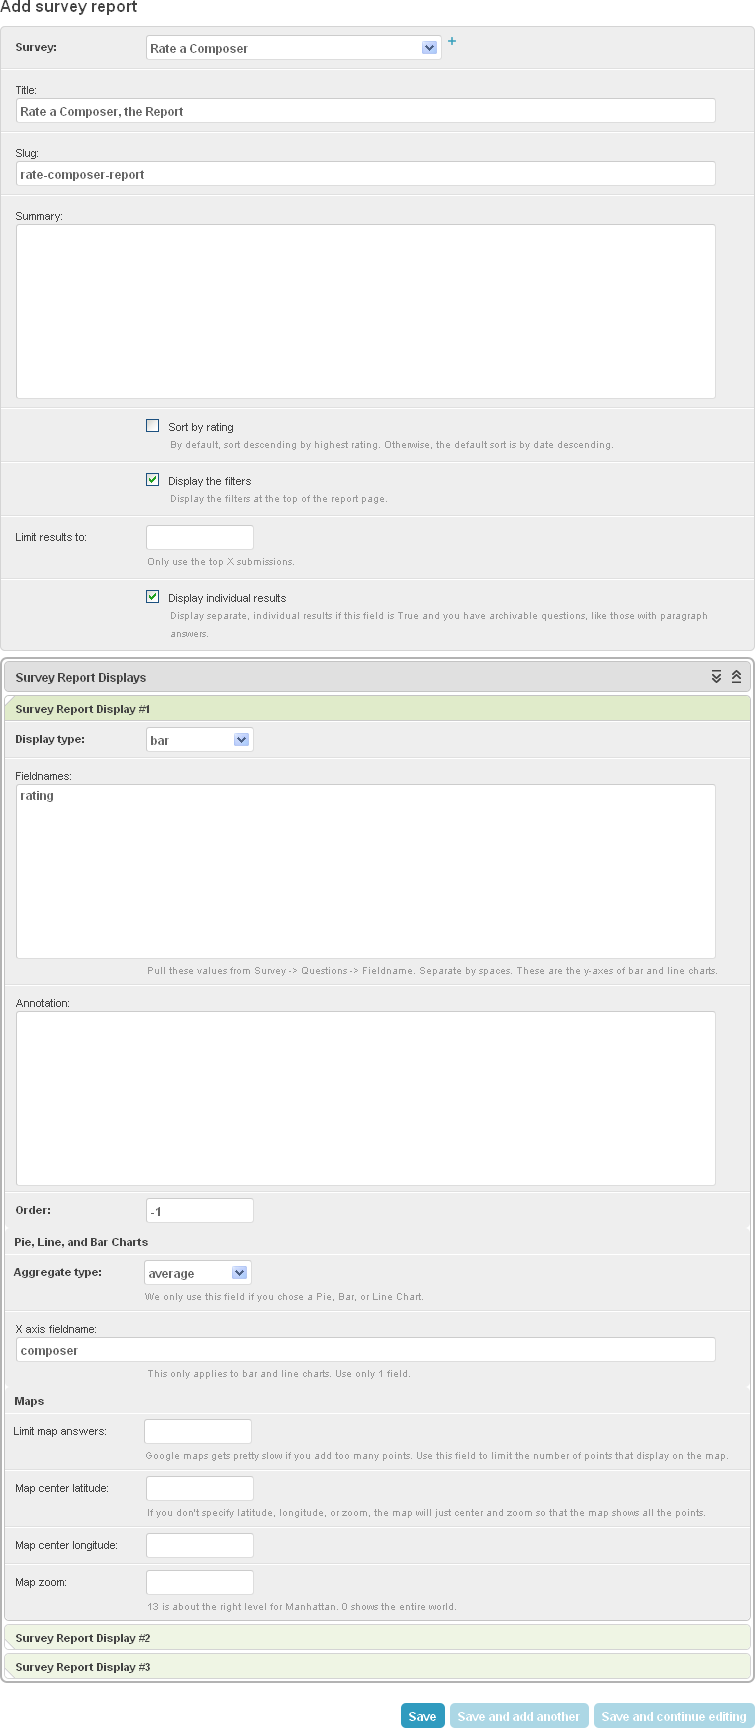
Rate a Composer
In this approach we will let each user pick a single composer and rate him or her. Then we’ll display a bar chart that shows the average rating that each composer receives. Again we’ll let each user vote multiple times.

