Tools
There are two main tools of interest in circuits. These are:
These can be found in the circuits.tools module.
Introspecting your Application
The inspect() function is used to help introspect your application by displaying all the channels and events handlers defined through the system including any additional meta data about them.
Example:
>>> from circuits import Component
>>> class App(Component):
...     def foo(self):
...             pass
...
>>> app = App()
>>> from circuits.tools import inspect
>>> print(inspect(app))
 Components: 0

 Event Handlers: 3
  unregister; 1
   <handler[*.unregister] (App._on_unregister)>
  foo; 1
   <handler[*.foo] (App.foo)>
  prepare_unregister_complete; 1
   <handler[<instance of App>.prepare_unregister_complete] (App._on_prepare_unregister_complete)>
Displaying a Visual Representation of your Application
The graph() function is used to help visualize the different components in your application and how they interact with one another and how they are registered in the system.
In order to get a image from this you must have the following packages installed:
You can install the required dependencies via:
pip install matplotlib networkx pygraphviz
Example:
>>> from circuits import Component, Debugger
>>> from circuits.net.events import write
>>> from circuits.net.sockets import TCPServer
>>>
>>> class EchoServer(Component):
...     def init(self, host="0.0.0.0", port=8000):
...             TCPServer((host, port)).register(self)
...             Debugger().register(self)
...     def read(self, sock, data):
...             self.fire(write(sock, data))
...
>>> server = EchoServer()
>>>
>>> from circuits.tools import graph
>>> print(graph(server))
* <EchoServer/* 784:MainThread (queued=2) [S]>
 * <TCPServer/server 784:MainThread (queued=0) [S]>
 * <Debugger/* 784:MainThread (queued=0) [S]>
An output image will be saved to your current working directory and by called <name>.png where <name> is the name of the top-level component in your application of the value you pass to the name= keyword argument of ~circuits.tools.graph.
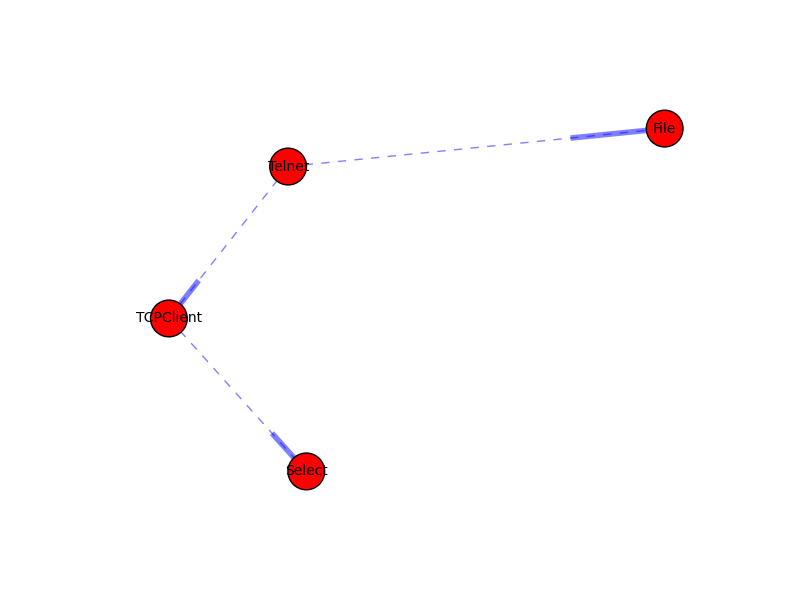
Example output of telnet Example:

And its DOT Graph:
![strict digraph {
TCPClient -> Select [weight="2.0"];
Telnet -> TCPClient [weight="1.0"];
Telnet -> File [weight="1.0"];
}](../../_images/graphviz-b83b24d47415abeb6163e2ff753b8a7fed644c3e.png)