Identifying memory leaks
Muppy tries to help developers to identity memory leaks of Python applications. It enables the tracking of memory usage during runtime and the identification of objects which are leaking. Additionally, tools are provided which allow to locate the source of not released objects.
Muppy is (yet another) Memory Usage Profiler for Python. The focus of this toolset is laid on the identification of memory leaks. Let’s have a look what you can do with muppy.
The muppy module
Muppy allows you to get hold of all objects,
>>> from pympler import muppy
>>> all_objects = muppy.get_objects()
>>> len(all_objects)
19700
or filter out certain types of objects.
>>> import types
>>> my_types = muppy.filter(all_objects, Type=types.ClassType)
>>> len(my_types)
72
>>> for t in my_types:
...     print t
...
UserDict.IterableUserDict
UserDict.UserDict
UserDict.DictMixin
os._Environ
sre_parse.Tokenizer
sre_parse.SubPattern
re.Scanner
string._multimap
distutils.log.Log
encodings.utf_8.StreamWriter
encodings.utf_8.StreamReader
codecs.StreamWriter
codecs.StreamReader
codecs.StreamReaderWriter
codecs.Codec
codecs.StreamRecoder
tokenize.Untokenizer
inspect.BlockFinder
sre_parse.Pattern
. . .
This result, for example, tells us that the number of lists remained the same, but the memory allocated by lists has increased by 8 bytes. The correct increase for a LP64 system (see 64-Bit_Programming_Models).
The summary module
You can create summaries
>>> from pympler import summary
>>> sum1 = summary.summarize(all_objects)
>>> summary.print_(sum1)
                       types |   # objects |   total size
============================ | =========== | ============
                        dict |         546 |    953.30 KB
                         str |        8270 |    616.46 KB
                        list |         127 |    529.44 KB
                       tuple |        5021 |    410.62 KB
                        code |        1378 |    161.48 KB
                        type |          70 |     61.80 KB
          wrapper_descriptor |         508 |     39.69 KB
  builtin_function_or_method |         515 |     36.21 KB
                         int |         900 |     21.09 KB
           method_descriptor |         269 |     18.91 KB
                     weakref |         177 |     15.21 KB
         <class 'abc.ABCMeta |          16 |     14.12 KB
                         set |          48 |     10.88 KB
         function (__init__) |          81 |      9.49 KB
           member_descriptor |         131 |      9.21 KB
and compare them with other summaries.
>>> sum2 = summary.summarize(muppy.get_objects())
>>> diff = summary.get_diff(sum1, sum2)
>>> summary.print_(diff)
                          types |   # objects |   total size
=============================== | =========== | ============
                           list |        1097 |      1.07 MB
                            str |        1105 |     68.21 KB
                           dict |          14 |     21.08 KB
             wrapper_descriptor |         215 |     16.80 KB
                            int |         121 |      2.84 KB
                          tuple |          30 |      2.02 KB
              member_descriptor |          25 |      1.76 KB
                        weakref |          14 |      1.20 KB
              getset_descriptor |          15 |      1.05 KB
              method_descriptor |          12 |    864     B
  frame (codename: get_objects) |           1 |    488     B
     builtin_function_or_method |           6 |    432     B
     frame (codename: <module>) |           1 |    424     B
         classmethod_descriptor |           3 |    216     B
                           code |           1 |    120     B
The tracker module
Of course we don’t have to do all these steps manually, instead we can use muppy’s tracker.
>>> from pympler import tracker
>>> tr = tracker.SummaryTracker()
>>> tr.print_diff()
                                 types |   # objects |   total size
====================================== | =========== | ============
                                  list |        1095 |    160.78 KB
                                   str |        1093 |     66.33 KB
                                   int |         120 |      2.81 KB
                                  dict |           3 |    840     B
      frame (codename: create_summary) |           1 |    560     B
          frame (codename: print_diff) |           1 |    480     B
                frame (codename: diff) |           1 |    464     B
                 function (store_info) |           1 |    120     B
                                  cell |           2 |    112     B
A tracker object creates a summary (that is a summary which it will remember) on initialization. Now whenever you call tracker.print_diff(), a new summary of the current state is created, compared to the previous summary and printed to the console. As you can see here, quite a few objects got in between these two invocations. But if you don’t do anything, nothing will change.
>>> tr.print_diff()
  types |   # objects |   total size
======= | =========== | ============
Now check out this code snippet
>>> i = 1
>>> l = [1,2,3,4]
>>> d = {}
>>> tr.print_diff()
  types |   # objects |   total size
======= | =========== | ============
   dict |           1 |    280     B
   list |           1 |    192     B
As you can see both, the new list and the new dict appear in the summary, but not the 4 integers used. Why is that? Because they existed already before they were used here, that is some other part in the Python interpreter code makes already use of them. Thus, they are not new.
The refbrowser module
In case some objects are leaking and you don’t know where they are still referenced, you can use the referrers browser. At first let’s create a root object which we then reference from a tuple and a list.
>>> from pympler import refbrowser
>>> root = "some root object"
>>> root_ref1 = [root]
>>> root_ref2 = (root, )
>>> def output_function(o):
...     return str(type(o))
...
>>> cb = refbrowser.ConsoleBrowser(root, maxdepth=2, str_func=output_function)
Then we create a ConsoleBrowser, which will give us a referrers tree starting at root, printing to a maximum depth of 2, and uses str_func to represent objects. Now it’s time to see where we are at.
>>> cb.print_tree()
<type 'str'>-+-<type 'dict'>-+-<type 'list'>
             |               +-<type 'list'>
             |               +-<type 'list'>
             |
             +-<type 'dict'>-+-<type 'module'>
             |               +-<type 'list'>
             |               +-<type 'frame'>
             |               +-<type 'function'>
             |               +-<type 'list'>
             |               +-<type 'frame'>
             |               +-<type 'list'>
             |               +-<type 'function'>
             |               +-<type 'frame'>
             |
             +-<type 'list'>--<type 'dict'>
             +-<type 'tuple'>--<type 'dict'>
             +-<type 'dict'>--<class 'muppy.refbrowser.ConsoleBrowser'>
What we see is that the root object is referenced by the tuple and the list, as well as by three dictionaries. These dictionaries belong to the environment, e.g. the ConsoleBrowser we just started and the current execution context.
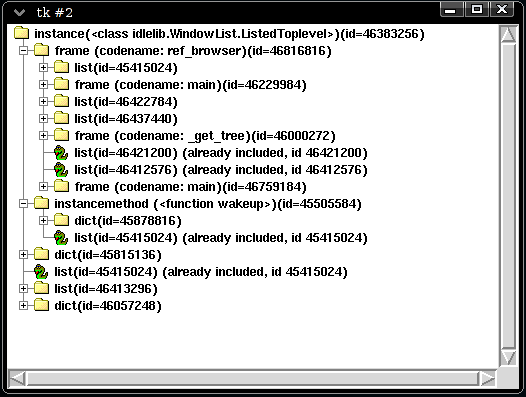
This console browsing is of course kind of inconvenient. Much better would be an InteractiveBrowser. Let’s see what we got.
>>> from pympler import refbrowser
>>> ib = refbrowser.InteractiveBrowser(root)
>>> ib.main()

Now you can click through all referrers of the root object.