GUI development : Make your own interactive Qt based graphical apps
Code Example for a data logger
A code example on how to inherit the utilitiesClass, and develop a simple data logger
1 2 3 4 5 6 7 8 9 10 11 12 13 14 15 16 17 18 19 20 21 22 23 24 25 26 27 28 29 30 31 32 33 34 35 36 37 38 39 40 41 42 43 44 45 46 47 48 49 50 51 52 53 54 55 56 57 58 59 60 61 62 63 64 65 66 67 68 69 70 | #!/usr/bin/python
from SEEL import interface
from SEEL_Apps.utilitiesClass import utilitiesClass #import the utilities
#import a preconstructed template file stored in SEEL_Apps/templates
#It contains a vertical layout called plot_area , horizontal layouts called bottomLayout, widgetsLayout, controlsLayout
from SEEL_Apps.templates import ui_template_graph_nofft as template_graph_nofft
import numpy as np
from PyQt4 import QtGui,QtCore
import sys,time
#This class handles everything, but skip to the end to see how it is initialized.
#It inherits the helper class called utilitiesClass . This crudely means , that the methods of utilitiesClass, can now be assumed to be members of this class
class AppWindow(QtGui.QMainWindow, template_graph_nofft.Ui_MainWindow,utilitiesClass):
def __init__(self, parent=None):
super(AppWindow, self).__init__(parent)
self.setupUi(self)
self.I = interface.connect()
#set the window title
self.setWindowTitle('My First App')
self.plot=self.add2DPlot(self.plot_area,enableMenu=False) #Create a plot inside the plot_area. disable the right click menu
self.plot.setLabel('left','Voltage', units='V') #Set the Y-Axis Label , and units
self.plot.setLabel('bottom','Time', units='S') #Set the X-Axis
self.I.select_range('CH1',8) #Set the gain of CH1 to +/-8V
self.plot.setYRange(-8,8) #Set the default Y range shown to the user
self.plot.setLimits(yMax=8,yMin=-8) #Prevent the user from zooming/panning out of this specified region
self.samples = 2000 #Total samples in the buffer
self.legend = self.plot.addLegend(offset=(-10,30))
self.curve1 = self.addCurve(self.plot,'INPUT (CH1)') #Create a curve . It is automatically added to the legend created in the previous line
self.X=np.linspace(-10,0,self.samples);self.Y = np.zeros(self.samples) #Create the X-Axis . 2000 points from -10 to 0 .
self.WidgetLayout.setAlignment(QtCore.Qt.AlignLeft) #Change the alignment of the WidgetLayout
self.addPauseButton(self.bottomLayout,self.pause) #Add a QCheckBox to the bottomLayout
self.paused=False;self.running=True
self.timer = self.newTimer()
self.timer.timeout.connect(self.run_np) #Connect the run_np function to a timer
self.num=0
self.ST=time.time()
self.timer.start(3) #set the timer to fire every 3mS
def pause(self,v): #The pause button was bound to this function. Whenever the user clicks on it, this function is executed with the button state as the argument
self.paused = v
def run_np(self): #The function that does pretty much the main job
if self.paused or not self.running: return #If the pause button is checked, do nothing and return... wait to be executed again by the timer
self.X = np.roll(self.X,-1) #rotate X-Axis array to the left. X[n] -> X[n-1], X[0] becomes X[last]
self.Y = np.roll(self.Y,-1)
self.X[-1]=(time.time()-self.ST) #store the timestamp in the last element of XAXIS
self.Y[-1]=self.I.get_average_voltage('CH1') #store the voltage value in the last element
self.curve1.setData(self.X,self.Y)
self.plot.enableAutoRange(axis = self.plot.plotItem.vb.XAxis)
def saveData(self): #The saveData button was part of the GUI template we're using. It expects to see this function
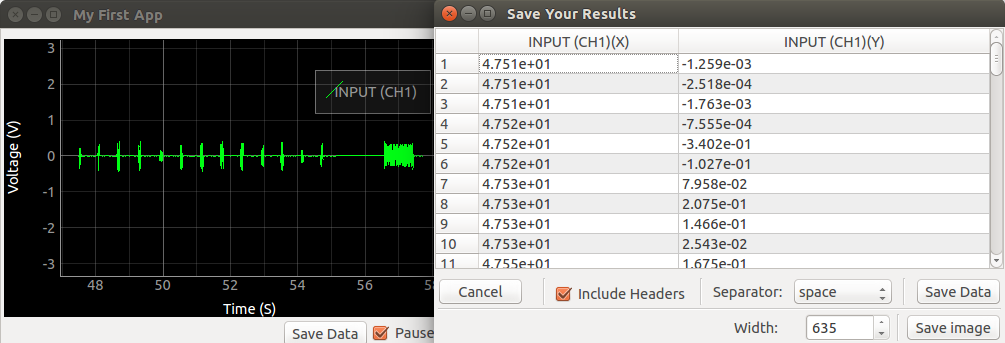
self.saveDataWindow([self.curve1],self.plot) #This launches a spreadsheet containing the values of curve1. It also lets you take a picture of the graph
def closeEvent(self, event): #perform a clean exit by stopping the timer first
self.running=False
self.timer.stop()
self.finished=True
if __name__ == "__main__":
app = QtGui.QApplication(sys.argv) #Create a Qt Event Handler
myapp = AppWindow() #Launch the app
myapp.show()
sys.exit(app.exec_()) #Exit once the app has finished executing
|
Helper Methods : Utilities
- class SEEL_Apps.utilitiesClass.utilitiesClass[source]
This class contains methods that simplify setting up and running an experiment.
feature list :
- 2D Plots
- Embed a PyQtgraph PlotWidget into a specified Qt Layout
- Add curves into a supplied PlotWidget, and maintain a list.
- Add crosshairs
Create a widget with a button, and an associated function that is called when the button is clicked. The return value of the function is shown in a label on the same widget
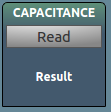
Arguments **kwargs TITLE Text shown on the top section of the widget FUNC function to be run when the button is clicked UNITS SI units used when the user clicks the button, and the results are displayed in the label TOOLTIP text to be displayed when the mouse hovers over the widget Returns: the widget . You may add this to any layout
- class utilitiesClass.dialAndDoubleSpinIcon(**args)[source]
Create a widget with a knob, and an associated function that is called when the knob is turned by the user. It also contains a number entry field connected to the knob if the user wishes to manually enter a value
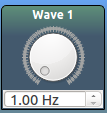
Arguments **kwargs TITLE Text shown on the top section of the widget FUNC function to be run when the knob is turned UNITS SI units of the entry field TOOLTIP text to be displayed when the mouse hovers over the widget LINK Another function to which the return value of FUNC is passed when an event occurs MIN minimum limit for the knob MAX maximum limit for the knob Returns: the widget . You may add this to any layout
- class utilitiesClass.dialIcon(**args)[source]
Create a widget with a knob, and an associated function that is called when the knob is turned by the user
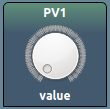
Arguments **kwargs TITLE Text shown on the top section of the widget FUNC function to be run when the knob is turned UNITS SI units of the entry field TOOLTIP text to be displayed when the mouse hovers over the widget LINK Another function to which the return value of FUNC is passed when an event occurs MIN minimum limit for the knob MAX maximum limit for the knob Returns: the spin widget . You may add this to any layout
- class utilitiesClass.doubleSpinIcon(**args)[source]
Create a widget with a number entry field with decimal support, and an associated function that is called when the value of the field changes
Arguments **kwargs TITLE Text shown on the top section of the widget FUNC function to be run when the value of the widget changes UNITS SI units of the entry field TOOLTIP text to be displayed when the mouse hovers over the widget LINK Another function to which the return value of FUNC is passed when an event occurs MIN minimum limit for the number entry MAX maximum limit for the number entry Returns: the double spin widget . You may add this to any layout
- class utilitiesClass.dualButtonIcon(**args)[source]
Create a widget with two buttons, and associated functions that are called when the buttons are clicked. The return values of the functions are not shown
Arguments **kwargs TITLE Text shown on the top section of the widget A Text shown on button A B Text shown on button B FUNCA function to be run when the first button is clicked FUNCB function to be run when the second button is clicked UNITS SI units used when the user clicks the button, and the results are displayed in the label TOOLTIP text to be displayed when the mouse hovers over the widget Returns: the widget . You may add this to any layout
- class utilitiesClass.spinIcon(**args)[source]
Create a widget with a number entry field, and an associated function that is called when the value of the field changes
Arguments **kwargs TITLE Text shown on the top section of the widget FUNC function to be run when the value of the widget changes UNITS SI units of the entry field TOOLTIP text to be displayed when the mouse hovers over the widget LINK Another function to which the return value of FUNC is passed when an event occurs MIN minimum limit for the number entry MAX maximum limit for the number entry Returns: the spin widget . You may add this to any layout
- class utilitiesClass.wideButtonIcon(**args)[source]
Create a widget with a wide button, and an associated function that is called when the button is clicked. The return value of the function is shown in a giant label on the same widget
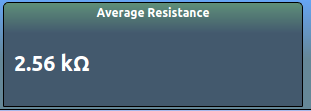
Arguments **kwargs TITLE Text shown on the top section of the widget FUNC function to be run when the button is clicked UNITS SI units used when the user clicks the button, and the results are displayed in the label TOOLTIP text to be displayed when the mouse hovers over the widget Returns: the widget . You may add this to any layout
- utilitiesClass.add2DPlot(plot_area, **args)[source]
Add a 2D plot to a specified Qt Layout
Arguments plot_area QtGui.<some layout> to add a 2D plot to Returns: pyqtgraph.PlotWidget
- utilitiesClass.add3DPlot(plot_area)[source]
Add a 3D plot to a specified Qt Layout
Arguments plot_area QtGui.<some layout> to add a 3D plot to Returns: pyqtgraph.gl.GLViewWidget
- utilitiesClass.addAxis(plot, **args)[source]
Add an axis on the right side
Arguments plot pyqtgraph.PlotWidget *args - label
Label of the new axis Returns: pg.ViewBox
- utilitiesClass.addCurve(plot, name='', **kwargs)[source]
Add a new curve to a 2D plot
Arguments plot QPlotWidget created using add2DPlot() name something to call this trace. Shown in the legend too Returns: pyqtgraph.PlotDataItem
- utilitiesClass.applySIPrefix(value, unit='', precision=2)[source]
Convert a given value into scientific notation
Arguments value The number to convert into a human readable form unit SI units to suffix. Leave blank if not needed precision Decimal precision digits applySIPrefix(1010,'Hz') >>> 1.01kHz
- utilitiesClass.delayedTask(interval, func, *args)[source]
Execute a function after ‘interval’ milliseconds
Arguments interval Time delay before execution func function to be run *args arguments for that function. in order. Returns: the timer . tmr = delayedTask(5000,np.sin,np.pi/2) #calculate sin(pi/2) after 5 seconds #equivalent to : time.sleep(5) np.sin(np.pi/2)
- utilitiesClass.displayCrossHairData(plot, fmode, ns, tg, axes, cols)[source]
Warning
beta function to extract specific coordinate data from curves , and show them as the plot title
Arguments plot The plot to activate this feature on fmode Set to True if fourier transform mode is active ns Number of samples tg time gap axes axes cols list of trace colours
- utilitiesClass.enableCrossHairs(plot, curves=[])[source]
Enables crosshairs on the specified plot
Arguments plot The plot to activate this feature on
- utilitiesClass.enableShortcuts()[source]
Enable the following shortcuts :
- CTRL-S : Opens the saveData window for saving trace data . It will load the coordinate data from all curves created using addCurve()
- utilitiesClass.fetchColumns(qtablewidget, *args)[source]
Fetch columns from a QTableWidget
Arguments qtablewidget Widget in question *args columns numbers Returns: 2D array of requested elements [[col1R0,col1,R1,col1,R3...col1Rn],[col2R0,col2,R1,col2,R3...col2Rn], ...]
- utilitiesClass.killAllTimers()[source]
Stop all timers created using either delayedTask() or loopTask()
- utilitiesClass.loopTask(interval, func, *args)[source]
Execute a function every ‘interval’ milliseconds
Arguments interval Time delay between consecutive executions func function to be run *args arguments for that function. in order. Returns: the timer . You should store this if you will need to stop this event loop at some point tmr = loopTask(100,np.sin,np.pi/2) #calculate sin(pi/2) every 100mS = 0.1 seconds #equivalent to : while True: np.sin(np.pi/2) time.sleep(0.1)
- utilitiesClass.newTimer()[source]
Create a QtCore.QTimer object and return it. A reference is also stored in order to keep track of it
- utilitiesClass.removeCurve(plot, curve)[source]
Remove a curve from a plot
Arguments plot pyqtgraph.PlotWidget created using add2DPlot() name pyqtgraph.PlotDataItem created for the specified plot using addCurve()
- utilitiesClass.rightClickToZoomOut(plot)[source]
Enables zooming out when the user presses the right mouse button on the plot
Arguments plot The plot to activate this feature on
- 2D Plots