Acquiring Data
As an example, set SQR1's frequency to 10KHz using the knob in the controls section.
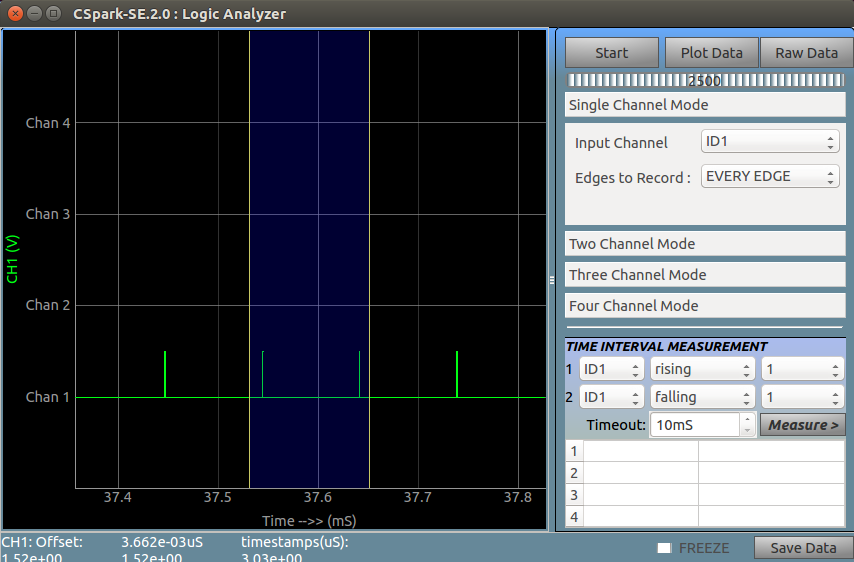
Set its duty cycle to 0.03% using the adjacent duty cycle knob
You have now set the device to output a 10KHz square wave via SQR1 , and it spends only 0.03% of its time in the ON state(5V), and it's at 0V the rest of the time
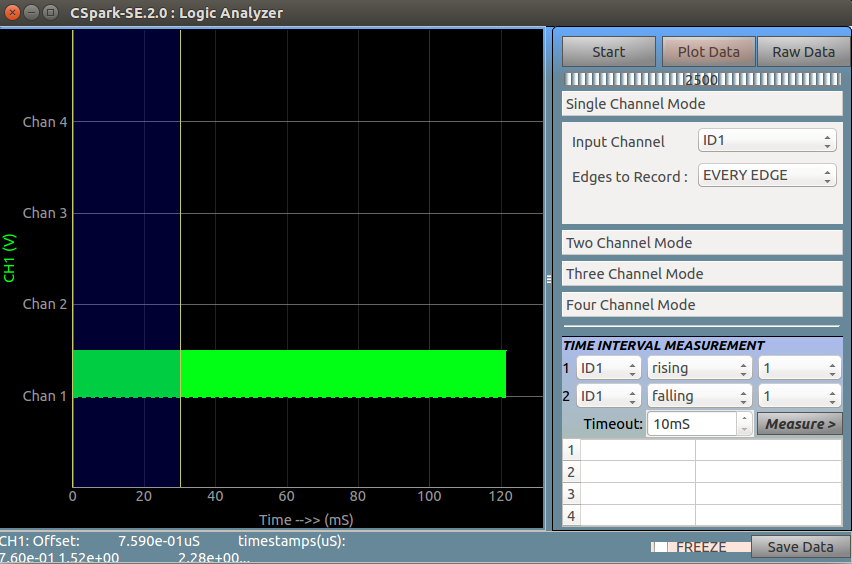
In single channel mode, click on the START button. Once 2500 samples have been acquired(almost immediately for a 10KHz square wave) , click on PLOT DATA

Use the mouse wheel to scroll and zoom the plot
Drag the blue selection region to the area you wish to analyze

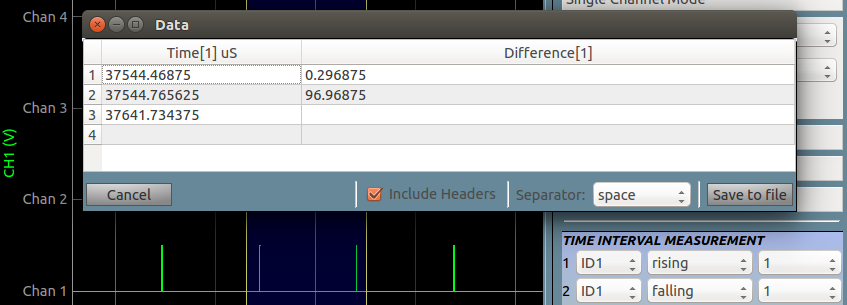
Once you click on RAW DATA, the time values of the various level changes in uS units will be shown in a spreadsheet
They are ready to export as data or images

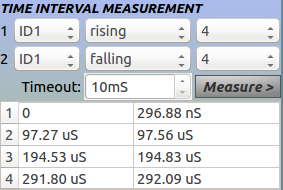
The timing measurements section allows you to measure intervals between various logic changes between different/same inputs


