Contourx
-
class
decida.Contourx.Contourx(parent=None, **kwargs)¶ Bases:
decida.PlotBase.PlotBasesynopsis:
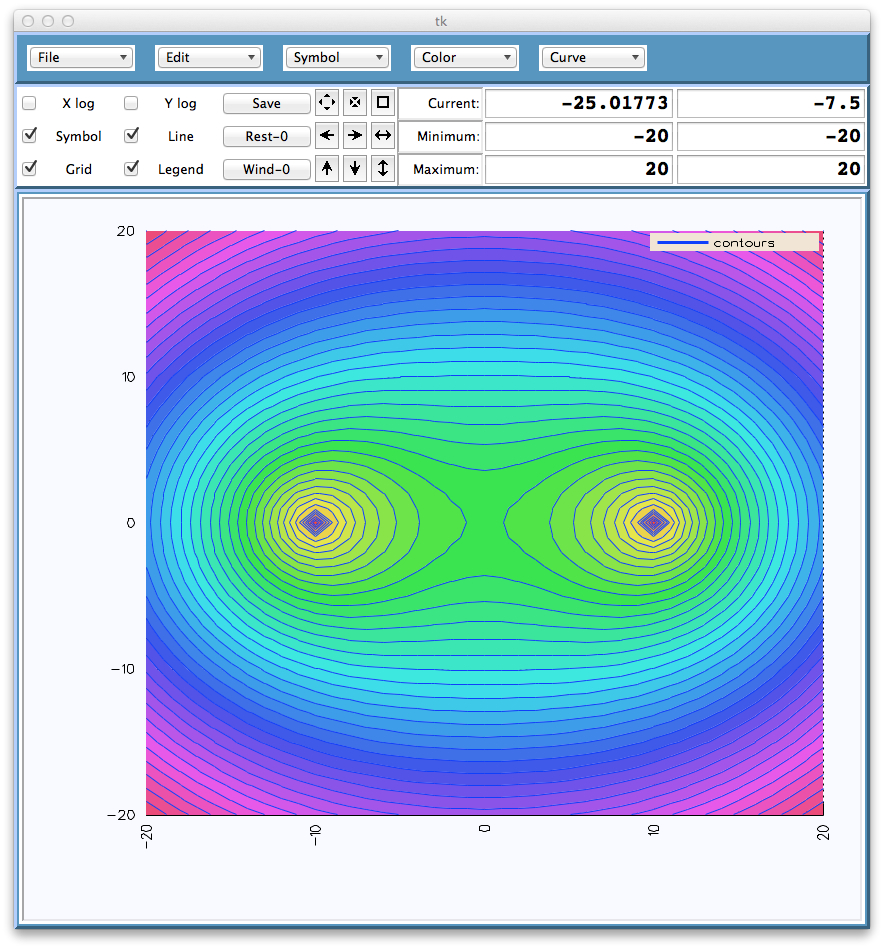
Plot color-band and/or line contours.
Contourx plots color contour bands and/or contour lines of a 3-dimensional surface specified on points on a 2-dimensional grid.
The color bands can be hidden, leaving only the contour lines, or contour lines can be hidden, leaving only the color bands.
The Edit->Settings dialog can be used to add more (equally-spaced) contour values.
constructor arguments:
parent (Tkinter handle, default=None)
handle of frame or other widget to pack plot in. if this is not specified, top-level is created.**kwargs (dict)
keyword=value specifications: options or configuration-optionsoptions:
xvalues (list of float)
list of x values. [x[0], ... , x[nx]]yvalues (list of float)
list of y values. [y[0], ... , y[ny]]zvalues (list of lists of float)
list of z values corresponding x, y points [x[0], y[0], ... , x[0], y[ny]], ... ... ... [x[nx], y[0], ... , x[nx], y[ny]]configuration options:
verbose (bool, default=False)
enable/disable verbose modetitle (str, default=””)
main titlextitle (str, default=””)
x-axis titleytitle (str, default=””)
y-axis titleplot_height (str, default=”10i” for MacOS, else “7i”)
Height of plot window (Tk inch or pixelspecification)plot_width (str, default=”10i” for MacOS, else “7i”)
Width of plot window (Tk inch or pixel specification)plot_background (str, default=”GhostWhite”)
Background color of plot window.legend_background (str, default=”AntiqueWhite2”)
Background color of legend.grid_color (str, default=”black”)
Color of contour grid.num_contours (int, default=21)
number of contours.show_bands (bool, default=True)
if True, show contour color-bands.- colors (list of str, default = [“blue”, “red”, “green”,
- “orange”, “cyan”, “brown”, “black”, “blue violet”, “cadet blue”, “dark cyan”, “dark goldenrod”, “dark green”, “dark magenta”, “dark olive green”, “dark orange”, “dark red”, “dark slate blue”, “dark slate gray”, “dodger blue”, “forest green”, “steel blue”, “sienna”])
list of colors for curves. Used to populate color menu, and to specify curve colors in scripted “command” option.
- symbols (list of str, default = [“none”, “dot”, “square”,
- “diamond”, “triangle”, “itriangle”, “dash”, “pipe”, “plus”, “cross”, “spade”, “heart”, “diam”, “club”, “shamrock”, “fleurdelis”, “circle”, “star”])
list of symbols for curves. Used to populate symbol menu, and to specify curve symbols in scripted “command” option.
ssizes (list of float, default = [0.01])
list of symbol sizes for curves. Used to specify curve symbol sizes in scripted “command” option.wlines (list of int, default = [1])
list of line widths for curves. Used to specify curve line widths in scripted “command” option.traces (list of str, default = [“increasing”])
list of traces for curves. each trace can be one of: “increasing”, “decreasing”, or “both”. Used to specify curve trace directions in scripted “command” option.xaxis (str, default=”lin”)
linear or logarithmic axis: “lin” or “log”yaxis (str, default=”lin”)
linear or logarithmic axis: “lin” or “log”xmin (float, default=0.0)
xaxis minimumxmax (float, default=0.0)
xaxis maximumymin (float, default=0.0)
yaxis minimumymax (float, default=0.0)
yaxis maximumgrid (bool, default=True)
if true, show grid on plotlegend (bool, default=True)
if true, show legend on plotpostscript (bool, default=False)
if true, generate a PostScript file.postscript_file (str, default=”plot.ps”)
name of PostScript file to plot towait (bool, default=False)
wait in main-loop until window is destroyed.destroy (bool, default=False)
destroy main window after it has been displayed. useful for displaying, generating PostScript, then destroying window.example (from test_Contourx_1):
import decida, math
from decida.Contourx import Contourx

xmin, xmax, ymin, ymax, nx, ny, nc = -20, 20, -20, 20, 41, 41, 41
def zfunction(x, y) :
    return math.pow(
        (math.pow((x-10.0),2.0)+math.pow(y,2.0))*
        (math.pow((x+10.0),2.0)+math.pow(y,2.0)), 0.25
    )
xvalues = decida.range_sample(xmin, xmax, num=nx)
yvalues = decida.range_sample(ymin, ymax, num=ny)
zvalues = []
for x in xvalues :
    zx = list()
    for y in yvalues :
        z = zfunction(x, y)
        zx.append(z)
    zvalues.append(zx)
c=Contourx(None, xvalues=xvalues, yvalues=yvalues, zvalues=zvalues, num_contours=nc)
public methods:
- public methods from PlotBase (2-dimensinal plot base class)